
We find slippage between the factor returns realized by mutual fund managers and the theoretical factor returns “earned” by long–short paper portfolios over the period 1991–2016.
The source of the slippage appears to be costs related to implementation, such as trading costs, missed trades, expenses of shorting, manager fees, stale prices, bid–ask spreads, and so forth.
Our research shows that over the last quarter-century the real-world return for the value and market factors is halved or worse than theoretical factor returns imply, and the momentum factor has provided no benefit whatever to the end-investor.
In 2016, Research Affiliates published a series of articles1 challenging the “smart beta” revolution. We pointed out that, while there is merit in many factor tilt and smart beta strategies, performance chasing in these strategies—buying the popular outperforming strategies whose relative valuations are at extremely high levels—can be just as dangerous as performance chasing in other realms of asset management. We observe in factors and smart beta strategies that valuations matter just as they do in stock selection and asset allocation (i.e., lower relative valuations positively correlate with higher subsequent returns, and vice versa).
In this article, the first in a series to be published in 2017, we attempt to measure the slippage between the factor returns realized by fund managers and the theoretical factor returns constructed from long–short paper portfolios, and potential reasons for this slippage, or performance shortfall. Theoretical concepts, such as long–short factor portfolios, although helpful in advancing our understanding of a subject, are typically idealized approximations of the real world, built on a foundation of simplifying core assumptions, which are usually implausible at best.
We find that managers who favor high factor loadings for market beta, value, or momentum generally do not derive nearly as much incremental return, relative to low beta, growth, or contrarian funds, respectively, as factor return histories would suggest. Well over half of the factor return for market beta and for value (defined as HML) disappears, as does essentially all of the momentum factor return. By all appearances, Alice’s “Drink Me” potion, responsible for shrinking her so she can pass through the door to Wonderland, has found its way into real-world factor returns.
A Preview of the 2017 Smart Beta Series
Our 2017 smart beta series is called “Alice in Factorland.” Our next article in the series will challenge the idea that factor tilts—portfolios combining several theoretical factor portfolios—are smart beta. We will show that factor tilts cannot be used to replicate other smart beta strategies, using Fundamental Index™, equal weight, and low-volatility strategies as illustrative examples. The factor tilts of these strategies are easy to replicate, but the resulting portfolios look very different from the original, and the replication portfolios typically have far higher turnover, lower performance especially net of trading costs, and smaller capacity than the originals.
In a third article, we will show that the relative valuations of factor loadings can give us the courage to buy mutual funds when their factor exposures are at their cheapest, hence, the most out of favor. Along with fees, turnover, and past performance—where low fees, low turnover, and low (yes, low!) past performance are predictive of better future returns—factor loadings can help us improve our forecasts of fund returns. We find the best predictor is prior three-year performance, but with the wrong sign: buying the losers is the winningest strategy.
Finally, a fourth article will take a closer look at momentum, where we find the realized alpha in live portfolios is essentially zero compared to a theoretical alpha of around 6% a year. We show why momentum doesn’t work in live portfolios, and also show how momentum can be saved as a useful source of alpha.
Our Data
We use data from Morningstar Direct Mutual Fund Database. The dataset reports historical monthly total returns for all mutual funds, including those liquidated or merged, which ensures our mutual fund dataset is largely survivorship-bias free. To form our fund sample, we select those funds from the US open-end long-only equity fund universe that have at least two years of return history as of December 2016. Our fund sample size begins in 1990 with 658 funds (392 not counting different share classes: A-share, no-load, and institutional),2 peaks in 2008 with 3,800 funds, falling to about 3,000 funds in 2016. Our total US fund sample consists of 5,323 funds—a mixture of live funds and those that no longer exist today.
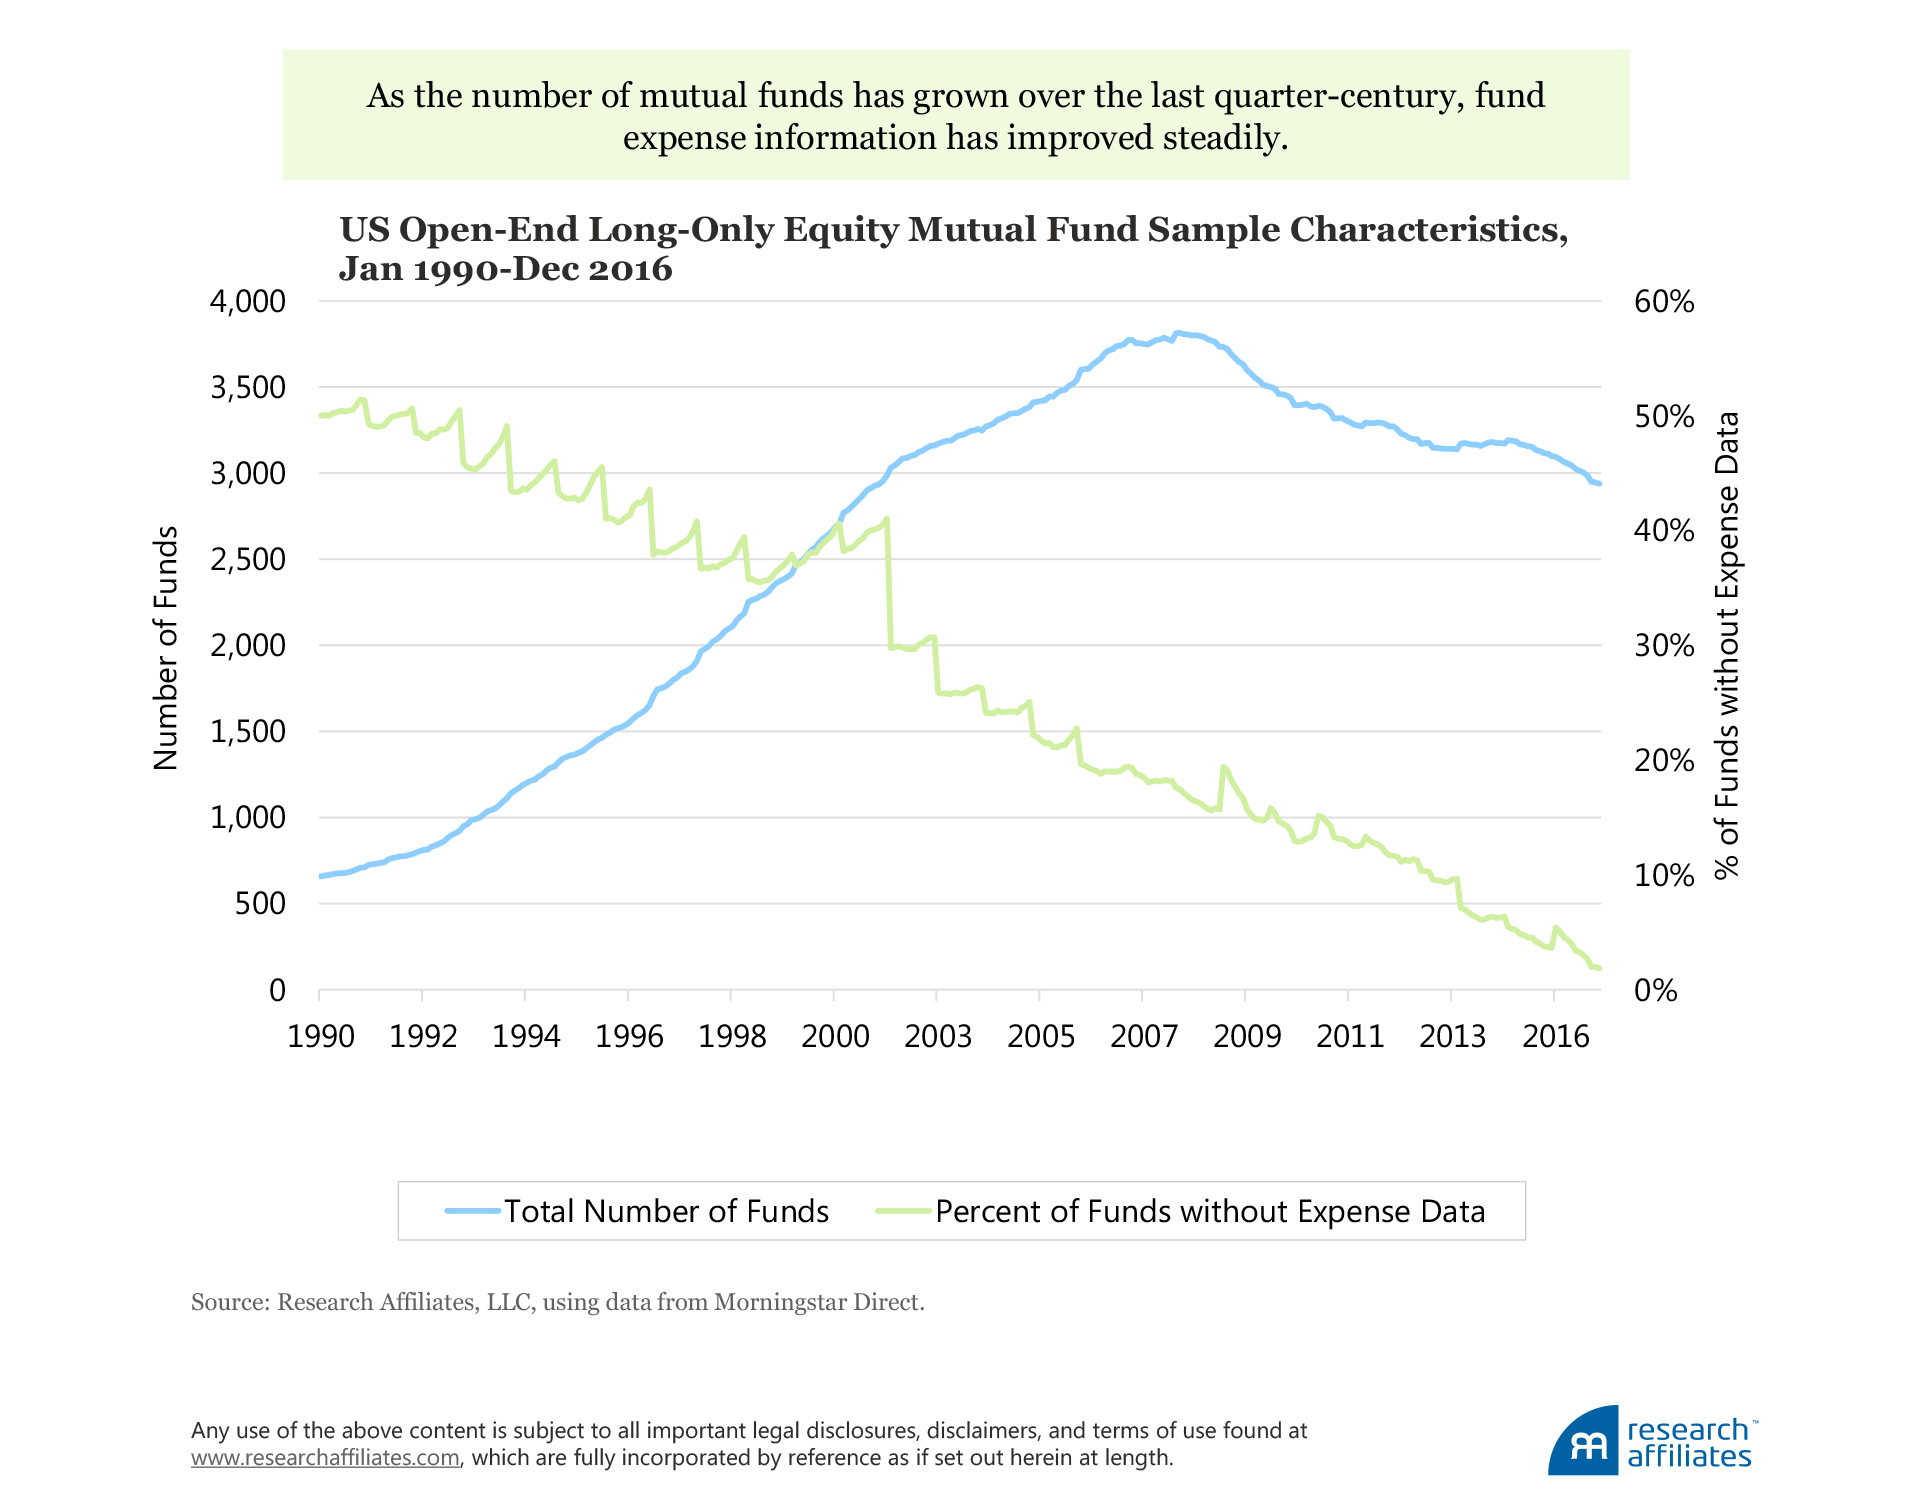
We begin our analysis in 1990 because, given the small number of unique funds prior to that date, our test to estimate multifactor premia could run into identification problems. Our main analyses use net-of-expense fund returns, which is how Morningstar Direct reports the data. One of our robustness tests (all of which are provided in the unabridged article) analyzes realized returns gross of expenses for the sample of funds that do report expense information. Information on fund expense ratios is not available for many funds, especially in the early years of our sample period, but for those with available expense data, results are essentially unchanged.
Measuring Theoretical Factor Returns
Four factors—market, size, value, and momentum—are the most widely used in manager performance evaluation. We focus on these four and ignore the myriad more recent, sometimes exotic, factors populating the “factor zoo.”3 We also limit ourselves to these four because the Morningstar data start in January 1990, and to include factors identified after that date would create look-ahead bias. Because these four factors were well known by 1990 (or shortly thereafter), both the theoretical factor returns from paper portfolios and the investors’ realized factor returns measured from actual fund performance are largely out of sample.
We calculate the theoretical factor performance by measuring factor returns using the method defined by Fama and French (1993): we construct a long–short portfolio, which is long the desirable trait and short the undesirable trait (e.g., the value factor is defined as a long value portfolio and a short growth portfolio). Over the last quarter-century, all four factors have positive performance.4 The market factor is the clear champion with an 8.2% annualized average return, followed by momentum at 5.7%. Value and size are well behind, with annualized returns of 3.6% and 2.6%, respectively.
In practice, the returns generated by long–short paper portfolios are difficult, if not impossible, to replicate for a number of reasons. These paper portfolios ignore trading costs, which is of particular importance for factors with high turnover such as momentum. Second, more than half of the factor return typically comes from trading in small-cap companies, whose real-world trading costs are likely to be high. For most factors, nearly half the return comes from the short side of the portfolio, and shorting may be expensive or impossible for some of the intended short sales. Another real-world concern is missed trades.
Paper portfolios also ignore management fees, a direct and significant drag on investor performance. In practice, investors may not be able to transact in the market place at the same prices assumed by the long–short portfolio as a result of stale prices and bid–ask spreads, which can be magnified by large institutional-sized trades. Finally, the delisting bias documented by Shumway and Warther (1999)5 can further overstate performance for some factors.
These sources of implementation shortfall are unlikely to affect the long and short portfolios equally, exacting for instance a greater penalty on small-cap versus large-cap stocks (size factor), on value versus growth stocks (value factor), and performance-chasing versus contrarian investing (momentum factor).
Measuring Realized Fund Returns
We measure factor return slippage, albeit with some imprecision, by comparing reverse-engineered factor returns, which are estimated from mutual fund returns, with the conventionally constructed factor returns. We follow the standard empirical method known as a two-pass regression procedure for estimating factor premia, which was introduced by Fama and MacBeth (1973). Instead of using theoretical portfolios with theoretical returns to estimate the factor premia, we use market-traded portfolios that capture the returns experienced by investors through net-of-expense mutual fund returns. A detailed description of our methodology is provided in the Appendix.
Our approach to measuring actual returns, as realized by mutual fund investors, could face a few possible criticisms. First, funds may have time-varying factor loadings, while our method assumes static fund factor loadings. Our method may provide inaccurate return estimations (that is, the return captured by mutual fund managers), if managers frequently switch their styles. Also, if factor returns are driven by factor characteristics (e.g., price-to-book ratio for value, past return for momentum, and market capitalization for size), the factor loadings we derive from regressions may poorly capture the funds’ time-varying factor exposures.6 Perhaps, if the data were available, it would be better to measure the factor tilts directly, applying the same methods used to construct the paper factor portfolios. We recognize these are valid concerns and will address them in later work. It bears mention that these same criticisms equally apply to factor-based historical return attribution, which is used widely.
Our Findings
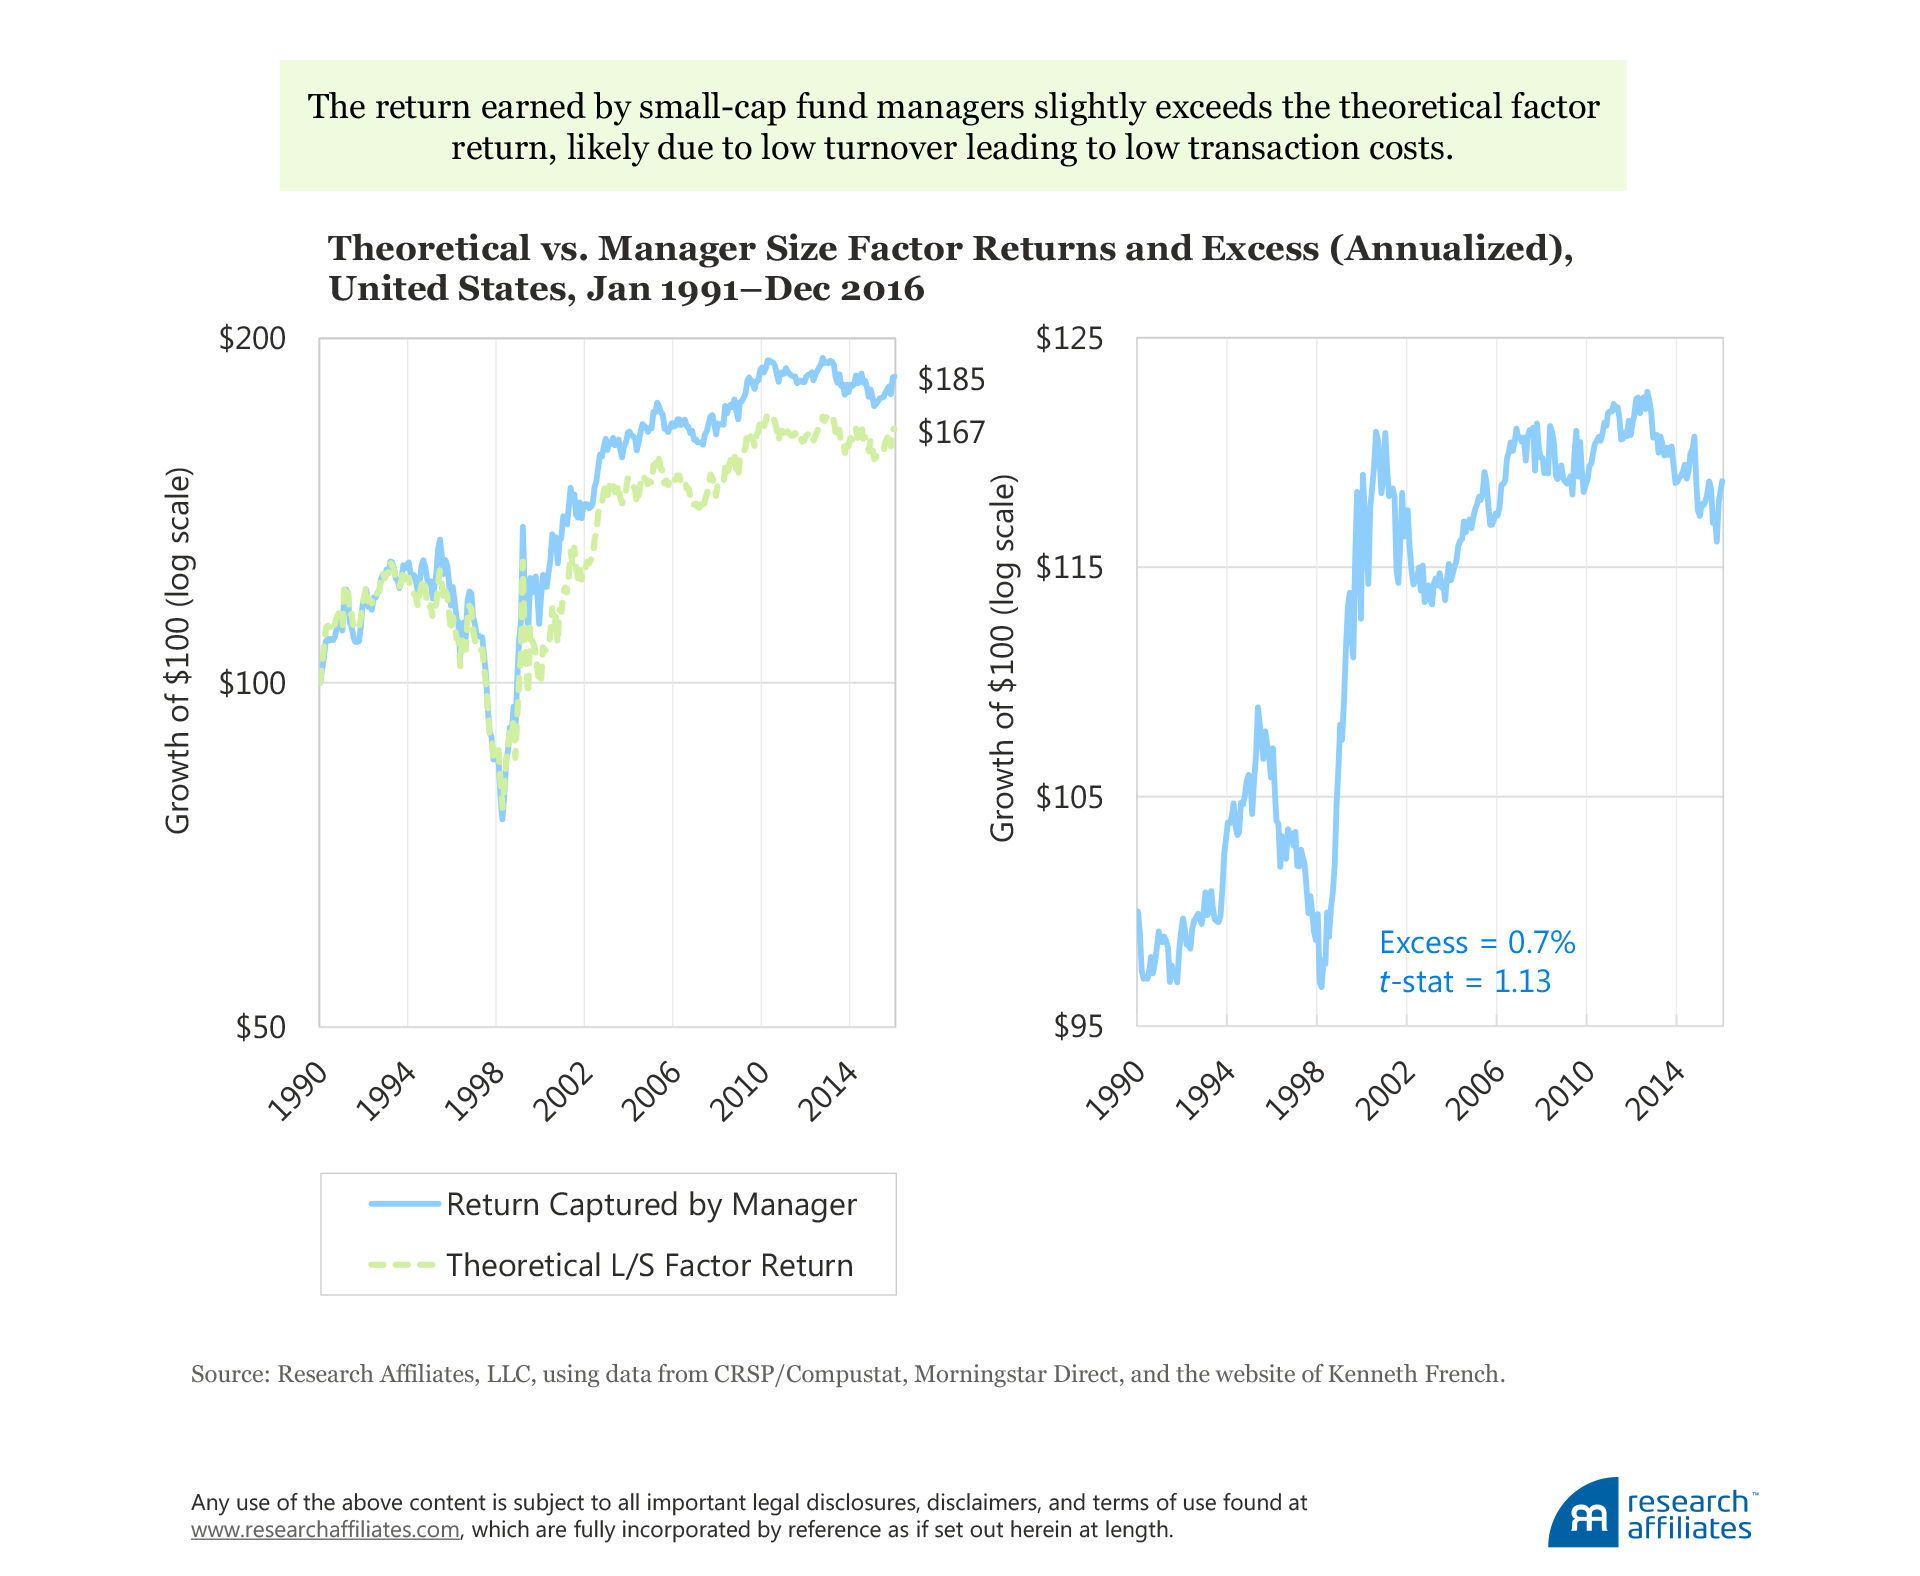
We find that the average factor premia captured by managers are significantly lower than suggested by the theoretical returns. This is true for all factors except size, for which managers capture a return 0.7% higher than theory indicates. The managers’ realized shortfall is −4.2% for the market factor, −1.4% for the value factor, and −5.2% for the momentum factor.
The correlation between the two types of returns (actual versus theoretical) is in the range of 0.89 to 0.96, with the average being 0.92. The average correlation suggests that the monthly behavior of the two sets of factor returns closely match each other. We carry out several robustness checks to see if our results are unique to our initial project design. All of our robustness checks (available in the unabridged version of this article) produce results that support our core findings.
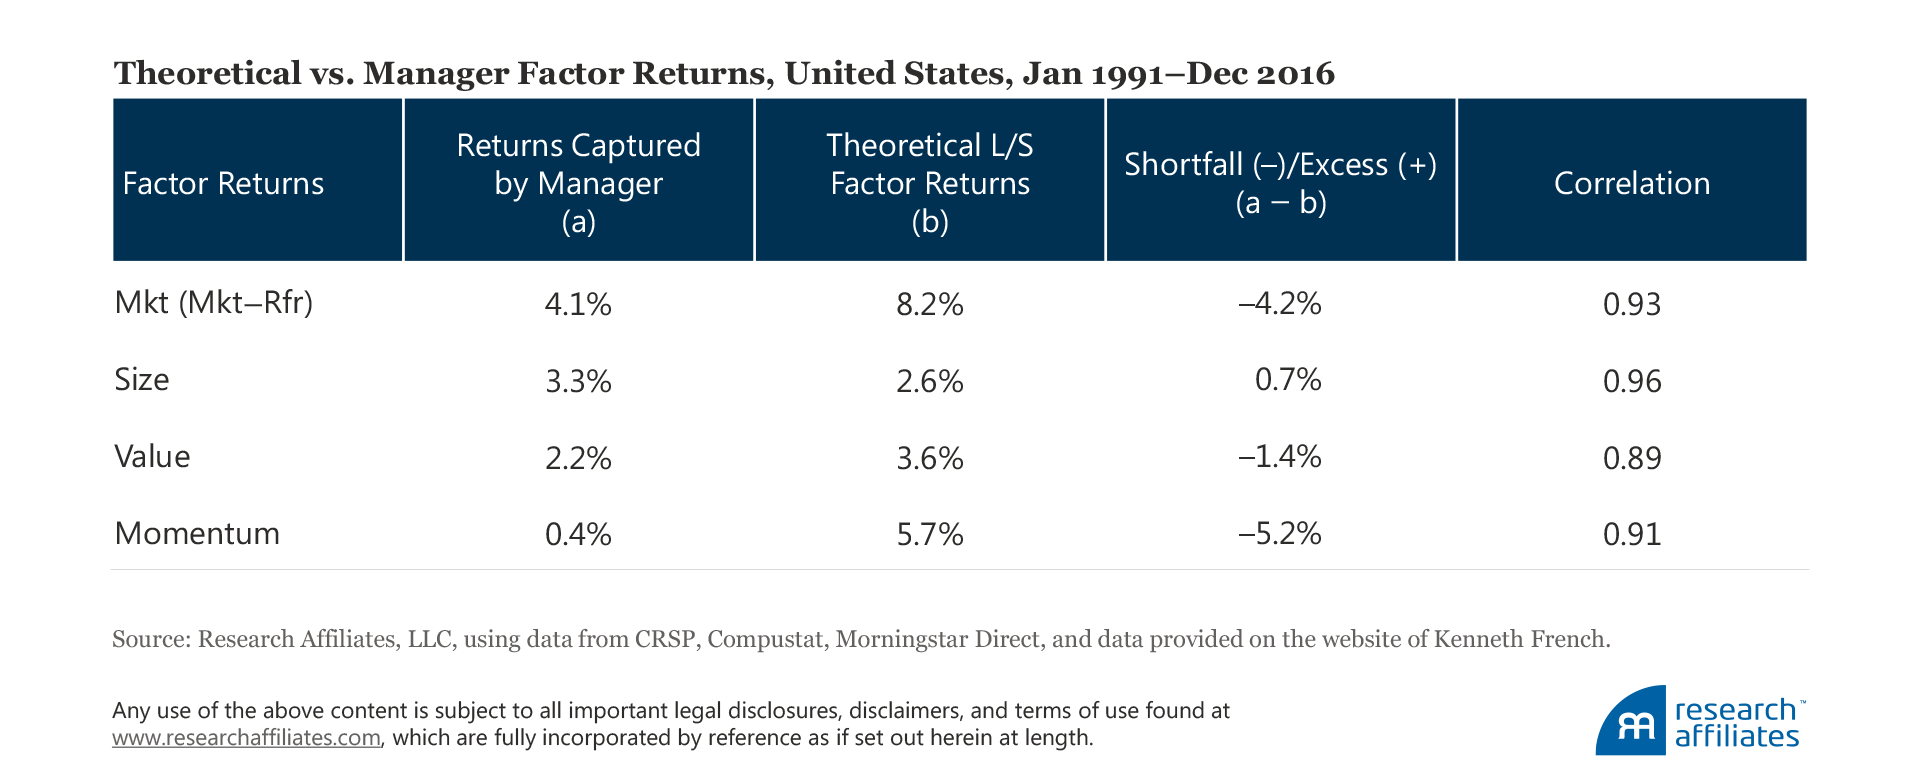
Market Factor. Over the last 26 years, the factor return (net of transaction costs and other fees) earned by mutual fund managers by loading on market beta has fallen short of the observed equity market excess return by 4.2 percentage points a year. The shortfall has a t-statistic of −3.54. In the first decade of our sample period, the reverse-engineered returns match the theoretical equity excess return reasonably well, but the gap widens in the aftermath of the dot-com bubble, accelerating in recent years. For the market factor we have a reasonable explanation for the gap; for other factors the shortfall is harder to justify.
The market factor we use in our analysis reflects the return difference between stocks and cash. Over long periods of time, high beta stocks have beat low beta stocks by far less than the capital asset pricing model (CAPM) would have predicted, which is nothing more than the well-documented flat (or inverted in some studies) security market line where differences in stock return performance are not explained by variation in market beta.7 So the gap we observe is not a surprise. Some might find it surprising that the relationship is positive at all. One possible explanation for a positive realized market premium is the cash held by fund managers (and also, potentially, their use of leverage and derivatives), which introduces the conventional market-minus-cash beta sensitivity.
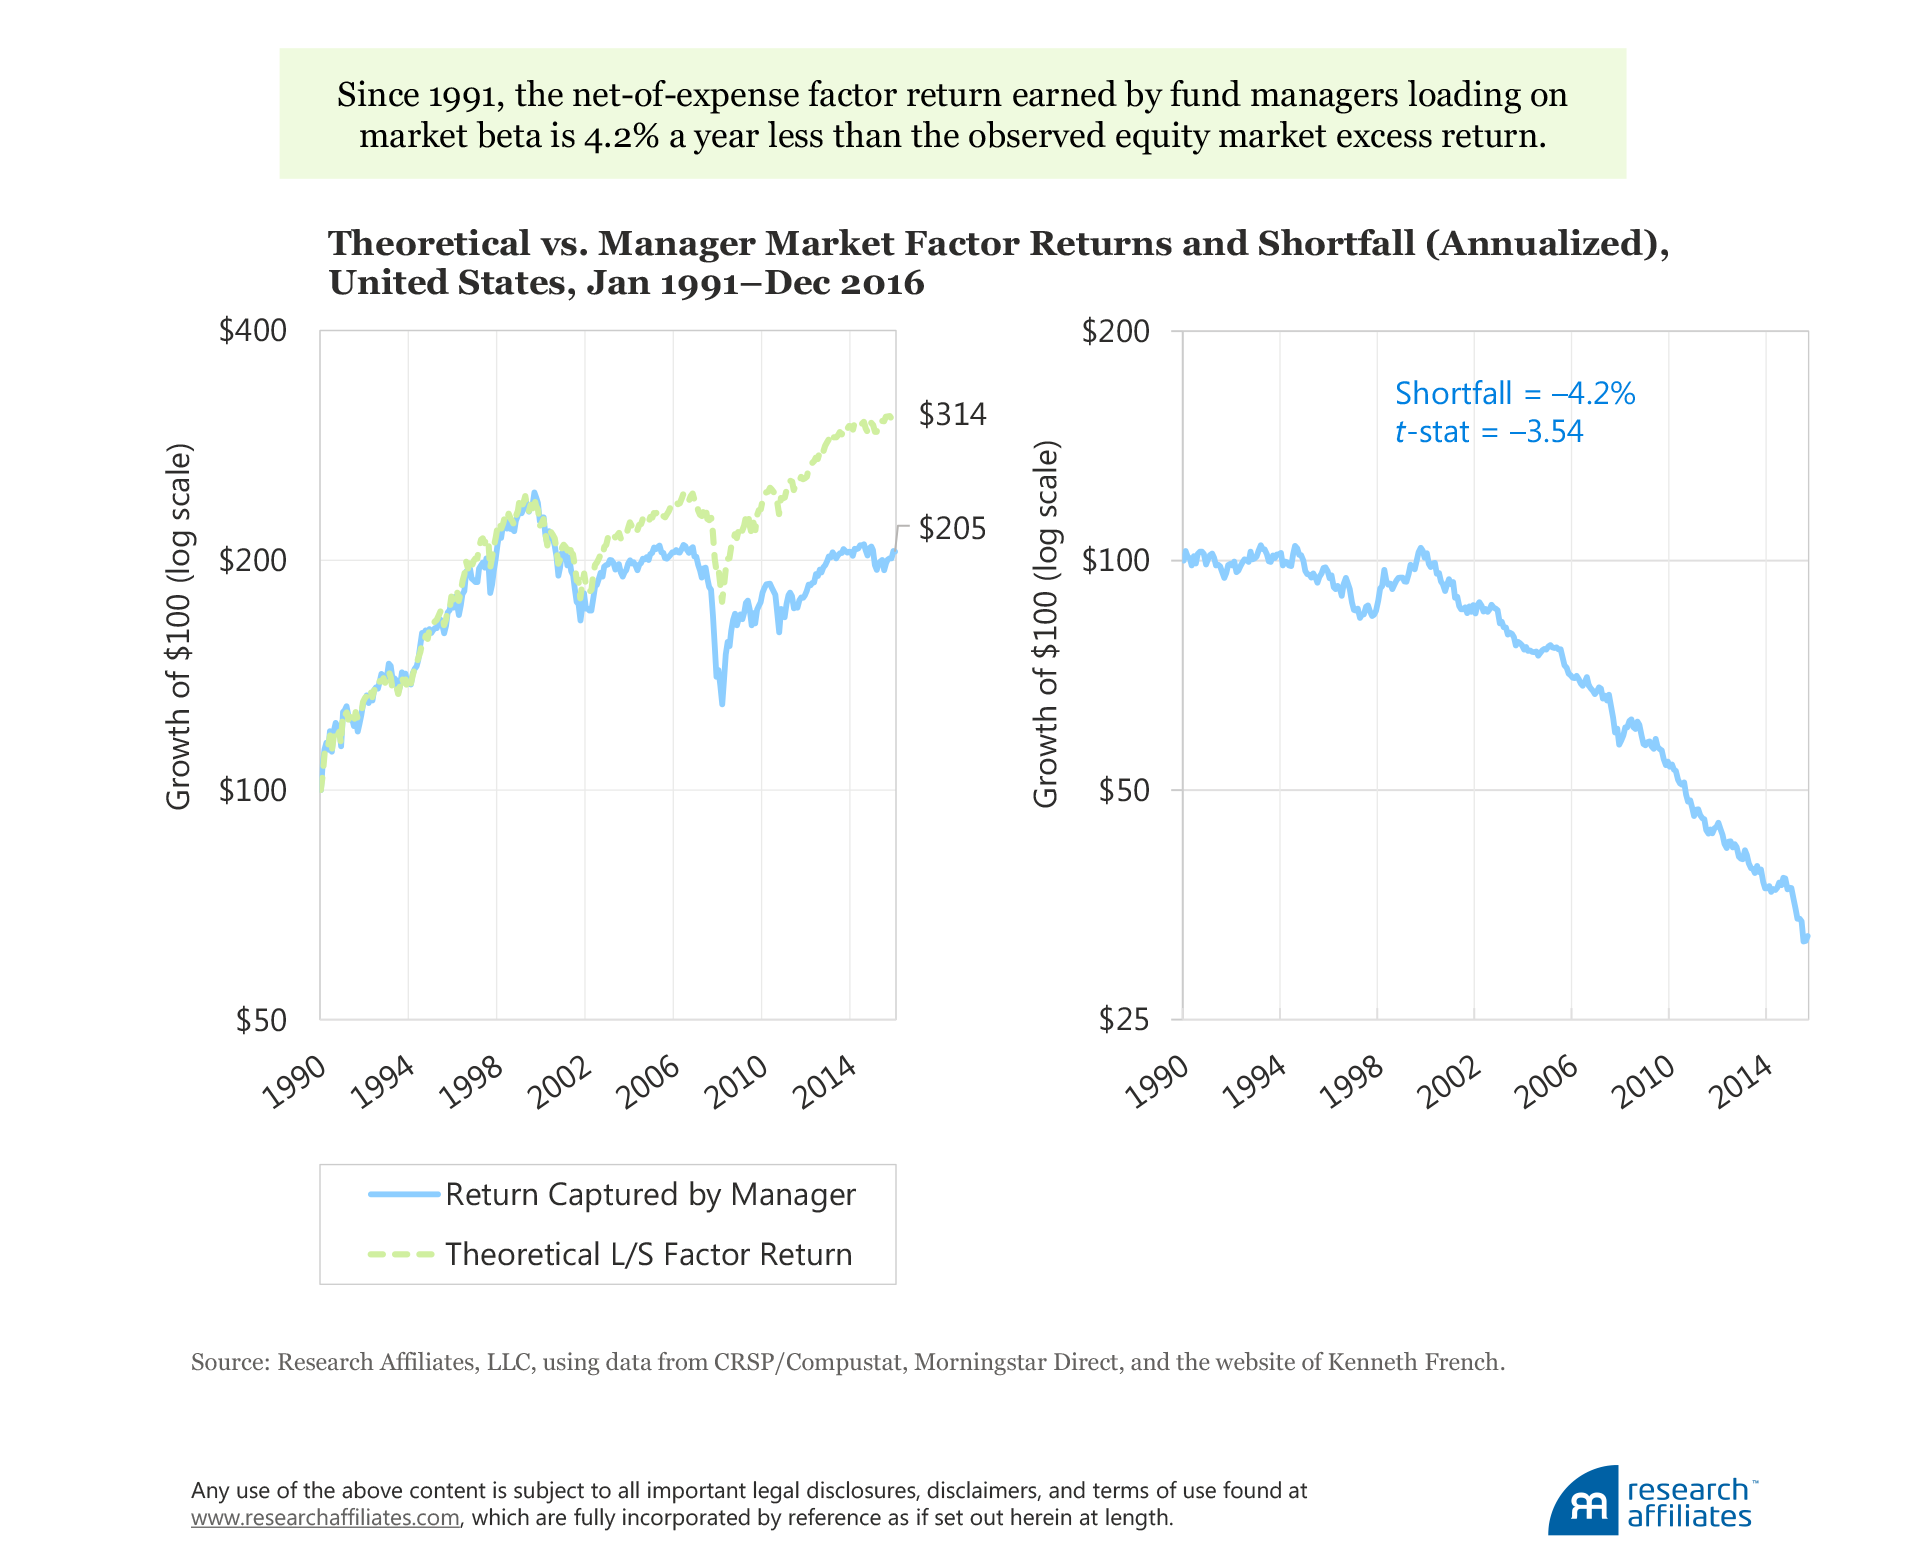
Size Factor. The theoretical and manager returns for the size factor demonstrate a near-perfect fit, with a correlation of 0.96, over our study period. The good fit is not a surprise. The turnover of the size factor (i.e., stocks migrating between the large-cap and small-cap categories) is one of the lowest among all conventional factors, making the funds’ replication of the factor quite easy. The magnified effect—the realized size factor in mutual funds being stronger than the theoretical long–short size factor return—is, however, a bit of a surprise.
Our findings suggest the cumulative return derived from mutual fund performance exceeds the theoretical long–short size factor returns by a small margin of 0.7 percentage point a year (not statistically significant, with a t-statistic of 1.13). The surplus return may come from the ability to control transaction costs because turnover is low in small-cap portfolios. Further, we cannot rule out that some active small-cap managers may have better stock selection skills than their large-cap brethren.
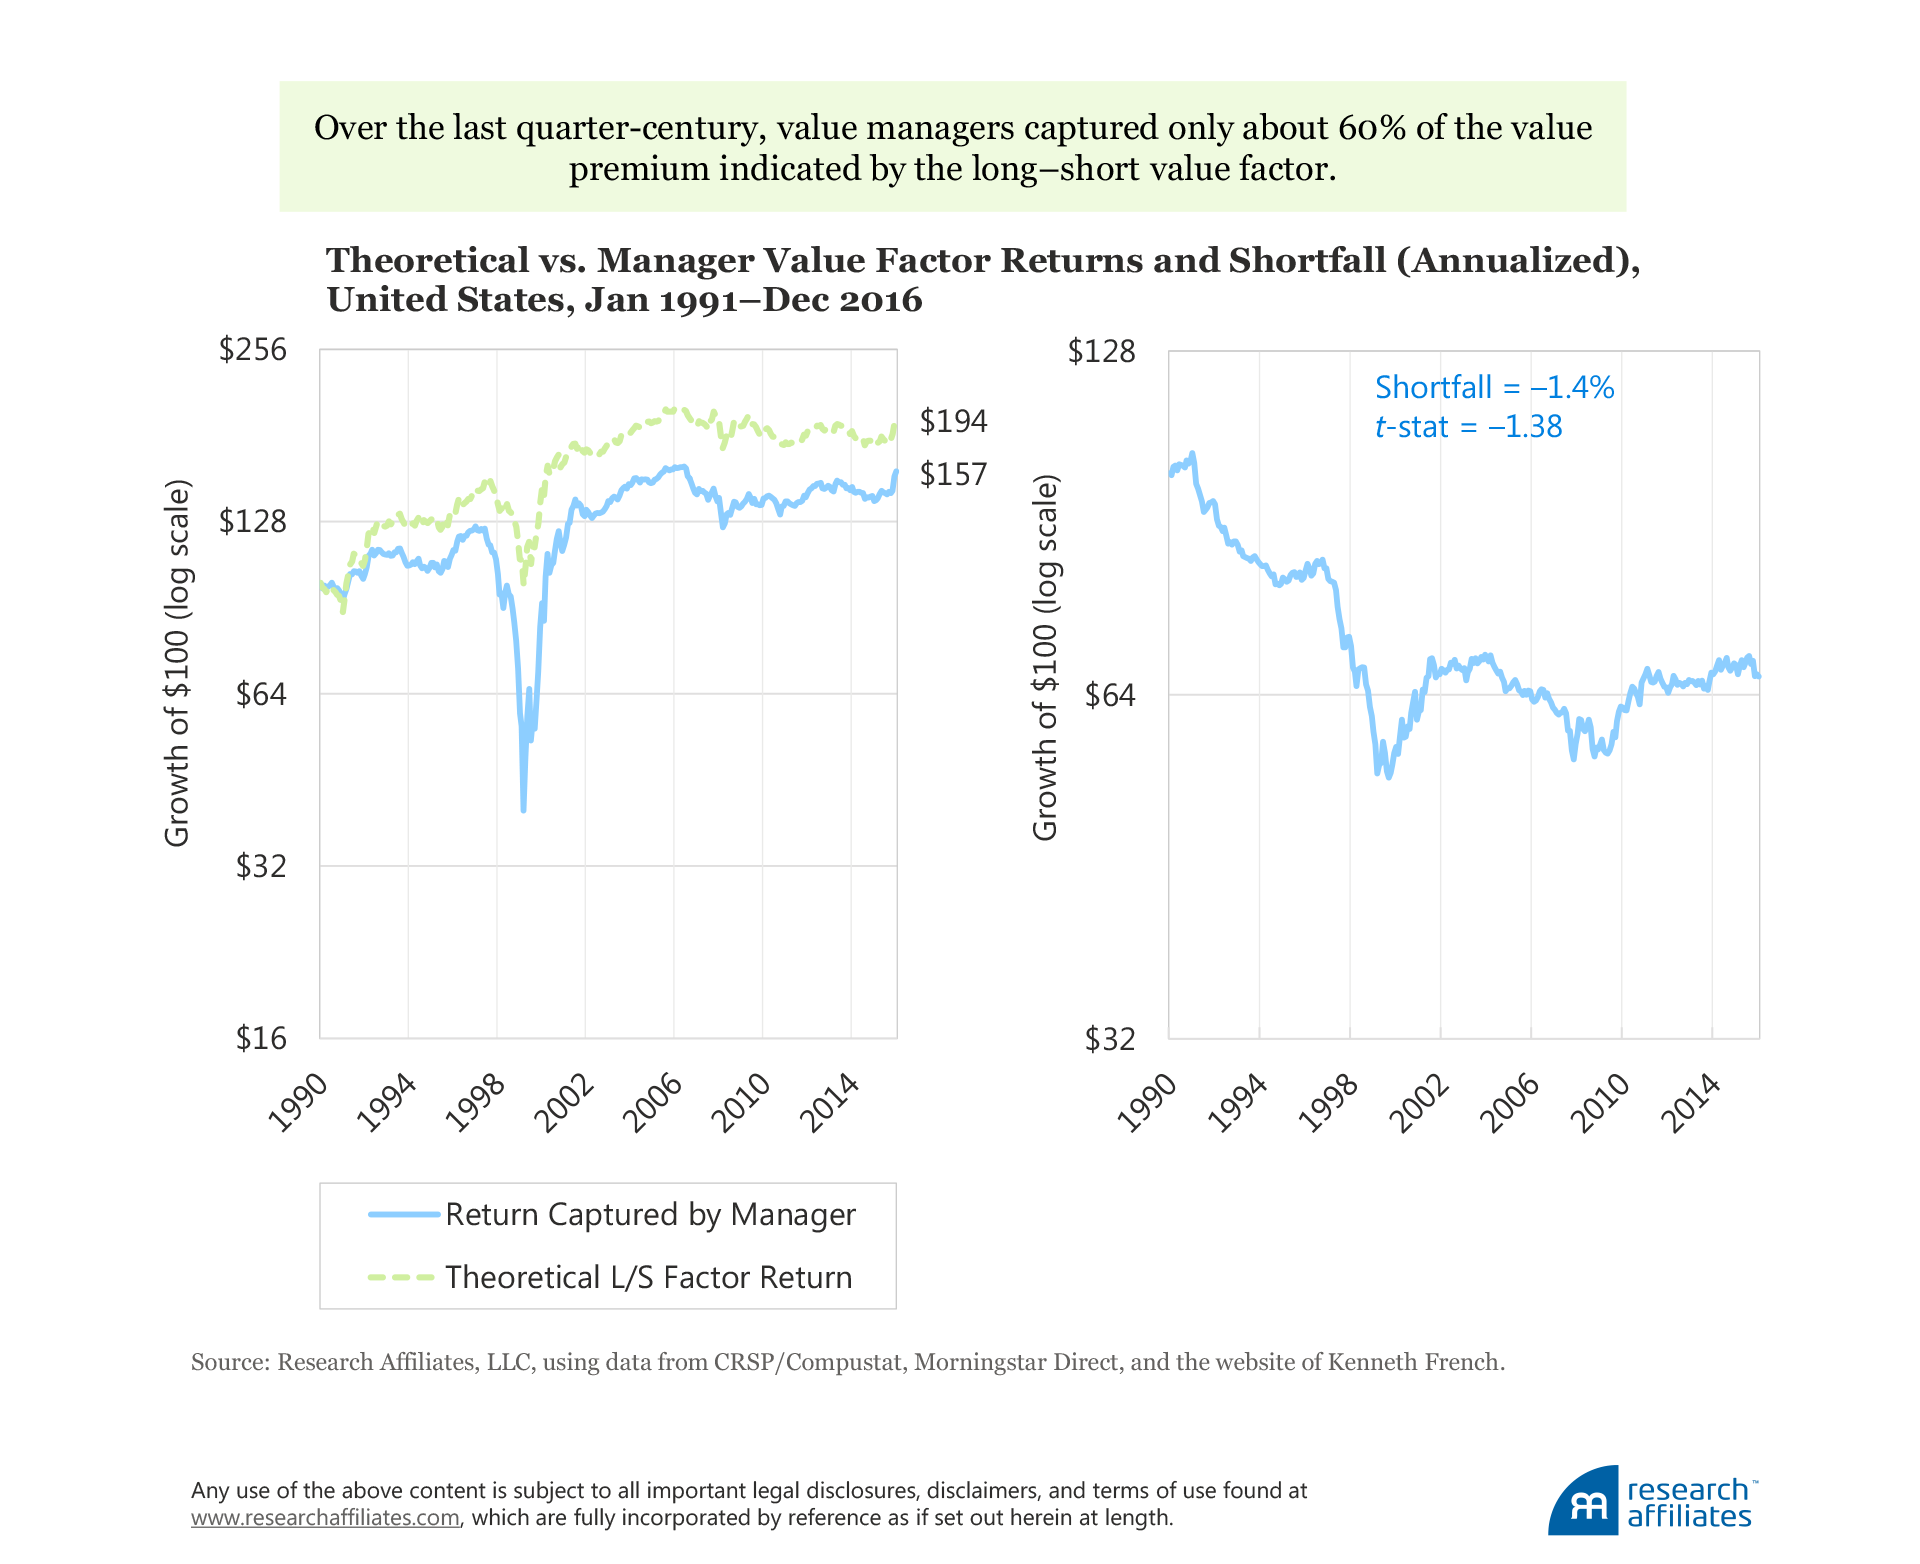
Value Factor. The value factor premium is perhaps the most widely studied factor across world markets because value strategies are among the most widely embraced investment solutions in finance.8 Our research indicates, however, that most value strategies, when executed in the real world, leave some of the value effect on the table. This gap between theoretical and realized returns is rather persistent over our study period, with the exception of the first year. Over the last quarter-century, value managers captured only about 60% of the value premium indicated by the long–short value factor. Whereas a theoretical paper portfolio generates an annualized return of 3.6% a year, mutual fund managers were able to capture only 2.2% a year, an annualized slippage of 1.4 percentage points, with a t-statistic of −1.38. While not statistically significant, the shortfall is economically meaningful.
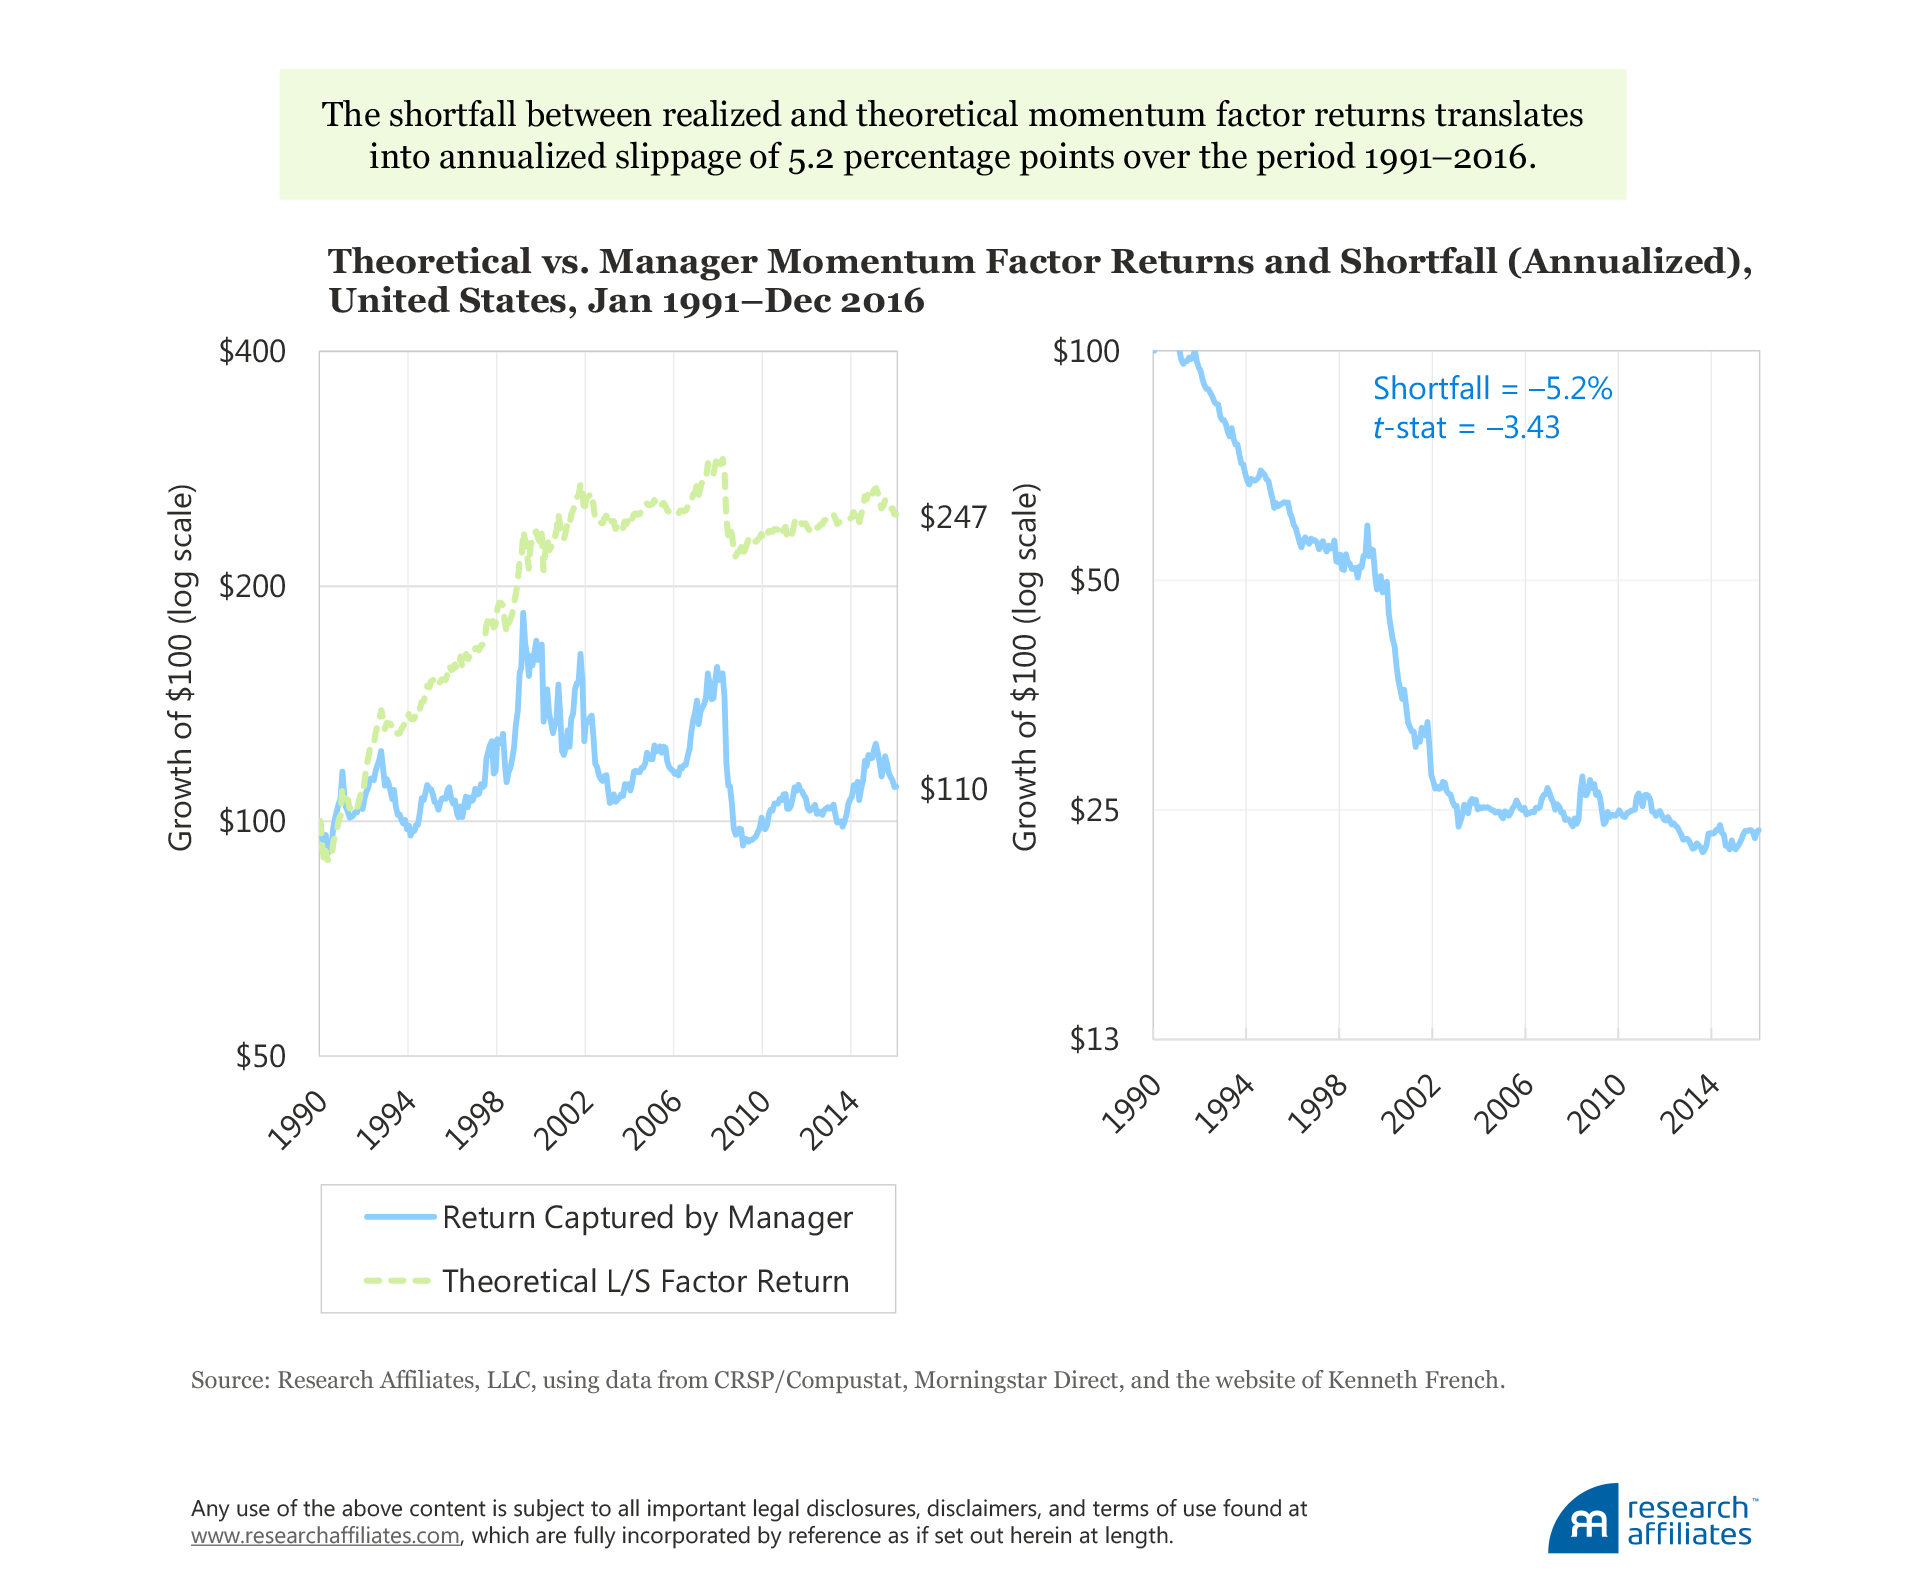
Momentum Factor. The average annual return of the momentum factor based on long–short paper portfolios is 5.7% compared to the annualized factor return captured by momentum investors, which is close to zero, at 0.4% a year per unit of momentum loading. This shortfall translates into an annualized slippage of 5.2 percentage points over the last quarter-century,9 with a t-statistic of −3.43! Most of the shortfall between the actual returns earned by fund managers and the theoretical paper portfolio happens by 2003, while essentially all of the alpha generated by the momentum factor paper portfolio occurs prior to 2002.
The Sources of Slippage
For the long–short factor paper portfolios, our results show no slippage for the size factor, moderate slippage for the value factor, high slippage for the market factor, and very high slippage for the momentum factor. The sources of the observed slippage are the real-world costs of implementing in practice the theory we use to define a factor return: the costs associated with trading, shorting, relying heavily on positions in small and illiquid stocks, management fees, and so forth.
How big are the transaction costs associated with the implementation of the different factors? Several studies (e.g., Novy-Marx and Velikov [2015] and Hsu et al. [2016]), show that low-turnover strategies, such as value and size, will incur small to moderate trading costs. The higher turnover strategies, such as momentum (and to a lesser extent low volatility or betting-against-beta), display trading costs that may be large enough to wipe out the alpha, if enough money is following the strategy. This order of magnitude in trading costs related to implementation of the different factors closely matches the respective amount of slippage we observe in our study. Although we cannot prove it, we suspect transaction costs likely play a major, even dominant, role in explaining the slippage in realized versus expected factor returns.
Another possible source of slippage could be manager skill in choosing the negative factor exposure. For example, if growth fund managers have strong stock selection or timing skill, this skill will reduce the performance gap between growth and value managers and will appear as an erosion in the realized value premium when compared to the theoretical value premium. We will explore in more detail the possible drivers of factor return slippage later in our series of articles. Meanwhile, caveat emptor!
Are Investors Believing in Impossible Things?
Factor investing is gaining popularity in the investment community as practice catches up with academic research, inevitably enriching investors’ toolkits. But when investors use academic tools without a proper understanding of how real-world implementation costs—ignored in theoretical paper portfolios—can impact performance, a shortfall (sometimes large) between theoretical factor returns and realized factor returns can occur.
We find that mutual fund managers over the period of our study, 1990–2016, experience substantial shortfalls in their ability to capture factor returns compared to the returns “earned” by theoretical paper portfolios. Our research shows the shortfall is quite large for the market and value factors, whose returns to the end-investor are halved or worse. For the momentum factor, the end-investor seems to have enjoyed no benefit whatsoever from fund momentum loadings, nor any penalty for funds that have an anti-momentum bias. We strongly suspect the majority of the return shortfall is due to trading costs, a topic we will explore in more detail in future work.
Please read our disclosures concurrent with this publication: https://www.researchaffiliates.com/legal/disclosures#investment-adviser-disclosure-and-disclaimers.
Endnotes
1. Arnott et al. (2016) and Arnott, Beck, and Kalesnik (2016a, 2016b).
2. The Morningstar Direct Mutual Fund Database includes liquidated or merged funds. We focus on institutional, no-load, and A-share classes because they are the most relevant to retail and institutional investors. These three classes differ in fee structures and represent investment returns to different types of investors. Inclusion of all three share classes enriches the sample. Also, the inclusion of multiple share classes should not bias the slope of the second-stage regression coefficients (the methodology is described in the Appendix) nor therefore our conclusions based on our findings.
3. John Cochrane coined this marvelous expression “factor zoo.” Harvey et al. (2015) shows that over 316 factors were published by the end of 2012, with over 90% published since 2000. In conversations with Cam, he suggests that all 316 factors exhibited positive alpha; almost all showed statistical significance, net of the size and value factors; and none—zero—were tested to determine if the factor had enjoyed a tailwind of rising relative valuations, which may have driven part or all of its historical efficacy.
4. Of course, if the factors did not have positive performance, they would not have become popular!
5. Shumway and Warther (1999) show that delisted stocks’ returns recorded in the regular databases are much larger than what an investor would be able to earn when transacting in the over-the-counter market, where the stocks are traded after being delisted.
6. A long-lasting debate in the academic literature is whether the better driver of expected returns is risk exposure or stock characteristics. Fama and French (1993) argue that returns are driven by risk exposures, whereas Lakonishok, Shleifer, and Vishny (1994) argue that mispricing and characteristics may be the stronger driver. Daniel and Titman (1997) conduct a test to compare the two hypotheses and conclude that stock characteristics may be the better driver. More recent research Berk (2000) and Davis, Fama, and French (2000) find support that risk exposures are more important, while Daniel, Titman, and Wei (2001) and Chaves et al. (2013) find evidence in support of stock characteristics.
7. In the early 1970s, researchers such as Haugen and Heins (1975) and Black, Jensen, and Scholes (1972) found empirical evidence that variation in market beta risk is not matched with compensation for risk; this is known as a flat or sometimes inverted security market line.
8. The value effect was first documented by Basu (1977). The two most accepted explanations for the value effect are risk based, as proposed by Fama and French (1992), and behavioral, as proposed by Lakonishok, Shleifer, and Vishny (1994).
9. The apparent 0.1 percentage-point difference is due to rounding.
References
Arnott, Robert, Noah Beck, and Vitali Kalesnik. 2016a. “To Win with ‘Smart Beta’ Ask If the Price Is Right.” Research Affiliates (June).
———. 2016b. “Timing ‘Smart Beta’ Strategies? Of Course! Buy Low, Sell High!” Research Affiliates (September).
Arnott, Robert, Noah Beck, Vitali Kalesnik, and John West. 2016. “How Can ‘Smart Beta’ Go Horribly Wrong?” Research Affiliates (February).
Basu, Sanjoy. 1977. “Investment Performance of Common Stocks in Relation to Their Price-Earnings Ratios: A Test of the Efficient Market Hypothesis.” Journal of Finance, vol. 32, no. 3 (June):663–682.
Berk, Jonathan B. 2000. “Sorting Out Sorts.” Journal of Finance, vol. 55, no. 1 (February):407–427.
Black, Fischer, Michael C. Jensen, and Myron Scholes. “The Capital Asset Pricing Model: Some Empirical Tests.” In Studies in the Theory of Capital Markets, edited by M. C. Jensen. New York: Praeger, 1972.
Chaves, Denis, Jason Hsu, Vitali Kalesnik, and Yoseop Shim. 2013. “What Drives the Value Premium? Risk versus Mispricing: Evidence from International Markets.” Journal of Investment Management, vol. 11, no. 4 (Fourth Quarter):1–18.
Daniel, Kent, and Sheridan Titman. 1997. “Evidence on the Characteristics of Cross-Sectional Variation in Stock Returns.” Journal of Finance, vol. 52, no. 1 (March):1–33.
Daniel, Kent, Sheridan Titman, and John Wei. 2001. “Explaining the Cross-Section of Stock Returns in Japan: Factors or Characteristics?” Journal of Finance, vol. 56, no. 2 (April):743–766.
Davis, James, Eugene Fama, and Kenneth French. 2000. “Characteristics, Covariances, and Average Returns: 1929 to 1997.” Journal of Finance, vol. 55, no. 1 (February):389–406.
Fama, Eugene, and Kenneth French. 1992. “The Cross-Section of Expected Stock Returns.” Journal of Finance, vol. 47, no. 2 (June):427–465.
———. 1993. “Common Risk Factors in the Returns on Stocks and Bonds.” Journal of Financial Economics, vol. 33, no. 1 (February):3–56.
Fama, Eugene, and James MacBeth. 1973. “Risk, Return, and Equilibrium: Empirical Tests.” Journal of Political Economy, vol. 81, no. 3 (May/June):607–636.
Harvey, Campbell, Yan Liu, and Heqing Zhu. 2015. “...and the Cross-Section of Expected Returns.” Review of Financial Studies, vol. 29, no. 1 (January):5–68.
Haugen, Robert A., and A. James Heins. 1975. “Risk and the Rate of Return on Financial Assets: Some Old Wine in New Bottles.” Journal of Financial and Quantitative Analysis, vol. 10, no. 5 (December):775–784.
Hsu, Jason, Vitali Kalesnik, Noah Beck, and Helge Kostka. 2016. “Will Your Factor Deliver? An Examination of Factor Robustness and Implementation Costs.” Financial Analysts Journal, vol. 72, no. 5 (September/October):58–82.
Lakonishok, Josef, Andrei Shleifer, and Robert Vishny. 1994. “Contrarian Investment, Extrapolation, and Risk.” Journal of Finance, vol. 49, no. 5 (December):1541–1578.
Novy-Marx, Robert, and Mihail Velikov. 2015. “A Taxonomy of Anomalies and Their Trading Costs.” Federal Reserve Bank of Richmond working paper (August).
Shumway, Tyler, and Vincent Warther. 1999. “The Delisting Bias in CRSP’s Nasdaq Data and Its Implications for the Size Effect.” Journal of Finance, vol. 54, no. 6 (December):2361–2379.

