
We apply five levels of customization to four developed-market equity strategies to quantify the impact of customization (or direct indexing).
As intuition suggests, customizations limit access to certain investment opportunities, and higher active share as a result of customization leads to higher tracking error versus the baseline strategy.
Educating investors about the impacts of customization should improve investment outcomes by reducing surprises and encouraging investors to stay the course.
Portfolio customization requires trade-offs. Adjustments to the weights of index constituents via a separately managed “direct index” will inherently change a portfolio, but how much does customization impact a portfolio’s performance and characteristics? Intuition tells us that broadly diversified portfolios will exhibit minimal impact from modest customization and that narrowly diversified portfolios will experience a material impact from significant customization. But what is the specific impact of popular ESG (environmental, social, and governance)-related customizations in some popular equity portfolio strategies?
In order to quantify the impact of customization (or direct indexing), we apply five levels of customization to four developed-market equity strategies. The sample portfolios we examine range from a broad capitalization-weighted portfolio to a relatively concentrated deep-value portfolio. Similarly, our customizations range from a light-touch exclusion of weapons, tobacco, and gambling companies to a restrictive 50% reduction in carbon intensity. The goal of our analysis is to help investors manage their expectations around customized portfolios by quantifying the impact on portfolio characteristics and portfolio performance.
Our Customizations
Individual investors have used separately managed accounts for decades as a way to lower their tax burden relative to a commingled vehicle, such as a mutual fund. Increasingly, investors are using separately managed accounts to align their portfolios with their personal beliefs. Investors can reduce exposure in their portfolios to companies they view unfavorably either according to individual company attributes or via a combination ESG measures.
Although the possibilities are as numerous as investors’ preferences, we categorize customizations into two broad forms: 1) outright exclusion of undesirable firms and 2) position-size adjustments in favor of firms that exhibit desirable characteristics. Both forms of customization inherently introduce deviations from the original reference portfolios. We believe investors should understand the implications of customization to their portfolios.
We apply five levels of portfolio customization to provide examples to help investors set reasonable expectations of the magnitude of impact generated by their customization choices. The customizations we use are similar to the most common customization requests we receive.
The customizations we apply cover both the exclusion and position-size-adjustment categories:
- Exclude weapons, tobacco, and gaming companies
- Exclude fossil fuel companies1
- Match the carbon intensity2 of the investable universe
- Reduction in carbon intensity of 30% relative to the investable universe
- Reduction in carbon intensity of 50% relative to the investable universe
The first customization—exclusion of companies deriving material revenue from activities related to weapons, tobacco, and gaming—captures a traditional screen applied by some large public plan investors in the United States. These industries are popular exclusions due to the nature of their businesses and their relatively small share of equity markets. The second customization, which includes thermal coal and oil sands companies, targets some of the largest sources of carbon emissions. These firms represent a larger portion of the market, but excluding them can greatly reduce the average carbon intensity (CI) of a portfolio. The remaining three customizations employ carbon/climate-related position-size adjustments, but without an explicit exclusion of fossil fuels. These last three customizations are currently receiving the most institutional interest globally. To achieve the target level of average carbon intensity, we progressively reallocate from companies with high CI to their lower counterparts at rates proportional to the companies’ CI.
Starting Portfolios
We test our customization rules on four developed-market equity strategies, selected to include varying levels of market coverage. We analyze gradients of value—from a simulated core cap-weighted market index to a deep-value portfolio—because climate-focused ESG approaches tend to reduce a portfolio’s value exposure.3 We provide four examples of binding constraints on the portfolios:
- A broadly diversified market-capitalization-weighted portfolio composed of the top 86% of companies by cumulative market capitalization (Cap);
- A broadly diversified fundamentally weighted portfolio composed of the top 86% of companies by cumulative fundamentals (RAFI);
- A more-concentrated fundamentally weighted portfolio composed of the 30% cheapest companies, as defined by fundamentals-to-market capitalization ratio, by cumulative fundamentals (Value); and
- A deep-value fundamentally weighted portfolio composed of the 10% cheapest companies, as defined by fundamentals-to-market capitalization ratio, by cumulative fundamentals (Deep Value).
The fundamental measures we use to create portfolios 2 (RAFI), 3 (Value), and 4 (Deep Value) are the same metrics we use to create our RAFI™ Fundamental Index™ strategies. We select and weight companies in these portfolios via an equally weighted average of a company’s sales, cash flow, dividends, and book value. The resulting portfolios exhibit a value tilt relative to a cap-weighted index that varies in magnitude over time. When the market’s willingness to pay a premium for growth companies is high, the relative value exposure of a fundamentally selected and weighted portfolio will be high, and vice versa.
We source the financial data from Worldscope and Datastream and the industry identification and carbon emissions data from Institutional Shareholder Services (ISS). We limit our tests to observations from January 2016 through December 2021, the period for which we are able to access the most-robust carbon data.
Customizations Restrict Investment Opportunities
Customizations naturally restrict access to certain investment opportunities, requiring adjustments ranging from negligible to significant alterations of the original, or starting, portfolio. We demonstrate the potential impact of customizations by identifying the portion of each of the starting portfolios associated with attributes that make them undesirable to certain investors.
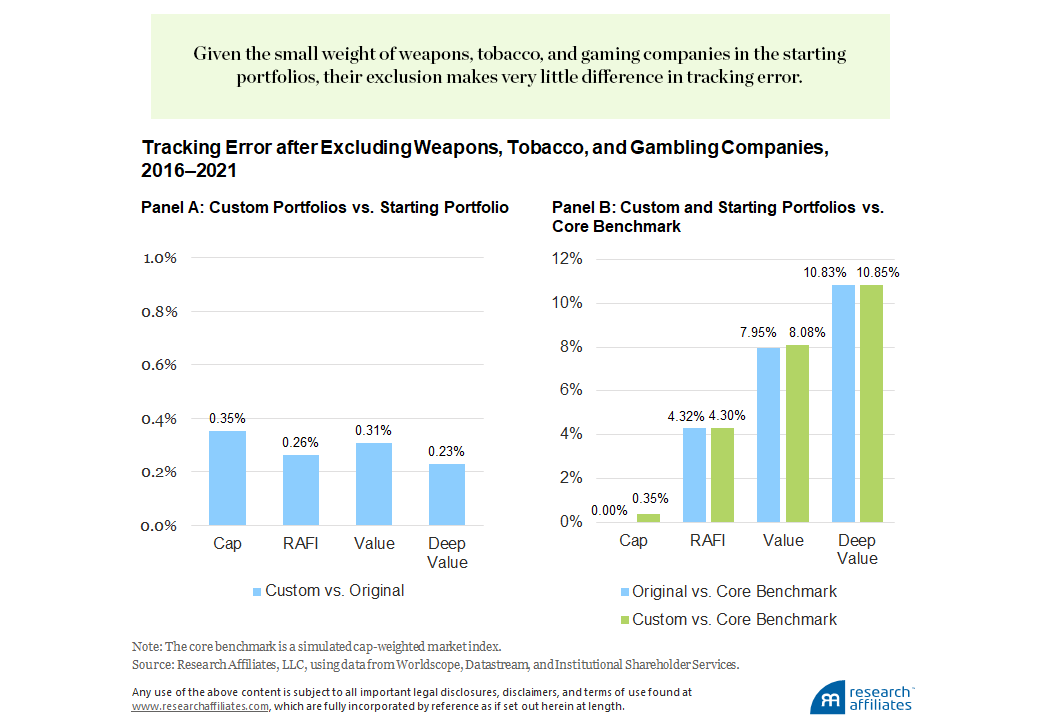
The first exclusion we consider—weapons, tobacco, and gambling companies—amounts to less than 5% of the opportunity set in our investable universe. Unsurprisingly, this modest exclusion causes only a small change to investment outcomes.
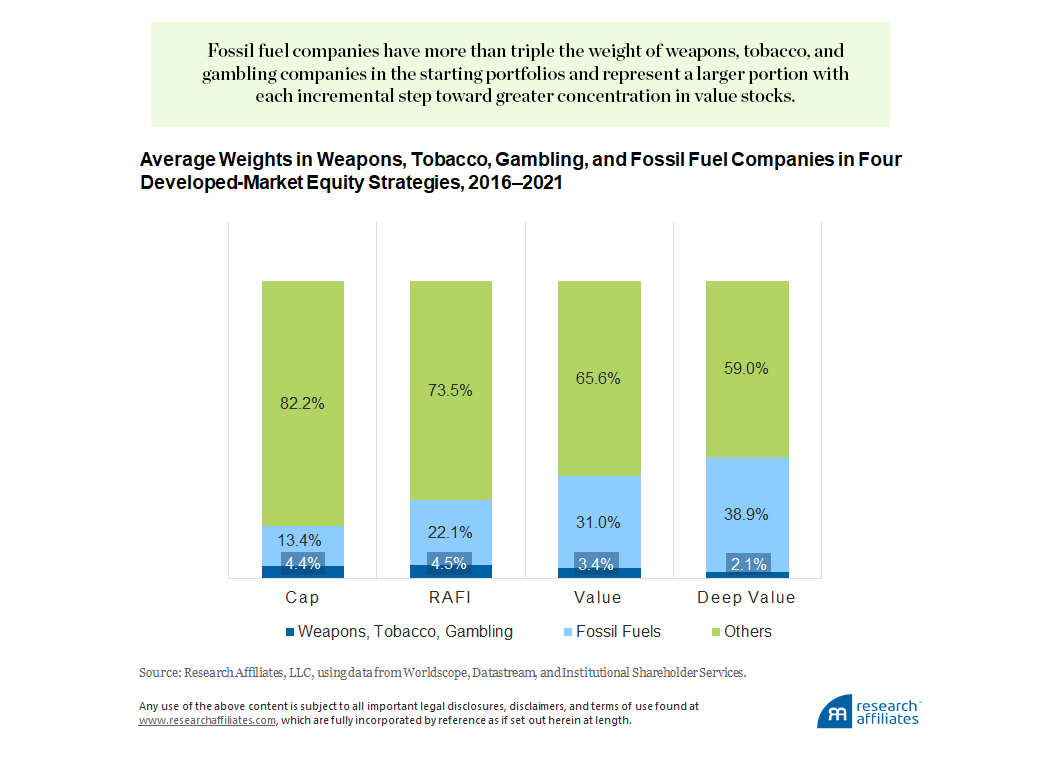
In contrast, the second exclusion we consider—fossil fuel companies—has more than triple the weight of weapons, tobacco, and gambling companies in each of the starting portfolios. Because weapons, tobacco, and gambling firms did not exhibit deeply discounted valuations in aggregate over this period, and energy companies did, fossil fuel companies represent a larger portion of the starting portfolio with each incremental step toward greater concentration into value stocks, peaking at a 38.9% share of our starting deep-value portfolio.
The Cap and RAFI portfolios exhibit similar levels of market coverage, overlapping each other by 90%. Market coverage drops considerably for the value and deep-value portfolios, which represent only 30% and 10%, respectively, of the RAFI portfolio’s market coverage. As a result, the same customization requirement of excluding fossil fuel companies leads to eliminating much larger shares of these concentrated portfolios.
This impact on coverage over the period evaluated is in line with our expectations. Energy companies have been out of favor due to climate-related concerns and the market’s expectation of stranded assets. RAFI and the more concentrated Value and Deep Value portfolios will naturally hold above market exposure to cheap stocks such as those of energy firms over this period when the market cap of many of these firms plummeted.
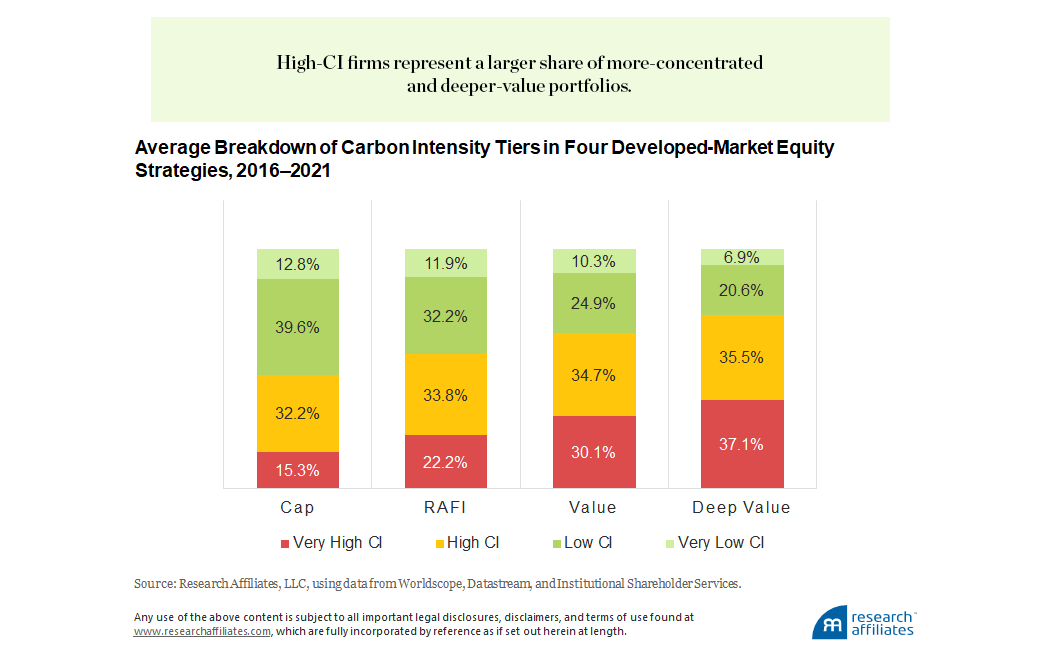
We also compare the average weights of companies in various carbon-intensity tiers in each of the starting portfolios. Companies with high (and low) CI have log CI above (and below) the market average; companies with very high (and very low) CI have log CI one standard deviation above (and below) the market average. Similar to fossil fuel companies, the more concentrated and deeper value the portfolio, the larger the share of high-CI firms. High-CI and very-high-CI firms represent 47.5% of the Cap portfolio compared to 72.6% of the Deep Value portfolio.
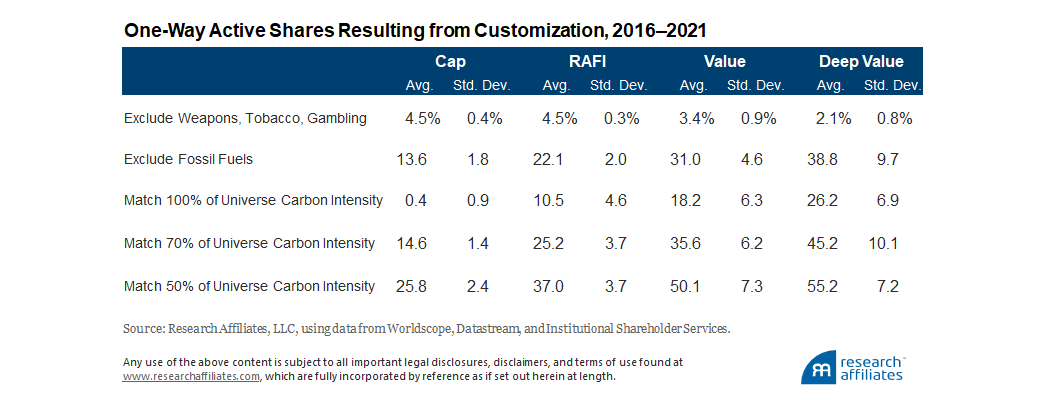
We also examine the active share (one-way turnover required to trade from the original to the custom strategy) for each level of customization. As expected, excluding weapons, tobacco, and gambling requires little change to the portfolios. Excluding fossil fuels or reducing carbon intensity, which may conflict with the value factor’s characteristics, leads to a markedly higher active share, particularly, in the Value and Deep Value strategies. Each requires an active share of 50% or more in order to achieve a 50% reduction in CI relative to the investable universe.
Focus on Tracking Error
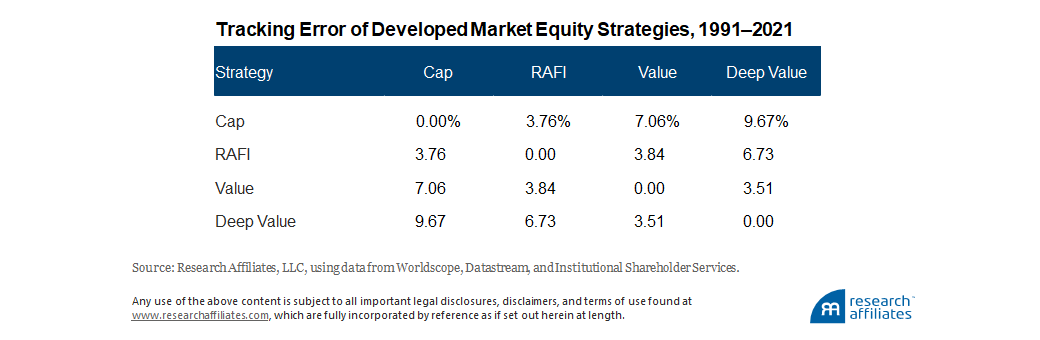
The active share generated by customization inevitably changes expected portfolio performance. We capture these changes via the tracking error between each custom variant and its starting portfolio. Before evaluating the impact of customization, we compare the starting portfolios to each other. Each of the non-cap-weighted strategies is meaningfully different from a cap-weighted index. The broad RAFI portfolio exhibits average annualized tracking error of 3.76%. Concentrating holdings in the 30% (Value) and 10% (Deep Value) cheapest companies increases tracking error further to 7.06% and 9.67%, respectively.
Tracking error between the two most prominent US large market-capitalization-weighted indices, the S&P 500 Index and Russell 1000 Index, provides a reference point for the tracking error we observe in our analysis. These two indices exhibit roughly 1% tracking error to each other, on average, since inception of the Russell 1000 on January 1, 1987. The two indices are clearly not identical. The names of the indices disclose the largest persistent difference between the two: the difference in number of companies in the index, roughly 500 and 1,000, respectively. Notable differences have emerged between the two indices, such as when the S&P Committee waited to add Tesla to its large-cap index until the end of 2020. The returns of the two portfolios are generally so similar, however, that most investors will not notice a meaningful difference between them.
We show that tracking error is highly correlated with the active share induced by customization.
”We suggest using tracking-error breakpoints as a framework to analyze the impact of customization. Portfolios with 1% tracking error to each other are largely indistinguishable. Strategies begin to deviate materially from their reference portfolios around 2% tracking error. Double that figure to 4% and the pair of portfolios begin to serve as reasonable diversifiers for each other. If tracking error doubles again to 8%, the two portfolios can serve meaningfully different roles in meeting an investor’s objectives. Another point of reference is that the tracking error between the Russell 1000 Growth and Russell 1000 Value indices has been around 9% historically. Investors often use these style indices as benchmarks for separate allocations in their portfolios.
The relatively modest customization to the cap-weighted portfolio to exclude weapons, tobacco, and gaming creates a similarly modest impact, generating tracking error of 0.35% for the Cap portfolio. The same exclusion creates comparably mild tracking-error impacts ranging from 0.23% to 0.31% for the other three portfolios compared to their respective starting portfolios. Given the small weight of weapons, tobacco, and gaming companies in the starting portfolios, their exclusion generates minimal tracking error to the core cap-weighted benchmark. The Value portfolio’s tracking error to the core cap-weighted benchmark grows very slightly from 7.95% to 8.08%, while RAFI’s and Deep Value’s tracking error to the core cap-weighted portfolio remains effectively unchanged at 4.30% and 10.85%, respectively.4 Excluding weapons, tobacco, and gaming causes only a modest impact across all four starting portfolios. The customized portfolios track their respective starting portfolios more closely than the S&P 500 and the Russell 1000 track each other.
The exclusion of fossil fuels removes more companies from the opportunity set than the previous exclusion of removing weapons, tobacco, and gaming companies and generates higher tracking error as a result. Removing fossil fuel companies creates 1.02% tracking error for the Cap portfolio compared to its original, unconstrained version. The portfolios with greater value exposure, however, experience a much more meaningful impact as a result of the fossil fuel exclusion: the constrained versions of the RAFI, Value, and Deep Value portfolios have tracking errors of 1.92%, 3.11%, and 5.00%, respectively, versus their starting portfolios. Whereas the removal of fossil fuels generated increasingly larger deviations between the original and constrained portfolios with the more concentrated and deeper the value tilt of the starting point, the exclusion reduced tracking error to the cap-weighted index for all three.
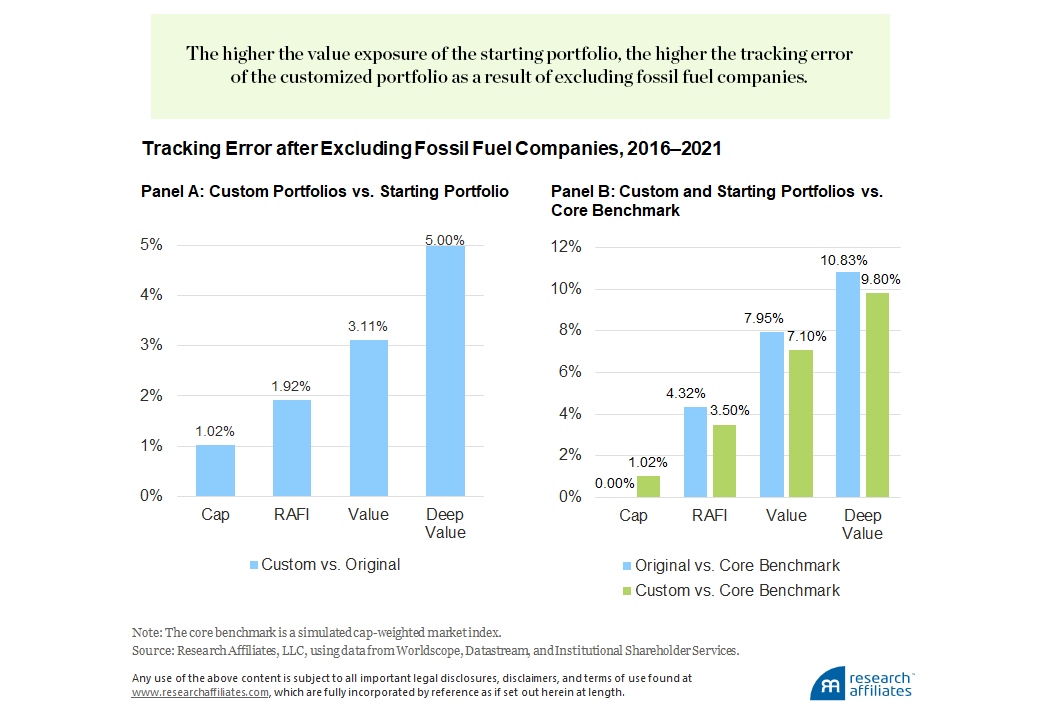
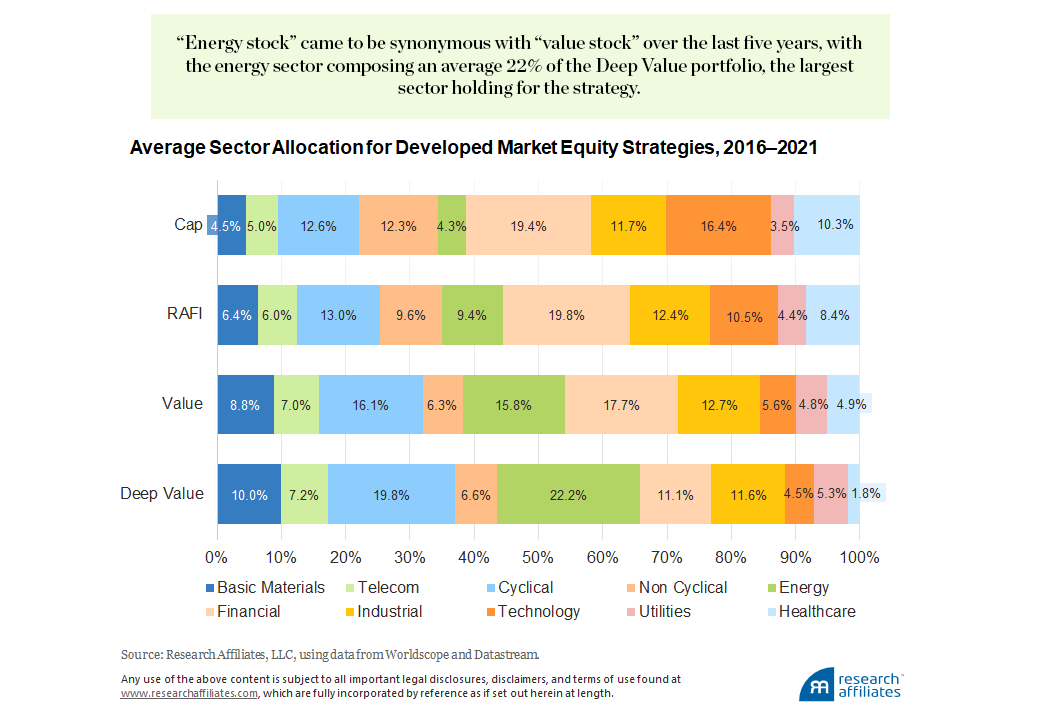
Energy stocks became nearly universally viewed as value stocks over the period of our analysis (2016 through 2021). As energy companies underperformed in the 2010s and then experienced accelerated declines during the Covid-induced lockdowns in the early 2020s, the sector’s share of the Cap portfolio shrank below 5%, while over the same period these cheap companies grew to become the largest sector in the Deep Value portfolio at just over 22%. Due to this disparity, removing fossil fuels reduces the difference between the Cap portfolio and the strategies that exhibit a value tilt.
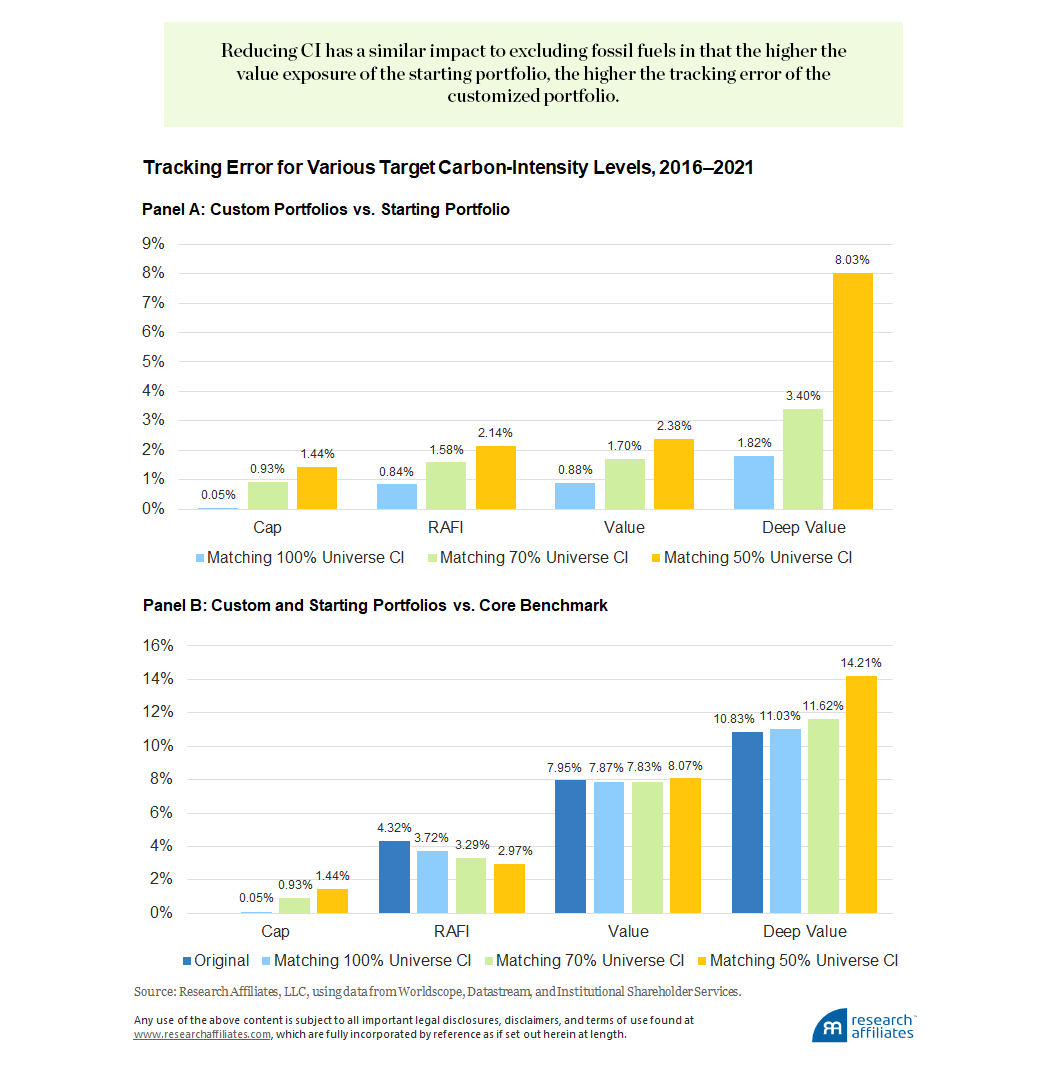
The final three customizations also focus on the climate impact of a portfolio. We measure the impact of constraining each portfolio to 100%, 70%, and 50% of the carbon intensity of the investable universe. Because we use an investable universe that is cap-weighted, the 100% constraint barely impacts the Cap portfolio.5 Reducing carbon intensity by 30% creates tracking error of 0.93% to the original cap-weighted index and a 50% carbon reduction results in tracking error of 1.44%. The modest tracking error compared to the starting cap-weighted portfolio is unsurprising given the even distribution of high- and low-CI companies in the starting portfolio and the Cap portfolio’s recent low exposure to the energy sector.
Educating investors about the impacts of customization should improve investment outcomes by reducing surprises and encouraging investors to stay the course.
”The relative cheapness and consequently larger exposure to energy stocks in the RAFI, Value, and Deep Value portfolios causes them to have a larger tracking-error impact from the CI constraints. Reducing the RAFI strategy’s carbon intensity to 100% of the investable universe creates 0.84% tracking error to the unconstrained version of the strategy, and the 30% and 50% reductions create 1.58% and 2.14% tracking error, respectively. The Value strategy has similar tracking errors of 0.88%, 1.70%, and 2.38% at the 100%, 70%, and 50% constraint levels, respectively, while the Deep Value portfolio experiences the biggest impact with tracking errors of 1.82%, 3.40%, and 8.03%, respectively. Restricting the Deep Value portfolio to 50% of the investable universe’s CI results in a customized portfolio nearly as different from its original version as the Russell 1000 Value and Russell 1000 Growth indices are from each other!
Similar to the impact of excluding fossil fuels, reducing the carbon intensity of the RAFI portfolio reduces tracking error against the core benchmark, which has little exposure to the high-carbon-emitting energy sector. The concentrated Deep Value portfolio, however, has very high tracking error versus the Cap portfolio of 14.21% due to its need to invest in the few available positions that exhibit below-market-average CI.
Active Share Drives Tracking Error
The active share between the unconstrained and constrained versions of each of the strategies we analyze drives the tracking error figures we observe. As we might expect, higher active share leads to higher tracking error. Although a simple and neat relationship does not exist, our findings show that tracking error is highly correlated with the active share induced by customization. We observe an average ratio of tracking error to active share of 8.5% with 8.56 basis points (bps) of standard error at a substantial R2 of 68%. This means we would expect every 100 bps of active share generated by portfolio customization to yield a custom portfolio whose returns will deviate from those of its original portfolio by at least 8.5 bps in roughly one out of every three years and by at least 17 bps in one out of every 20 years. More-material constraints than we consider in our analysis could lead to even higher deviations.
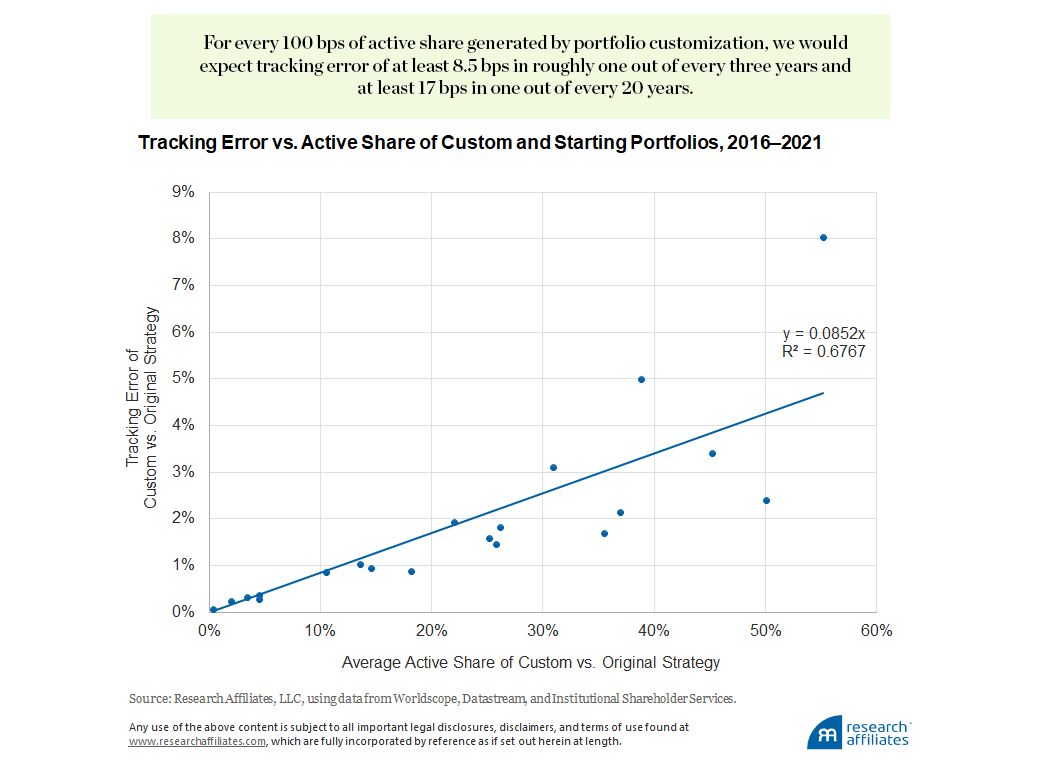
We observe a material jump in the ratio of tracking error to active share in the case of the Deep Value portfolio when constrained to 50% of the CI of the investable universe. The result is tracking error of 8.0% associated with an active share of 55%, or 15 bps of tracking error for every 100 bps of active share.
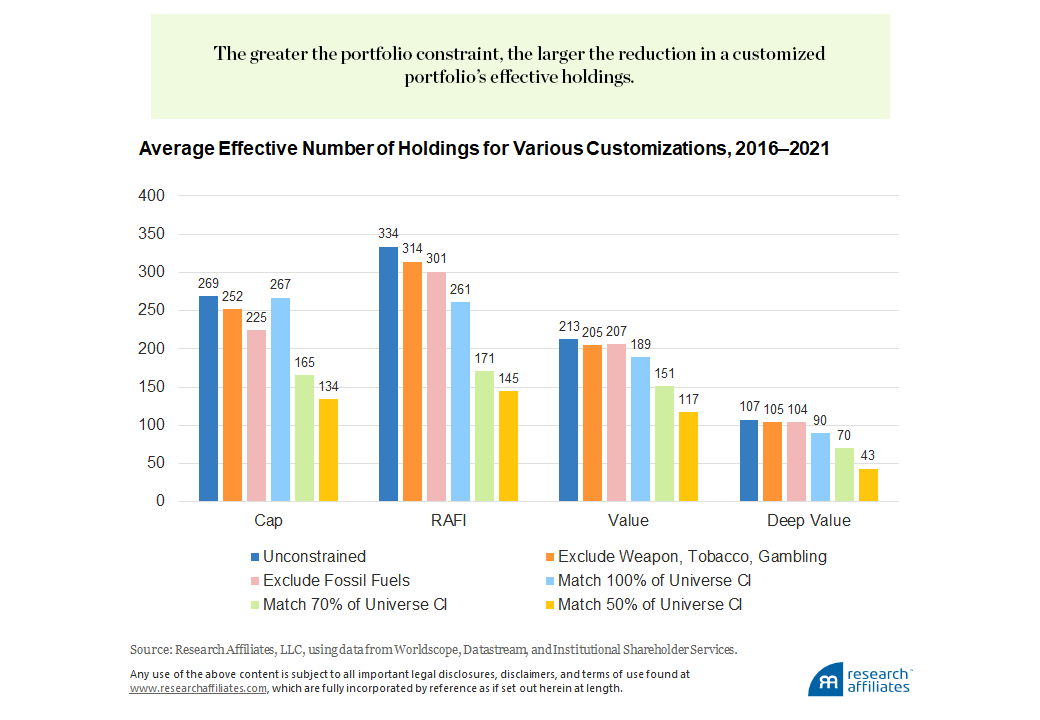
Customizations Lead to Concentration
As we have shown, customizations limit access to certain investment opportunities. We can measure portfolio diversification by the effective number of holdings.6 Each of our sample constraints reduces portfolio diversification. The greater the constraint, the larger the reduction in a customized portfolio’s effective holdings. On the one hand, removing weapons, tobacco, and gambling companies (the least restrictive of the constraints we analyze) results in less than a 10% reduction in effective holdings for each portfolio. On the other hand, a CI reduction of 50% of the investable universe reduces the effective number of holdings by 45% or more for each of the four equity strategies in our analysis. For the more-concentrated strategies, such as Value and Deep Value, further reduction in holdings could present problems for investors who wish to avoid portfolios whose returns can be impacted by company-specific risks.
Framing Investor Expectations
The findings of our analysis can provide a helpful way to frame expectations both for investors who are industry veterans and those whose areas of expertise lie in fields other than finance. When paired with a comparison to differences in tracking error and concentration level versus common benchmarks, this guidance can be particularly useful. For example, a nurse, doctor, or pharmacist who would like to exclude healthcare from their portfolio given the concentration of their human capital in that sector should expect tracking error of 85 bps to their unconstrained reference portfolio if healthcare composes 10% of that reference portfolio.
If that same healthcare professional would like to exclude the same sector exposure from a growth index for which healthcare represents 50% of the starting portfolio, assuming a much higher ratio, such as the one we observe when removing the majority of energy companies from the Deep Value portfolio, would be advisable. Expecting tracking error of 7.5% or more from an active share of 50% may make it easier to plan for the inevitable swings in relative returns.
The investment industry’s most important role (although many may view it as ancillary to the management of investment portfolios) may be the management of client expectations. Investors need to understand the portfolio characteristics, expected risk, and expected returns of the strategies they are considering. Direct indexing is no exception.
The choice provided by essentially infinite forms of portfolio customization allows investors to cater portfolios to their specific needs. Educating investors about the impacts of customization should improve investment outcomes by reducing surprises and encouraging investors to stay the course.

Endnotes
- We classify a company as fossil fuels if it derives more than 10% of its revenues from combined production, exploration, distribution, and services revenues related to fossil fuels or to coal mining or to oil sands or if it has any revenues from thermal coal mining or from electric power sourced from coal or from extraction and processing of oil sands.
- We define a company’s carbon intensity as its total scope 1 and scope 2 greenhouse gas (GHG) emissions, or equivalent, scaled by its total revenue. Other commonly used definitions can include scope 3 emissions or may use enterprise value including cash (EVIC) as the scalar. Brightman et al. (2022) analyze which of the two common carbon emissions scalars (revenues or EVIC) is the better measure for investors.
- Chow and Li (2022) offer a thorough breakdown of the relationship between a company’s valuation and its carbon intensity.
- The RAFI, Value, and Deep Value portfolios all exhibit higher tracking errors to the cap-weighted benchmark over the period of our analysis, 2016–2021, than over the longer period from 1991 to 2021. Value experienced an unprecedented level of underperformance relative to growth in terms of both magnitude and duration from 2006 to 2020, as Arnott et al. (2021) explain. This substantial underperformance of value translated into the elevated tracking error we observe from 2016 through 2021.
- The investable universe and the Cap portfolio are nearly identical. We reconstitute portfolios annually and apply customizations quarterly, hence the nonzero difference between the Cap portfolio and the investable universe.
- Effective Number = \(1/\sum_{i}weight_{i}^2\) . A portfolio that equally weights 1,000 assets leads to an effective number of 1,000. At the other extreme, a portfolio consisting of 99% in one asset and 0.1 bps in each of 999 other assets has an effective number close to 1.
References
Arnott, Robert D., Campbell R. Harvey, Vitali Kalesnik, and Juhani T. Linnainmaa. 2021. “Reports of Value’s Death May Be Greatly Exaggerated.” Financial Analysts Journal, vol. 22, no. 1: 44–67.
Brightman, Chris, Vitali Kalesnik, Ari Polychronopoulos, and Joseph Shim. 2022. "Carbon Intensity for Climate Mitigation: Clearing Up 'Scaling' Confusion." Research Affiliates Publications (July).
Chow, Tzee-Man, and Feifei Li. 2022. “No Good Deed Goes Unpunished? Social vs. Investment Objectives.” Available at SSRN.
