
Carbon Intensity for Climate Mitigation: Clearing Up “Scaling” Confusion
Carbon emissions need to be scaled by size for comparison across companies.
Carbon intensity (CI) can be measured using two popular scaling methods: 1) revenues and 2) enterprise value including cash (EVIC).
Prior research suggests revenue-based CI is the better measure, but our analysis finds the two methods largely equivalent and both are acceptable for investment purposes as long as companies are compared with their region and sector peers.
A quarter of the 500 largest asset managers have set a goal of net-zero carbon emissions by 2050 (Reinders and Heinsbroek, 2021). Carbon intensity (CI)—the measure of greenhouse gas (GHG) emissions scaled by a company’s size—is the key metric investors use to adjust their portfolios to reflect the investment risks and opportunities associated with global warming.
A heated debate is ongoing about which of two popular ways to measure carbon intensity is better: carbon emissions scaled by a company’s revenue—an older measure backed by the Task Force for Climate-Related Financial Disclosure (TCFD)—or carbon emissions scaled by enterprise value including cash (EVIC)—a newer measure proposed by the EU Technical Expert Group on Sustainable Finance (TEG) and codified in EU regulation in July 2020. The TEG’s rationale for using EVIC is that it better reflects a company’s stranded assets.1 This recommendation is receiving significant criticism, however, as opponents of the measure are pointing out a significant growth bias associated with it as well as potentially higher implementation costs.
Unlike the previous research, which suggests that EVIC-based CI is a worse option compared to revenue-based CI, we find that both measures are largely equivalent and are acceptable for investment purposes. Our analysis shows that EVIC-scaled carbon actually leads to somewhat reduced implementation costs (not higher than previously suggested). In addition, our results show that both measures introduce a material growth bias. The EVIC-scaled measure’s bias is slightly stronger, but the difference is much smaller in magnitude compared to the overall bias.
Create your free account or log in to keep reading.
Register or Log in
Why Do We Need to Scale Carbon Emissions?
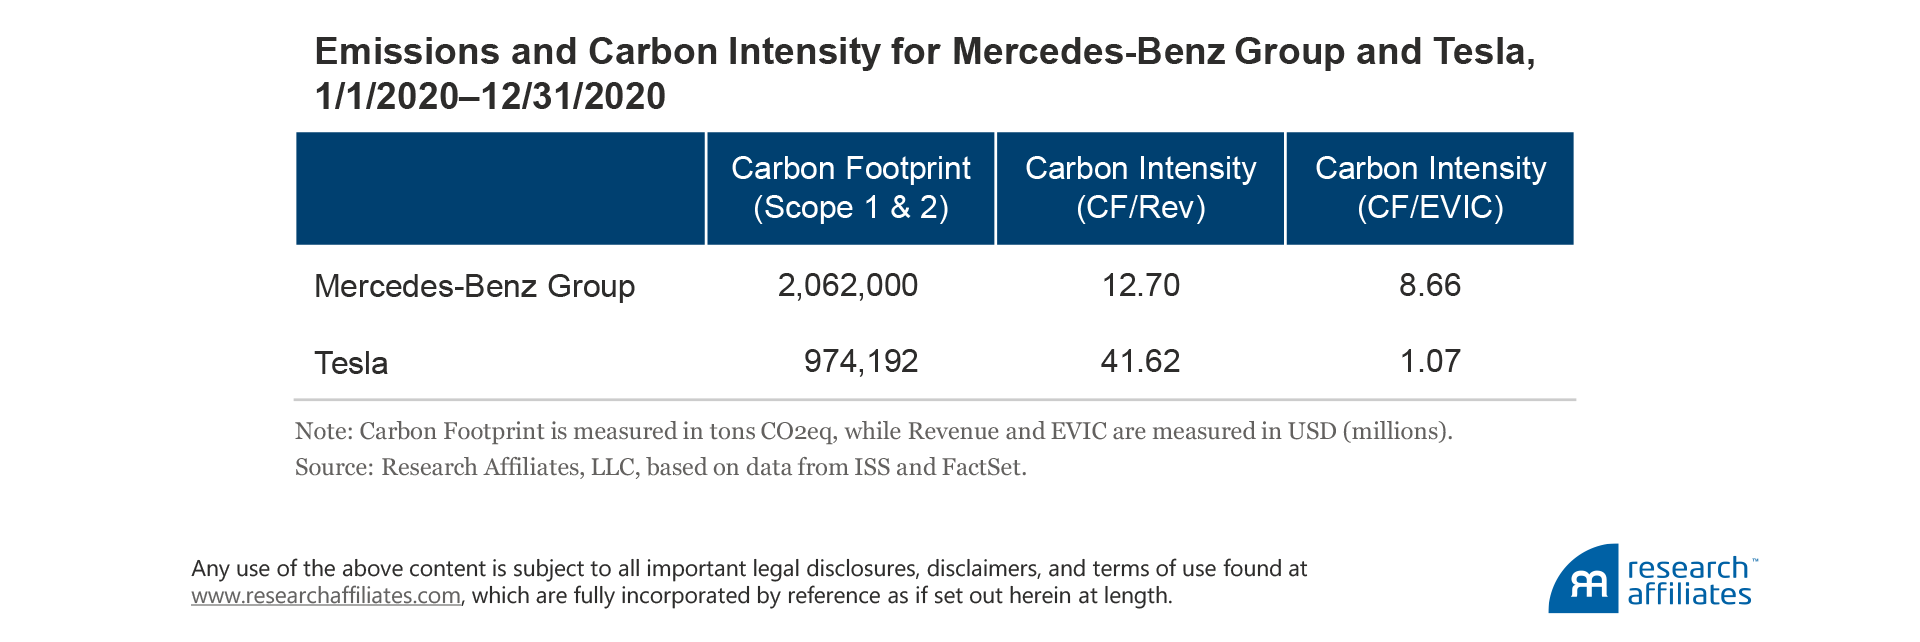
Carbon intensity is the emission rate of a given pollutant relative to the intensity of a specific activity. The benefit of using CI to compare company emissions rather than absolute carbon emissions is that carbon emissions are directly related to company size.2 The largest firms will typically have the largest carbon footprint. We can illustrate this example by comparing two auto manufacturers, Mercedes-Benz Group (MBG) (formerly, Daimler), and Tesla. MBG has a carbon footprint of 2.1 million tons carbon dioxide equivalent (CO2eq), more than twice Tesla’s footprint at 1.0 million tons CO2eq.3 Based on this measure, a climate-aware investor would see that Tesla has much lower absolute emissions than MBG.
But the absolute measure does not provide any information about how efficient the two companies are with those emissions. One way auto manufacturers can measure their carbon efficiency, or carbon intensity, is to scale that number by the number of cars produced. In 2020, MBG sold 2.8 million vehicles (Daimler, 2021) compared to Tesla’s sales of 0.5 million (Tesla, 2021), leading to carbon intensity relative to cars sold of 0.7 for MBG and 2.0 for Tesla. Per number of cars sold, MBG is more than twice as efficient as Tesla. Put another way, if Tesla were to produce the same amount of cars as MBG, its total carbon emissions would be 5.5 million tons CO2eq!
Obviously, using cars sold as the unit of measurement for determining carbon intensity is not very useful for companies that do not manufacture cars. Thus, to better compare results across industries, climate-aware investors have adopted two ways to measure carbon intensity:
- Carbon Footprint/Company Revenue—revenue represents the money generated from normal business operations, usually representing the number of units sold times the unit price.
- Carbon Footprint/EVIC—EVIC represents a company’s value composed of equity market capitalization, including both common and preferred shares, and the book value of total debt and minority interests without subtracting cash and cash equivalents.
The unit of measurement in the denominator can have a significant impact on a company’s overall carbon intensity. Let’s return to our example of MBG and Tesla and compare their CI using both revenue and enterprise value.
When we measure scaled by revenue, MBG has a much lower CI than Tesla. Unsurprisingly, because of the direct correlation between the number of cars sold and revenue, MBG’s CI is 3.3 times lower, similar to the result when we use cars sold as the unit of measurement. When we measure CI scaled by enterprise value, we get the opposite result: MBG’s CI is more than eight times higher than Tesla’s! These differences are due to MBG’s being a much larger company than Tesla when measured by revenue, whereas Tesla is a much larger company when measured by market capitalization.4
We observe a similarly noticeable difference at the portfolio level when we measure CI using the two alternative denominators. Let’s look at the Morningstar Developed Markets Large/Mid Index, a broadly diversified cap-weighted index. Carbon intensity for the index is 157 when revenue is the denominator and 49 when EVIC is the denominator. The differences are even greater when we measure CI for each sector.
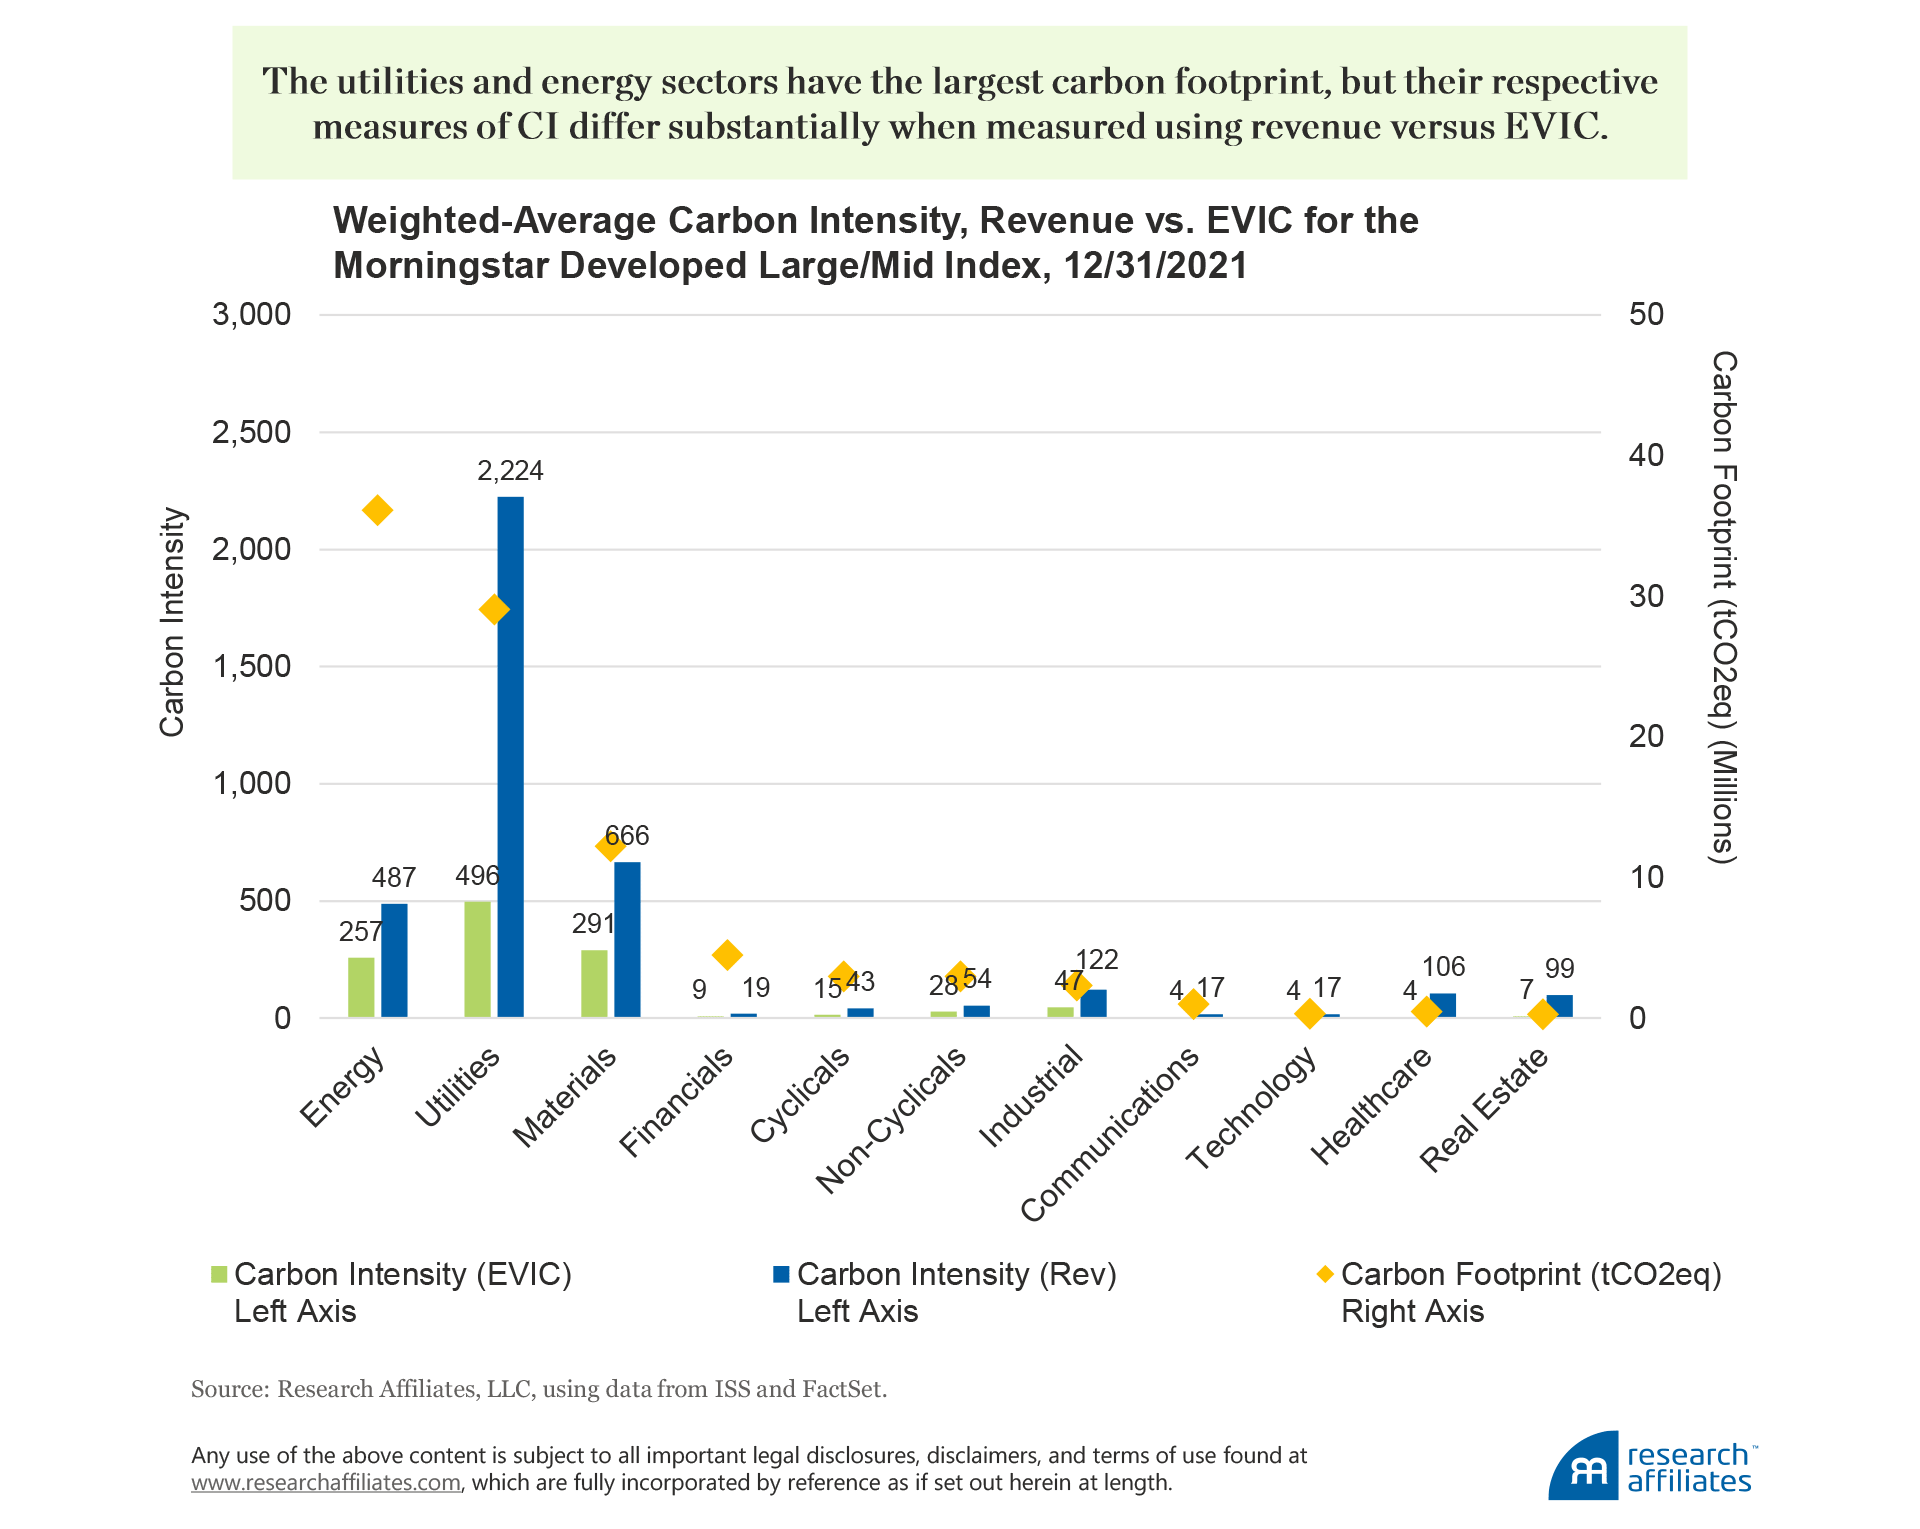
The two sectors with the largest carbon footprint are energy and utilities, and their respective CI scores differ substantially when calculated using the two methods. Using EVIC results in a CI for the energy sector of 257 compared to a CI for the utilities sector almost two times higher at 496. Measuring CI using revenue changes the picture, with CI increasing for the energy sector to 487 and CI for the utilities sector almost five times higher at 2,224! The vastly different results come down to the fact that energy companies’ revenues are more on par with their EVIC, while utility companies tend to have revenues much lower than their EVIC, giving them a much higher CI than the energy companies.
Portfolio Construction: Revenue vs. EVIC
The EU regulation adopted in July 2020 provides “Climate Transition” or “Paris-aligned” benchmarks for index strategies in line with the recommendations of the EU TEG (TEG, 2019). For an index strategy to use these labels now, the index must meet certain minimum requirements such as reducing carbon intensity by 30% at index launch and an additional 7% a year. The index is also required to have sufficient exposure to sectors with high potential impact on climate change (e.g., energy, transportation, and manufacturing). These minimum requirements allow comparability of climate benchmarks and limit the risk of greenwashing. The EU regulation brings some welcome clarity to climate investing, but does not eliminate all confusion because no universally accepted method for calculating CI has been adopted.
Ducoulombier and Liu (2020) recommend using revenue for measuring CI based on their analysis of the major issues associated with using EVIC. They point out that EVIC can only be used for publicly traded companies (for private companies, the EU allows the use of book value to measure EVIC, which can lead to data-comparability issues) and it is a much more volatile measure than revenue, which weakens the link between emissions and carbon intensity and can lead to greenwashing. Ducoulombier and Liu’s position contrasts with the TEG’s argument in favor of EVIC, based on their view that the revenue measure is not comparable across sectors and that companies with high exposures to stranded assets—coal companies, for example— disproportionally benefit from the use of revenue to measure CI (TEG, 2019).
To form our own opinion, we examined the effects of using each measure in the portfolio construction process, focusing on the following three measures:
- Degree of carbon emissions discrepancy when the two alternatives are used for portfolio construction and measurements.
- Value and growth style differences in the resulting portfolio.
- Transaction costs and other associated implementation characteristics.
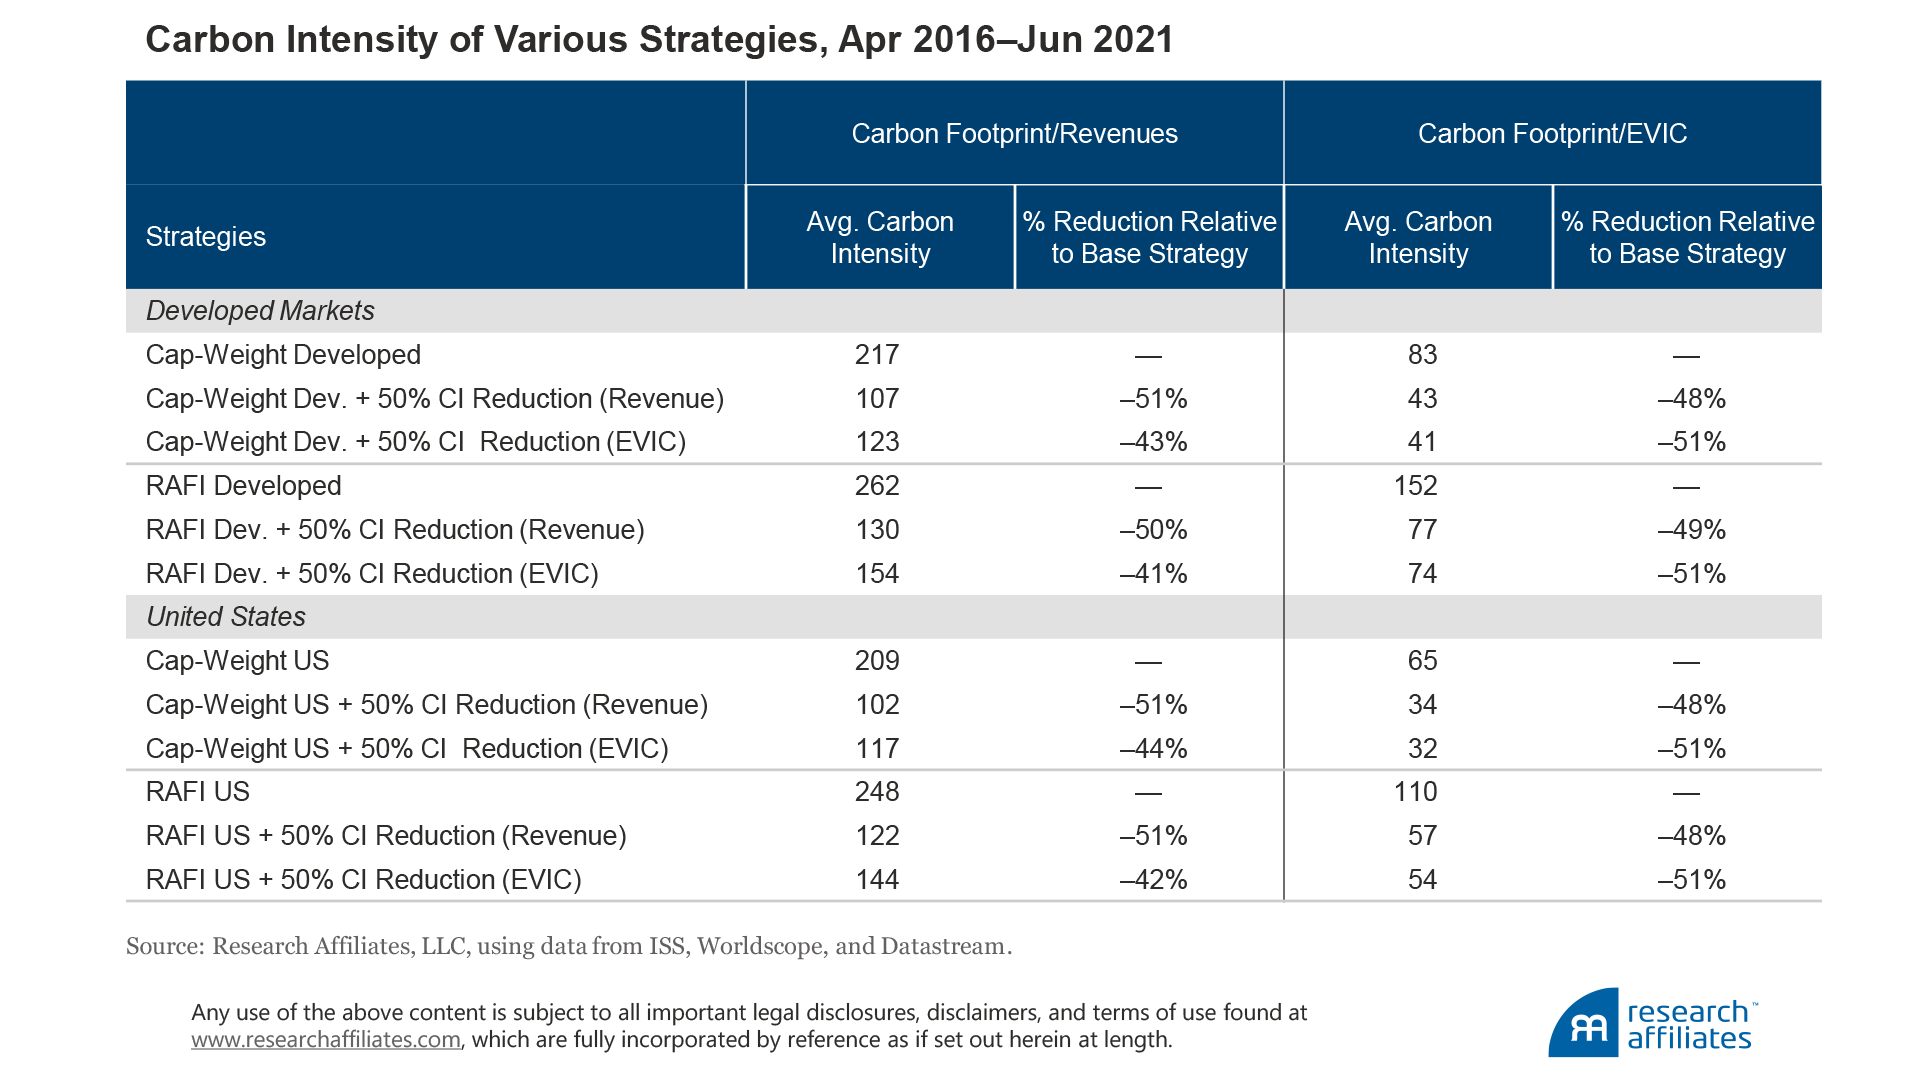
For our analysis over the period April 2016–June 2021, we constructed several portfolios in the US market and the developed markets: a capitalization-weighted portfolio which selects the largest 86% of companies by market capitalization in each country;5 the preceding strategy that maintains a 50% reduction in CI relative to the cap-weighted index portfolio at each rebalance using carbon footprint scaled by revenue to measure CI;6 a strategy with the same parameters as the preceding strategy but with scaling by EVIC; and to determine the effect on smart beta strategies, we apply the same approach to a fundamentally weighted portfolio using the RAFI™ Fundamental Index™ methodology.7 For the fundamentally weighted portfolio analysis, we select the top 86% of companies within each country by fundamental weight and then maintain a 50% reduction in carbon intensity relative to the fundamentally weighted index portfolio at each rebalance, using revenue to measure CI in one portfolio and EVIC to measure CI in another.
The EU regulation brings some welcome clarity to climate investing, but does not eliminate all confusion.
”We follow the EU approach and reduce CI within each region/sector by tilting the portfolio weights. By normalizing CI scores within region/sector we can avoid greenwashing. For example, a strategy that looks at absolute CI within the eligible universe would result in tilting the portfolio toward low-emitting sectors, such as technology, and away from high-emitting sectors, such as energy and materials. An investment strategy that achieves emission reduction by solely allocating to low-emission sectors is not ideal for investors who seek to invest their capital so as to encourage high-emitting companies to transition to a low carbon economy. In fact, the EU requires that investment strategies labeled Climate Transition or Paris-Aligned maintain sector exposure to high-emitting sectors equivalent to the fund’s starting universe. When testing the various portfolio construction approaches we find that tilting within sector resulted in an approximately 5.4% higher weight toward high-emitting sectors across the various methods versus tilting across sector.8
We find that regardless of the CI measure used to construct the CI-reduced portfolios (both cap-weighted and fundamentally weighted), the carbon intensity reduction relative to the benchmark remains relatively stable at about 50%.
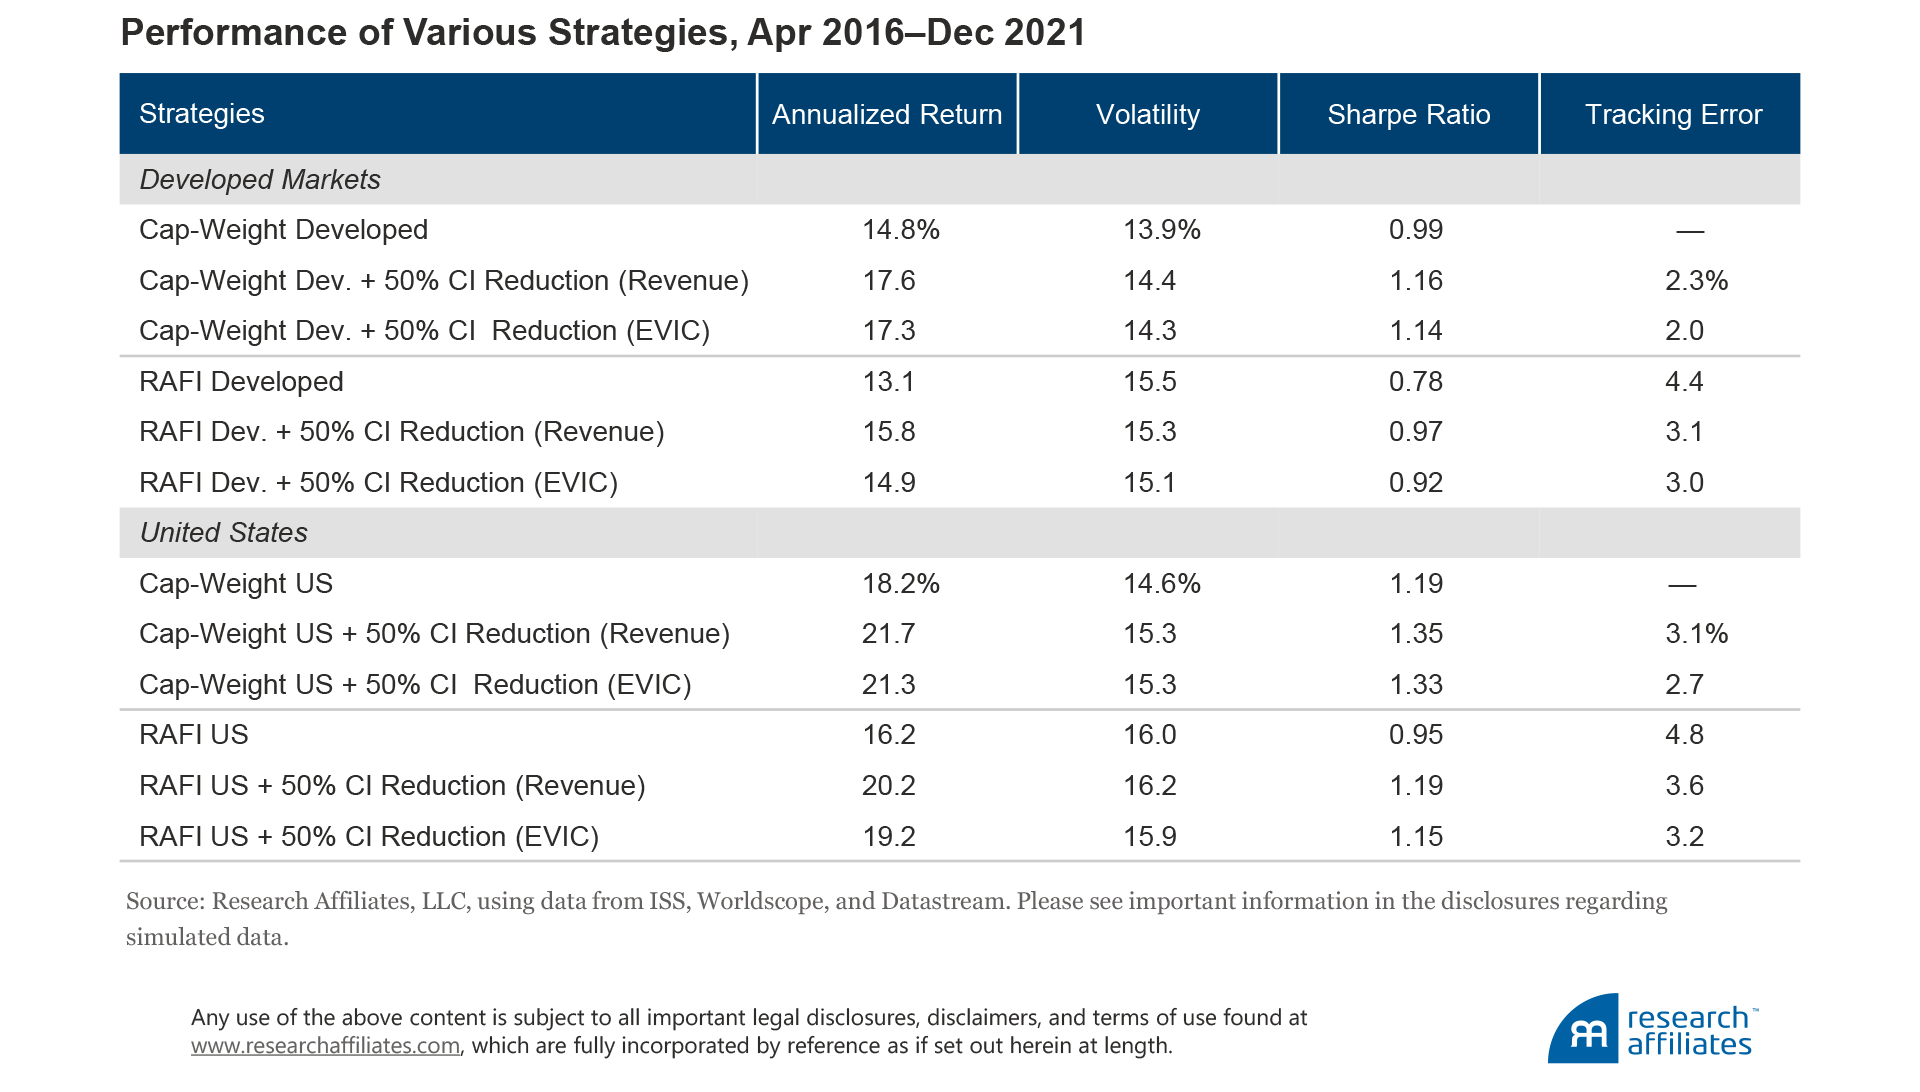
Our analysis does not indicate that one measurement of CI is superior in terms of performance. Granted, we are using a short time series due to the lack of availability of long-term emissions data. For the cap-weighted CI-reduced strategies, the annualized return for the strategies constructed using revenue is slightly higher in both the US and developed markets. Returns are also higher for the fundamentally weighted strategies for which carbon intensity is scaled by revenue. On average across all strategies, returns are approximately 65 basis points a year higher when CI is measured using revenue. Volatility is also slightly higher for the strategies that use revenue, leading to their having similar Sharpe ratios. Over the period of our analysis, the outperformance of the strategies using revenue to measure carbon intensity can almost entirely be attributed to the overweight in Apple stock.9
We begin to see some notable differences, however, when we compare the portfolios’ characteristics and implementation costs. The strategies that scale CI by revenue tend to have slightly lower valuations measured by price-to-earnings ratio (P/E), price-to-book ratio (P/B), price-to-sales ratio (P/S), and dividend yield. Scaling by revenue tilts the portfolio toward companies that have large revenues and lower market-caps (high revenues lead to lower carbon intensity). These companies tend to be value companies, which leads to a slightly cheaper portfolio for the revenue-scaled strategy compared to the EVIC-scaled strategy. This tilt is highlighted in the following table where we compare average discounts/premiums to market-cap.
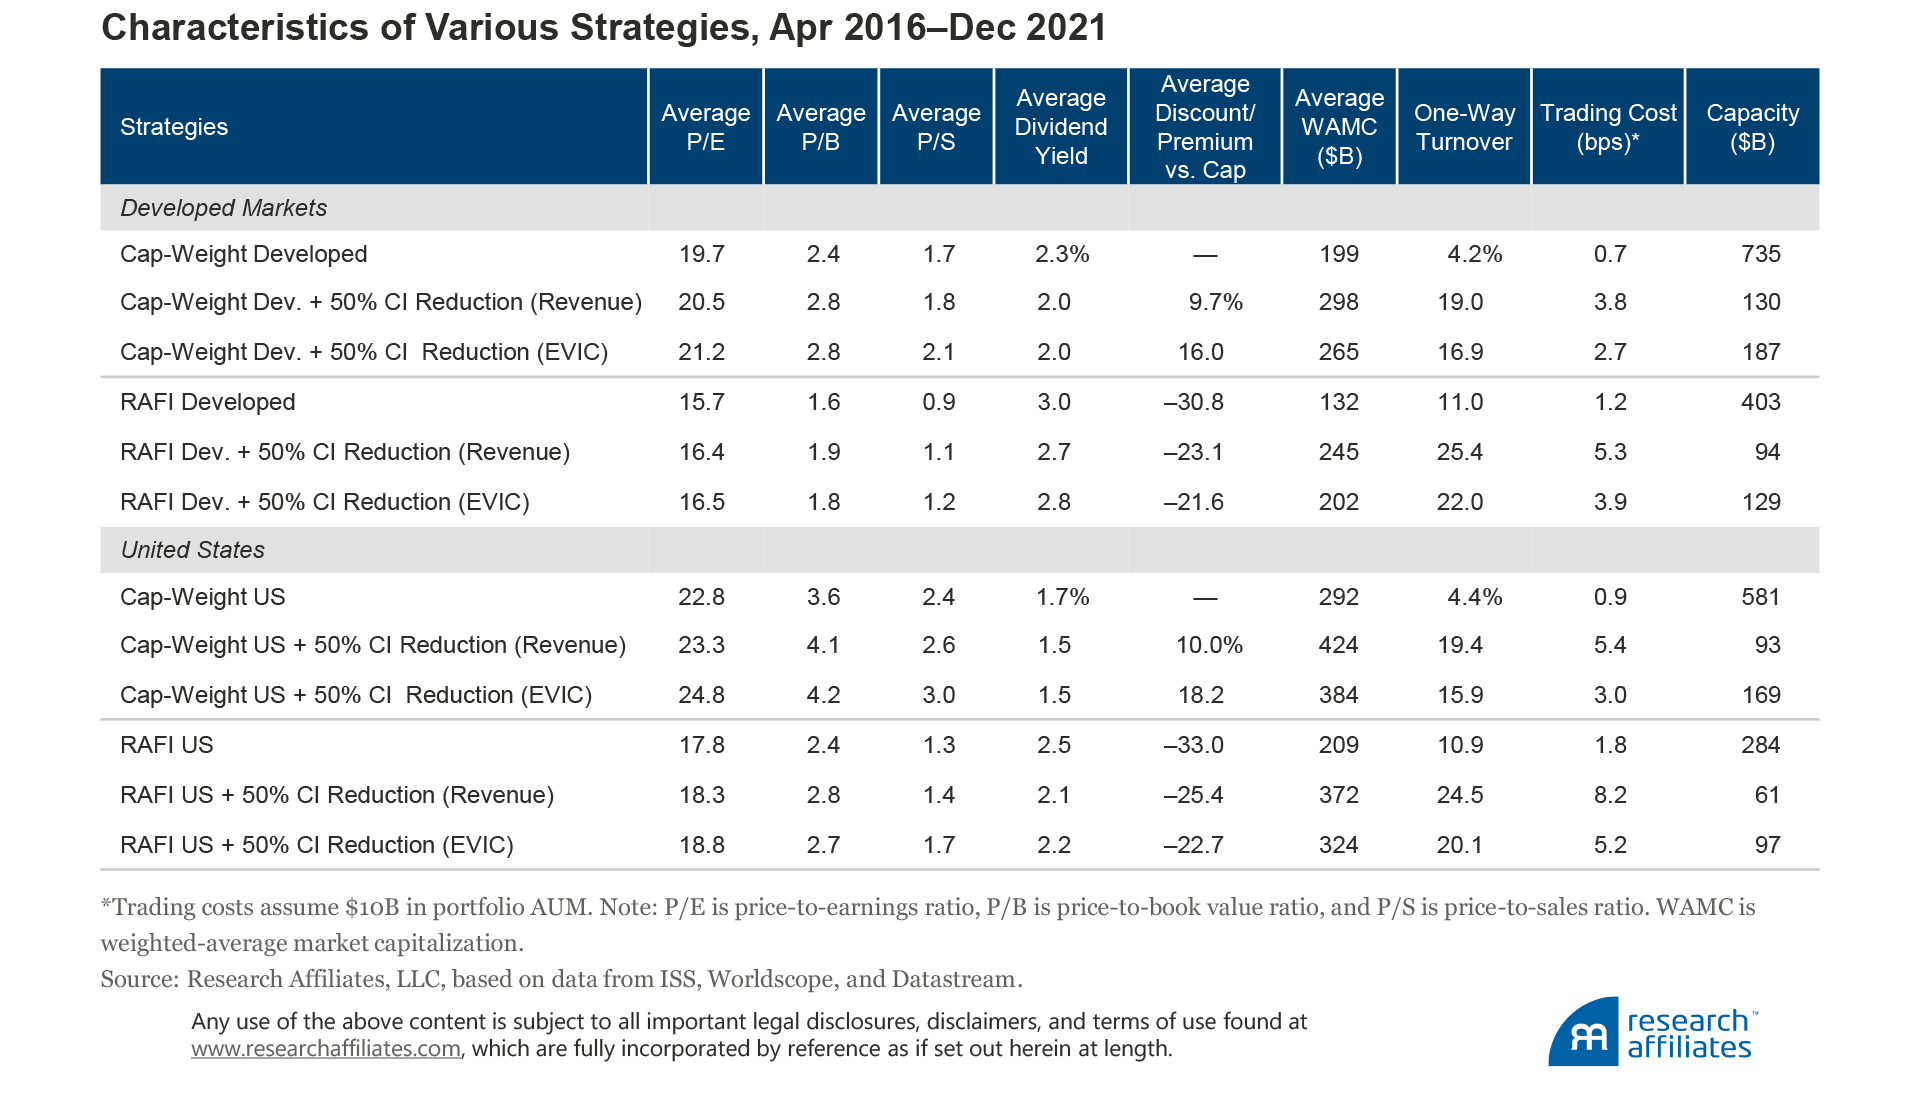
In each case, the strategy that uses revenues to measure CI is trading cheaper than the strategy that uses EVIC. Conversely, the strategies that scale CI by EVIC have lower turnover and implementation costs and higher capacity (trading costs are approximately 35% lower on average). When scaling by EVIC, a measure that is highly correlated with market capitalization by definition, the portfolio tilts toward companies that have a large EVIC and lower revenues (high EVIC leads to lower carbon intensity). The impact of EVIC is to move the portfolio toward the market-cap benchmark, resulting in lower tracking error.
We highlight these differences while acknowledging they are small. Comparing the overall CI for each strategy by both measures of revenue and EVIC clarifies why the portfolios are similar across their respective performance, characteristics, and CI reductions. Given the differences between certain companies and sectors, why this similarity?
The two popular methods—scaling by revenues and scaling by EVIC—have different investment repercussions for portfolios.
”Even with the large differences we observe between sectors when using the two methods for measuring carbon intensity, the relative differences between companies within each sector remain fairly consistent. Our portfolio construction approach tilts companies within sectors rather than across sectors. As an aside, had we tilted company weights based on absolute carbon intensity across sectors we would have observed even smaller differences, but would also have created the undesirable effect of significant sector weight shifts away from high-emitting sectors, such as energy and materials, and into low-emitting sectors, such as technology, and thereby essentially greenwashed the portfolio. In addition, we know from prior research that for investors who desire to reduce carbon intensity in their portfolios, one of the most effective ways is through the divestment of coal companies. We found that the simple exclusion of coal companies resulted in an approximately 40% reduction for strategies using revenue to measure CI and a 30% reduction for strategies using the EVIC measure.
Conclusion
Climate investing has grown in interest and importance as investors look for ways to combat climate change. The importance of understanding the different methods used in measuring CI is paramount for investors, however, because the two popular methods—scaling by revenues and scaling by EVIC—have different investment repercussions for portfolios. We observe noticeable differences in the CI of individual stocks (our example of MBG versus Tesla) and sectors (our analysis of the Morningstar Developed Large/Mid Index) when measured using the two popular alternatives. Fortunately, these differences largely cancel out at the overall portfolio level.
Both measures lead to a strong growth bias, but scaling by EVIC leads to a marginally stronger growth bias.
”We find that both measures lead to a strong growth bias, but scaling by EVIC leads to a marginally stronger growth bias. For investors who are concerned about valuations, such as those using smart beta or value-oriented strategies, using revenue to scale carbon emissions may be the better choice. We observe, however, that the use of EVIC to scale emissions leads to lower transaction costs and higher investment capacity and may appeal to investors in a cap-weighted or growth-oriented strategy. Unlike the prior studies which argue that EVIC is not an acceptable scaler for carbon emissions, we find it is largely equivalent to revenue. An investor’s choice between the two scaling options should largely depend on the (slight) transaction cost/growth bias trade-off between them and the need to adhere to applicable regulations or standards.
Please read our disclosures concurrent with this publication: https://www.researchaffiliates.com/legal/disclosures#investment-adviser-disclosure-and-disclaimers.


Endnotes
- The term stranded assets refers to a company’s assets tied to proven or probable fossil fuel reserves. A potentially significant share of the reserves will not be utilized if the world transitions to a low-carbon economy in line with the Paris Agreement. Therefore, the contribution of these fossil fuel reserves to the company’s financial valuation could be overstated, which leads to significant risks for investors (TEG, 2019).
- In our analysis, we measure carbon footprint and carbon intensity using scope 1 and scope 2 emissions only. The GHG Protocol classifies carbon emissions reporting into three categories: 1) direct GHG emissions (scope 1); 2) indirect GHG emissions (scope 2) composed of direct emissions from sources owned or controlled by the company and indirect emissions from the generation of purchased electricity consumed by the company; and 3) other indirect emissions (scope 3) for which reporting is optional. Scope 3 emissions arise from the activities of the company, but occur from sources not owned or controlled by the company. The GHG Protocol Initiative, launched in 1998, is a multi-stakeholder partnership of businesses, nongovernmental organizations (NGOs), governments, and other entities convened by the World Resources Institute (WRI), a US-based environmental NGO, and the World Business Council for Sustainable Development (WBCSD), a Geneva-based coalition of 170 international companies. The Initiative’s mission is to develop internationally accepted greenhouse gas accounting and reporting standards for business and to promote the standards’ broad adoption.
- Source is Institutional Shareholder Services (ISS). We use 2020 scope 1 and scope 2 emissions data.
- A valid criticism is that these numbers do not incorporate scope 3 data. Given that vehicles produced by Tesla create far lower emissions that MBG, what would these numbers look like if we were to incorporate scope 3 data? MBG’s scope 3 emissions are 5.8 times higher than Tesla’s (102.2 million tons CO2eq compared to 17.8 million tons CO2eq). Incorporating the scope 3 emissions data would yield a similar result as using scope 1 and 2 emissions only: MBG has lower CI when using revenue (642.5 versus 800.4) and a higher CI when using EVIC (438.0 versus 20.6) to scale emissions.
- The top 86% commonly represents a combined large- and medium-size company universe. The portfolio is rebalanced semi-annually on January 1 and July 1. The developed countries in our universe are Australia, Austria, Belgium, Canada, Denmark, Finland, France, Germany, Greece, Hong Kong, Ireland, Israel, Italy, Japan, Luxembourg, Netherlands, New Zealand, Norway, Portugal, Singapore, Spain, Sweden, Switzerland, United Kingdom, and United States.
- The 50% reduction in CI strategy is rebalanced quarterly on the first of January, April, July, and October. At each rebalance, we apply a tilting process that uses a z-score based on the log of a company’s carbon intensity within each region/sector to tilt toward companies with low CI and away from companies with higher CI.
- The RAFI Fundamental Index methodology uses fundamental measures of company size (adjusted sales, adjusted cash flow, dividends + buybacks, and book value + intangibles) to select and weight index constituents. More information on the RAFI approach is available at https://www.rafi.com/index-strategies/rafi-fundamental-indices.
- In EU regulation, high climate-impact sectors are defined by the following NACE section codes:
- Apple’s CI when scaled by revenue is lower than its CI when scaled by EVIC relative to other tech companies. This results in a higher weight to Apple in the CI-reduction strategy using revenue. Apple outperformed the developed market by nearly 20% over our analysis period.

References
Daimler. 2021. Annual Report 2020. Daimler Group (February 18).
Ducoulombier, Frederic, and Victor Liu. 2021. “Carbon Intensity Bumps on the Way to Net Zero.” Journal of Impact & ESG, vol. 1, no. 3 (October): 59–73.
Reinders, Sebastiaan, and Adrie Heinsbroek. 2021. “Net Zero Emissions Are a Goal for 24% of Asset Managers Ahead of COP26.” NN Investment Partners (October 28).
TEG. 2019. TEG Final Report on Climate Benchmarks and Benchmarks’ ESG Disclosures. EU Technical Expert Group on Sustainable Finance Technical Report (September). Available at https://ec.europa.eu/.
Tesla. 2021. “Press Release: Tesla Q4 2020 Vehicle Production & Deliveries.” Tesla.com (January 2).
