Necessary Trade-Offs: Climate vs. Investment Objectives for Value Strategies
We illustrate the types of trade-offs investors with dual social and investment objectives must make in their portfolios. We use the example of a carbon reduction constraint on a value manager.
In our example, we find that the preference for a low carbon intensity level in a value strategy leads to impractically high levels of concentration and illiquidity. Trade-offs in both the amount of carbon reduction and in the ability to achieve a deep-value bias are a necessary part of meeting these dual objectives.
Regardless of the choice of dual objectives, investors should set realistic expectations when they seek to combine value investing and climate investing.
Many of us aspire to “do good” through the choices we make in our personal and professional lives. Sustainable investing, also called socially responsible investing, impact investing, and environmental, social, and governance (ESG) investing, is viewed by many investors as offering an opportunity to positively influence issues important to them, such as climate change, diversity, and wealth inequality. Investors who seek to “do good” through their investment choices can potentially face trade-offs in their portfolios’ characteristics and outcomes.
Create your free account or log in to keep reading.
Register or Log in
Investors should set realistic expectations when they seek to combine value investing and climate investing.
”We illustrate the types of trade-offs investors with dual social and investment objectives must make in their portfolios when considering a carbon reduction constraint on a value manager. Companies with attractive valuation multiples typically have high-carbon profiles (e.g., in 2021, a typical value portfolio had a carbon intensity level higher than three times the market average). Therefore, the opportunity set of low-carbon deep-value companies is very limited. The result is that the preference for a low carbon intensity level in a value strategy easily leads to impractically high levels of concentration and illiquidity. Trade-offs in both the amount of carbon reduction and in the ability to achieve a deep-value bias are a necessary part of meeting these dual objectives.
Our findings indicate that investors should set realistic expectations when they seek to combine value investing and climate investing.1
A Brief Description of Our Analysis
We chose to analyze a carbon reduction constraint because carbon emissions data tend to be more measurable and quantifiable than other ESG metrics, which suffer from lack of disclosure, inconsistency of definition, and subjectivity by the ratings provider as to relevance and reporting standards. In addition, the much narrower goal of carbon reduction, as opposed to broad ESG investing, introduces significant disparities across sectors. Similarly, whereas we chose to focus on value investing because its relationship with carbon emissions brings forward the most noteworthy observations, the analysis can be applied to other equity factors
Sector Bias in Low-Carbon Investing
The primary source of greenhouse gas (GHG) emissions is the burning of fossil fuels, which is highly correlated with certain types of business activity (i.e., different sectors have very different carbon emission profiles). For example, energy and utility companies tend to create much more carbon dioxide than financial companies. Consequently, a social objective of a reduced-carbon profile leads to making significant active sector bets. Utilities, followed by basic materials, are the top sector contributors to GHG emissions, accounting for almost two-thirds of total annual emissions in the global developed markets. In contrast, the telecommunications, technology, and health care sectors each contribute less than 1% to total annual GHG emissions. The carbon intensity measure shows a similar pattern of the various carbon exposures of the sectors regardless of the scalar (revenues or EVIC) used.2
The sectors’ carbon profiles have a significant impact on an investment portfolio. A low-carbon investing objective necessarily and strongly pushes asset allocations away from utilities (and basic materials and energy) companies and into technology (and telecom and financial) companies or other sectors with a low-carbon footprint. From 2016 to 2021, our study period, the very-high-carbon and very-low-carbon sectors became remarkably cheap and expensive, respectively. In this environment, if a decarbonization requirement is in place, a value strategy struggles to maintain the desired position in undervalued companies.
Low Carbon Intensity vs. Deep-Value Objective
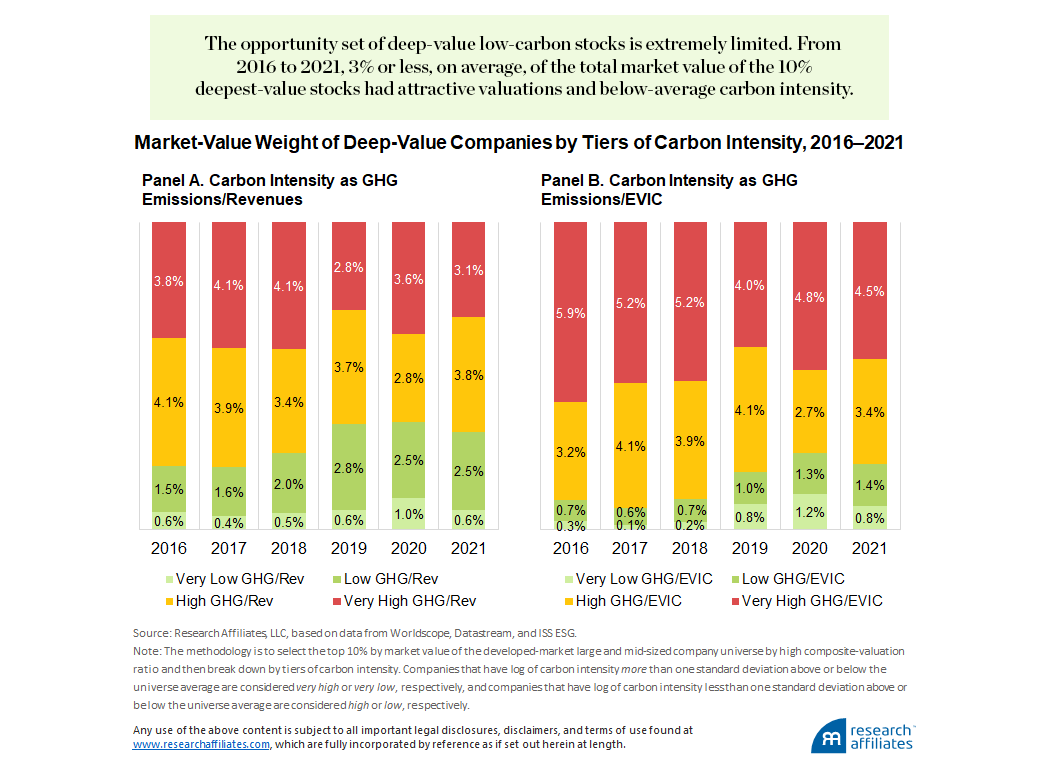
To put the relationship of valuation and carbon intensity in context, we examine the carbon intensity levels of companies that have a high fundamentals-to-market ratio (aka a deep-value stock). For each year in our sample, we rank all stocks in the starting universe by composite valuation ratio from high to low, then select the top 10% of total market value (approximately 30% by count). We break down this selection into tiers of carbon intensity. Companies that have log of carbon intensity greater than one standard deviation above or below the market average are considered very high or very low, respectively, and those with log of carbon intensity less than one standard deviation above or below the market average are considered high or low, respectively.
Investors should be conscious of how their social responsibility objective can impact their portfolio’s investment performance, while also being conscious of how meeting their investment performance target can impact their ESG goal.
”
The majority of value companies have a high level of carbon intensity. On average, 7.2% of the 10% of market value representing the deepest-value (i.e., highest composite valuation) companies have either high or very high carbon intensity when measured by revenues and 8.5% when measured by EVIC. This finding illustrates the challenge imposed by the desire to decarbonize a deep-value portfolio—from 2016 to 2021 only 3% or less, on average, of the total market value of the 10% deepest-value stocks had attractive valuations and below-average carbon intensity. The opportunity set is extremely limited.
Carbon Intensity’s Relationship with Size and Momentum
By their nature, the size and momentum factors suggest entirely different relationships with carbon intensity. Small-sized companies correlate strongly with deep-value companies because the size characteristic (market capitalization) is in the denominator of the fundamentals-to-market ratios. In contrast, high-momentum (high short-term return) stocks gravitate away from a deep-value classification as their prices outpace the trend of their fundamentals.
We find that carbon intensity is inversely related to company size, a relationship that is statistically significant using both revenues and EVIC as the denominator.3 This observation is intuitively appealing because larger companies have more resources to invest in improving efficiency and raising productivity for every unit of carbon pollution. Carbon intensity is also significantly and inversely related to recent stock returns.
In examining changes in carbon intensity, we find that GHG emissions depend on lines of business, which tend to change very little from year to year. A significant revision of carbon intensity is possibly caused by a big change in the scalar, whether revenues or EVIC. A decarbonization process reallocates to companies with decreasing carbon intensity. Holding all else constant, this process sells out of companies with decreasing revenues or EVIC and buys into those with increasing revenues or EVIC. Because the change in EVIC is driven mostly by the change in market capitalization, the decarbonization process resembles a strategy that buys stocks with strong momentum.
In summary, lowering carbon intensity leads to larger size and stronger momentum characteristics in an investment portfolio. Both compete against classifying the portfolio as deep value.
Decarbonization Portfolio Analysis
We apply a simple, straightforward process for constructing a deep-value low-carbon strategy and demonstrate what such a portfolio would look like. Our starting point, or baseline, is a naïvely constructed value strategy. To create the baseline portfolio we rank the universe of large and mid-sized companies in the developed markets by their composite valuation and allocate to the cheapest 10% of stocks based on market-cap weights. (The appendix describes our empirical analysis.)
We attempt to lower the baseline portfolio’s carbon intensity using an iterative process of reallocating weights from those companies with high carbon intensity to their lower carbon intensity counterparts.4 We limit reallocations to only those stocks in the baseline portfolio in order to preserve the value characteristics of the portfolio. Whether measured by the price-to-book ratio or the composite valuation ratio, the carbon-constrained value strategies stay within 28% and 36% as cheap as the universe’s price-to-fundamentals multiple.
To construct the portfolios, we first set target carbon intensity at 100% of the market-cap-weighted average of the starting universe and then progressively lower the target to 50% of the universe average. In 2021, the carbon intensity of the universe, which is the reference for setting the carbon intensity target, is 164 t CO2/$M of revenues. As expected, the naïve value strategy has high average carbon intensity, at 130% of the universe average, or 209 t CO2/$M. When measured with EVIC, however, in 2021 carbon intensity is 60 t CO2/$M for the universe and 208 t CO2/$M for the naïve value strategy (3.45 times the universe). For the value strategies, the carbon intensity relative to the universe is always higher when intensity is measured as GHG Emissions/EVIC.
The 100% target is appropriate for investors who wish to preserve as many value portfolio characteristics as possible, while not producing more than the market average of carbon pollution. The universe-average targets of 70% and 50% are related to two benchmarks proposed by the EU TEG: the Climate Transition Benchmark (CTB) and Paris-Aligned Benchmark (PAB). The 70% target adheres to the CTB requirement and the 50% target adheres to the more stringent PAB requirement. The 50% target is also similar to the target level of a CTB-compliant strategy five years after inception, because the EU TEG guideline also calls for a 7% year-over-year reduction in carbon intensity.5
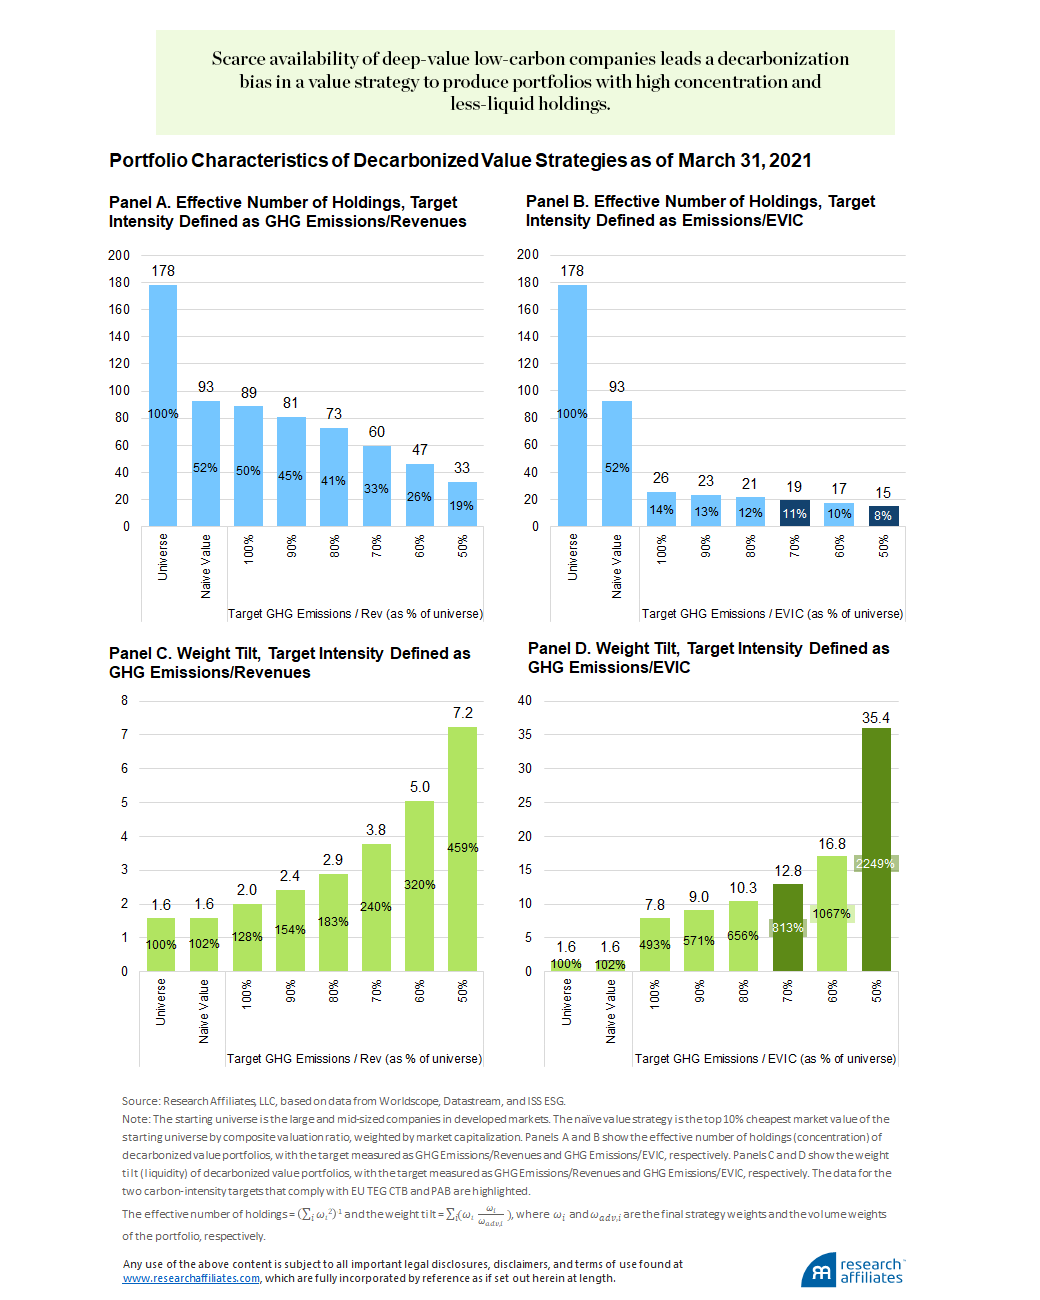
The iterative-weight updating process steers portfolios toward low carbon with little constraints. In theory we should be able to achieve the decarbonization targets without harming the portfolio’s valuation. Because of scarce availability of low-carbon and deep-value companies, the decarbonization bias leads, however, to impractical portfolio characteristics. These portfolio characteristics—high concentration and low liquidity—are the key drivers of the transaction costs required to maintain the value strategies.
As of March 31, 2021, the naïve value strategy had 93 effective holdings, a concentration level roughly double that of the universe. Concentration increased further with lower target carbon intensity. At 70% and 50% of the universe average (the levels required by the EU CTB and EU PAB, respectively), when we measure carbon intensity by GHG Emissions/EVIC, the effective number of holdings is reduced to only 19 and 15, respectively. In other words, allocations are limited to effectively less than 20 holdings in order to comply with the EU benchmarks, despite a starting universe of more than 600 holdings in the naïve value strategy.
The weight tilt, defined as the average deviation from the trading-volume weight of the holdings, is a measure of portfolio illiquidity and increases with higher allocations to less-liquid holdings. The universe and the naïve value strategy are weighted by market capitalization, which is highly correlated to liquidity, resulting in a low weight tilt of 1.6 as of March 31, 2021. The weight tilt increases rapidly with increasing restrictions on carbon, rising to 12.8 and 35.4 for the 70% and 50% targets, respectively, which comply with the EU benchmarks. Assuming a similar average turnover rate, the costs of rebalancing the value strategy at these decarbonization levels are 8 times (12.8/1.6) and 22 times (35.4/1.6) more costly than the naïve value strategy!6 If the expected excess return of the baseline value strategy is not more than 8 times or 22 times the expected transaction costs, the expected excess return is completely eroded by the low-carbon restrictions.7 In such a case, the investment objective and the social objective of this strategy cannot coexist.

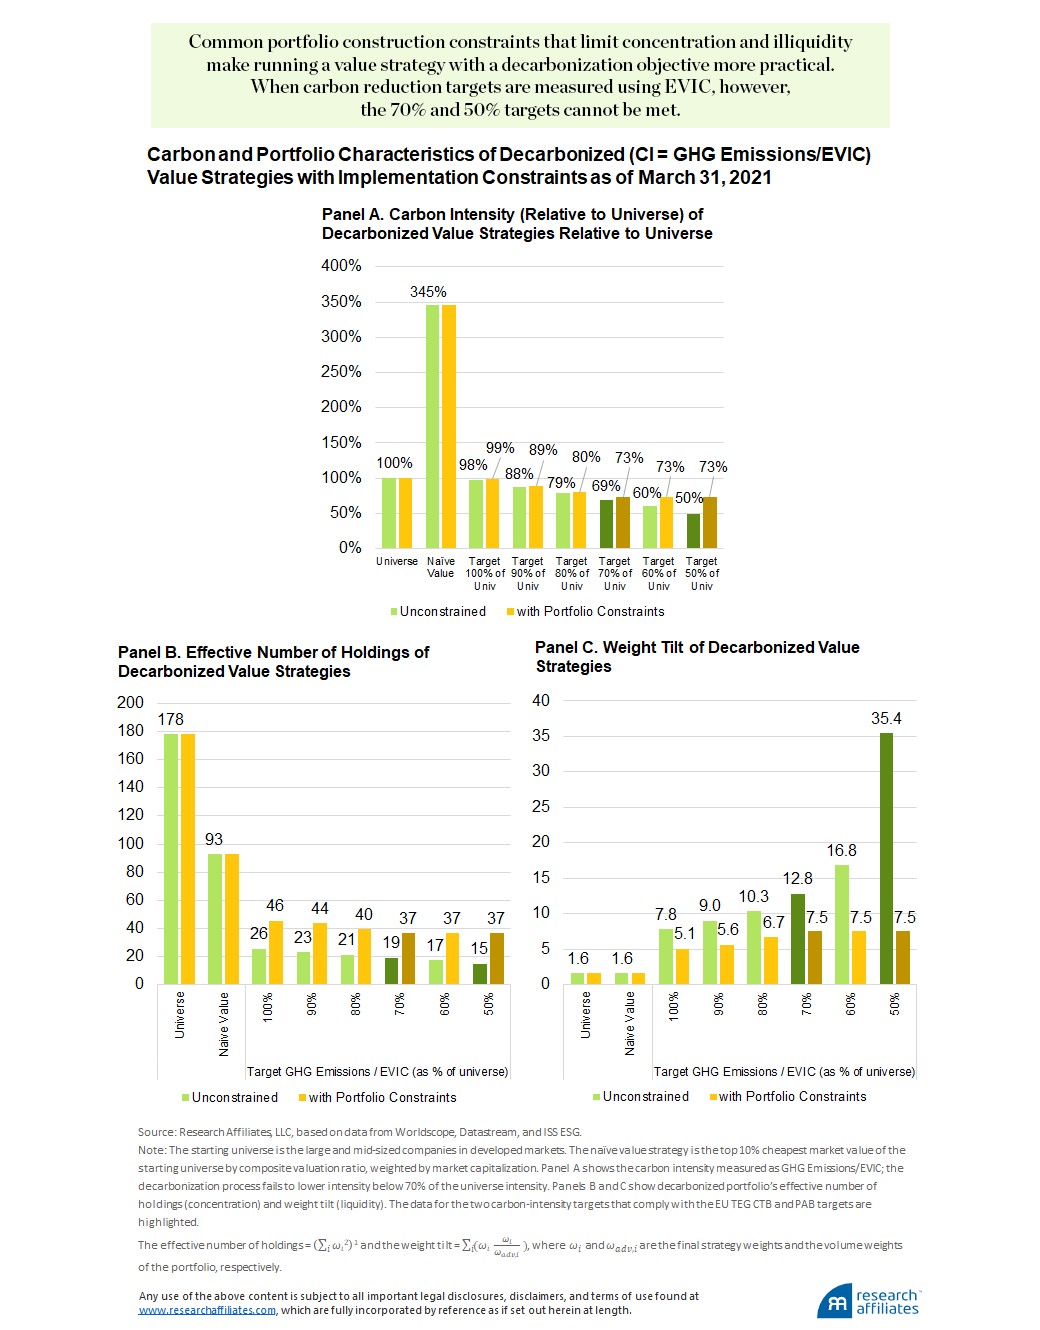
Next, we use a similar weight-updating process, but impose two common construction constraints to keep the portfolios from being too concentrated in illiquid holdings: we limit the weight of a single holding to 1) no more than 5% and 2) no more than 10 times its volume weight.
The newly introduced implementation constraints are able to improve the characteristics related to transaction costs, so that running the value strategy becomes more practical. For example, as of March 31, 2021, the expected transaction cost of targeting 50% of universe intensity is 5 times, rather than 22 times, that of the baseline strategy (weight tilt = 7.5, ~ 5x of baseline). Unfortunately, when carbon reduction targets are measured using EVIC, because the baseline portfolio has immense carbon intensity of 345%, meeting the 70% and 50% targets is too difficult and the improvements are rendered unimportant. When targets are measured using revenues, however, the resulting portfolios are able to successfully meet the targets.

The Trade-Off between Doing Good and Doing Well
Achieving a climate objective together with an investment objective (value) is not a trivial task. An investor seeking to satisfy both should consider relaxing their climate objective while making practical adjustments to the style- or factor-investing methodology they have selected to meet their investment objective. In the case of a carbon intensity reduction objective, one possible trade-off is to use revenues (or other fundamental metrics) as the denominator for the carbon intensity calculation, because removing price in the formula can reduce the shift away from cheap stocks. The investor could also select a more-relevant benchmark, such as a value index, for the 30% or 50% carbon reduction target. Doing so could help style managers and investors remain authentic to their investment objective, while working to address their concerns about global warming.
When considering climate investing, investors should be conscious of how their social responsibility objective can impact their portfolio’s investment performance, while also being conscious of how meeting their investment performance target can impact their carbon reduction goal. Only through a detailed analysis of how best to balance the two goals, followed by a thoughtful portfolio construction process, can investors set realistic carbon reduction and investment goals to reach their preferred balance between “doing good” and “doing well.”
Appendix: Empirical Parameters
Our analysis includes large and mid-sized companies in the developed markets over the six-year period 2016–2021 for which we observe more than a 90% overlapping market value between our equity universe and the carbon emissions data. We use greenhouse gas emissions data for the companies in our study provided by Institutional Shareholder Services (ISS), which collects publicly available self-reported GHG emissions data and supplements it with analysts’ reviews and estimations. ISS follows a year-end (December 31) reporting cycle. We lag the annual ISS dataset by three months and merge it with the investable equity universe defined as the top 86% of market value of each country.
We use carbon footprint to measure a company’s carbon emissions. Following the GHG Protocol, we define this metric as the sum of direct emissions (Scope 1) and indirect emissions (Scope 2) derived from purchased energy carriers. To account for the fact that larger companies produce more GHG than smaller companies, we calculate a company’s carbon intensity, defined as the company’s direct and indirect GHG emissions scaled by the size of its business.
Two methods are commonly used to scale carbon emissions. The first is total revenues generated, adopted by a primary climate risk-assessing agency and an investment benchmark administrator.8 The second method is enterprise value including cash (EVIC), which was proposed by the EU TEG. The Technical Expert Group (TEG, 2019) provides guidelines for the EU in designing investment benchmarks.9
Endnotes
- We provide a full explanation of our analysis and findings in Chow and Li (2022).
- Brightman et al. (2022) examine the two carbon emissions scalars of revenues and EVIC to determine if one is a better measure for investors to use. They find the two methods are largely equivalent and both are acceptable for investment purposes as long as companies are compared with their region and sector peers.
- We examine the dependency of carbon on factor characteristics in our data sample by testing the level and change of carbon intensity as dependent variables on market capitalization, composite valuation ratio, and prior one-year return skipping one month, as representing the characteristics of the size, value, and momentum factors, respectively.
- We provide details of how the portfolio weights are scaled in Chow and Li (2022).
- The initial carbon requirement for the CTB benchmark is 70% of universe average. It shrinks to below 50% of universe average after five years of annual 7% reduction (70% * (1 – 7%)5 = 49%). The initial PAB requirement is stringent, but it can be met through exclusions of fossil fuel and electricity producers with high GHG emissions, which is not recommended for CTB benchmarks.
- Li et al. (2019) present a framework to estimate transaction costs of managing systematic rebalancing strategies with the characteristics of the strategy. According to their model, transaction costs increase with turnover rate and weight tilt and decrease with the aggregated volume of the selected stocks.
- In this paper we use an overly naïve value strategy. For reference, the transaction costs of managing $10B of a commercially available concentrated value strategy in the developed markets is 0.27%, according to Li et al. (2019).
- https://www.spglobal.com/spdji/en/documents/additional-material/faq-trucost.pdf
https://www.spglobal.com/spdji/en/documents/additional-material/spdji-esg-carbon-metrics.pdf - EU TEG anticipates reviewing its guidelines every three years. The latest available guidelines are dated September 30, 2019.
References
Brightman, Chris, Vitali Kalesnik, Ari Polychronopoulos, and Joseph Shim. 2022. “Carbon Intensity for Climate Mitigation: Clearing Up ‘Scaling’ Confusion.” Research Affiliates Publications (July).
Chow, Tzee-man, and Feifei Li. 2022. “No Good Deed Goes Unpunished? Social vs. Investment Objectives.” (May 25). Available on SSRN.
Li, Feifei, Tzee-Man Chow, Alex Pickard, and Yadwinder Garg. 2019.
“Transaction Costs of Factor-Investing Strategies.” Financial Analysts Journal, vol. 75, no. 2:62–78.
TEG. 2019. TEG Final Report on Climate Benchmarks and Benchmarks’ ESG Disclosures. EU Technical Expert Group on Sustainable Finance Technical Report (September). Available at https://ec.europa.eu/.

