
A portfolio’s return is driven by its investment strategy—a set of decisions that governs allocation and timing of capital among the portfolio’s positions. Modest exclusions designed to align a broadly diversified portfolio with an investor’s ESG principles do not change the underlying investment strategy and therefore are not responsible for driving the portfolio’s return.
ESG investing is a preference, not a strategy. We view this trait as a benefit to investors, who can align their portfolios’ composition with their beliefs without experiencing a meaningful impact on performance.
Because ESG is a preference, not a strategy, investors can incorporate their ESG principles within a wide range of investment strategies, including non-cap-weighted indices. Today, the RAFI ESG strategy allows investors to invest according to their ESG principles and still maintain a valuation discount relative to the market at a time when value appears attractively priced.
Reality television programming exists in a myriad of settings. Shows focus on a broad range of topics from home renovation, car restoration, gold mining, deep sea fishing, to even selecting a potential spouse from a group of strangers. A reality show likely already exists in any scenario you can imagine. The one constant among them, however, is that they all follow the same strategy: the participants face some sort of adversity. At times this adversity is life-threatening, but more often it simply takes the form of interpersonal crisis embellished with dramatic tension and occasionally with comedy. The various iterations simply exist to meet audience preferences.
We see a similar situation in the investment industry.
We believe the term ESG strategy is generally a mischaracterization. While some managers use ESG measures to identify risks and opportunities, more often ESG metrics merely reflect investor preferences incorporated in an existing strategy.1 An investment strategy represents a decision, or set of decisions, that guide a portfolio’s risk-and-return profile over time. The underlying investment process drives the return of the chosen investment strategy; the ESG preferences reflected in the securities selected for the portfolio do not. We make this distinction not to disparage ESG investing—we actually view this trait as a benefit. We like the ability to align our portfolios’ composition with our beliefs without a meaningful impact on performance.
Create your free account or log in to keep reading.
Register or Log in
Making Our Case: Preference, Not Strategy
Let’s take, for example, an actively managed equity portfolio that favors companies with low valuations, strong financial health, and decent price momentum. This investment strategy, when applied across various industries, sectors, and countries, will perform similarly relative to a market portfolio with or without incorporating ESG preferences. Assuming we select and size positions in a consistent manner, a portfolio that leans toward value, quality, and momentum will tend to exhibit strong relative performance when companies that exhibit those characteristics perform well across exposures. The portfolio’s performance will follow the performance of its characteristics regardless of whether the opportunity set is small-cap retailers in the United States, renewable energy providers in Europe, or a global portfolio for which every publicly traded company is eligible.
Often ESG metrics merely reflect investor preferences incorporated in an existing strategy.
”To demonstrate the lack of impact ESG preferences have on performance, let’s examine the five largest index-based ESG products (ETFs or mutual funds) by AUM available in the US market as of December 31, 2021.2 The comparison of these five largest ESG investment vehicles to a non-ESG cap-weighted benchmark reveals essentially no differences among the portfolios because the five products each weight their holdings by market capitalization. Thus, incorporating ESG metrics has virtually no impact on the portfolios.
The following table lists the top ten holdings for six portfolios: the five largest ESG vehicles and a cap-weighted benchmark. We intentionally omit labels. Can you tell which vehicle is the non-ESG portfolio? Johnson & Johnson, Berkshire Hathaway, and PayPal are the only companies that are unique to individual portfolios. Every other company is included in two or more strategies.
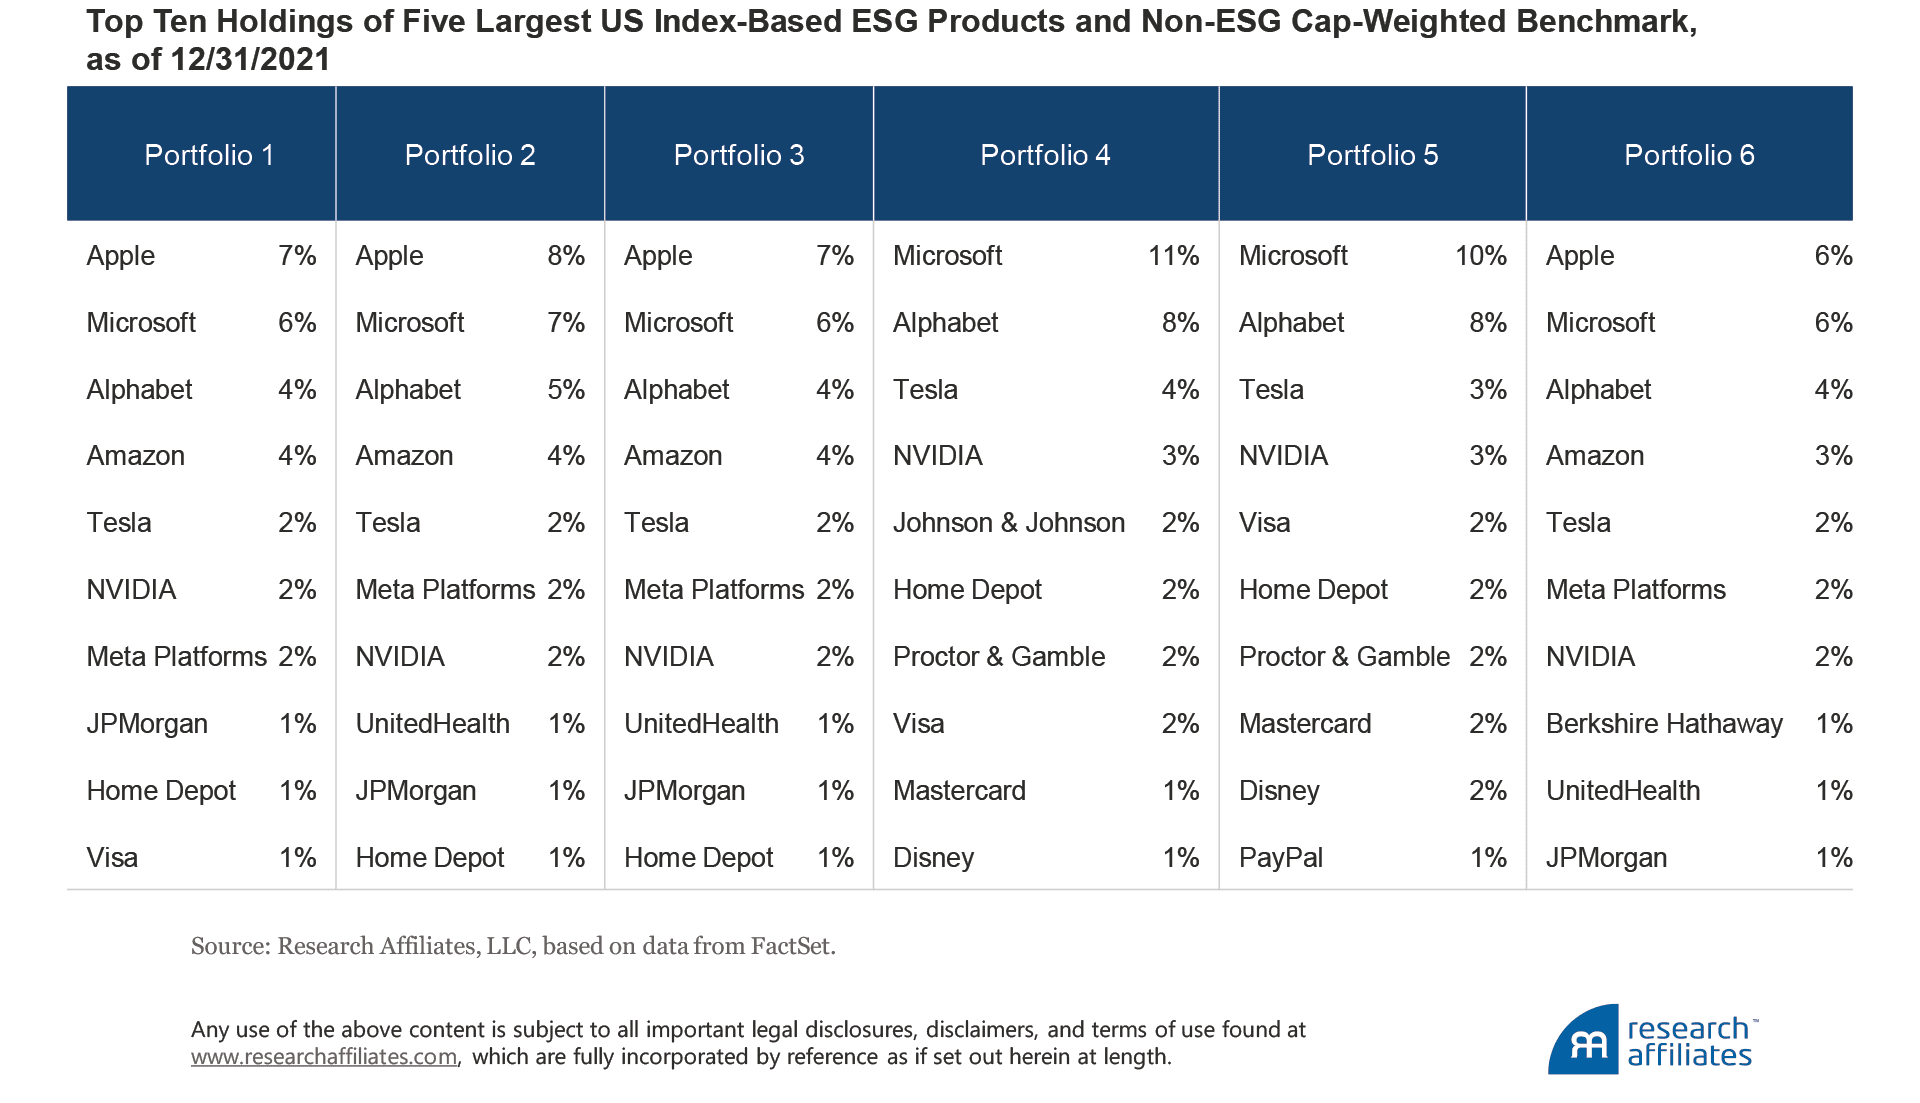
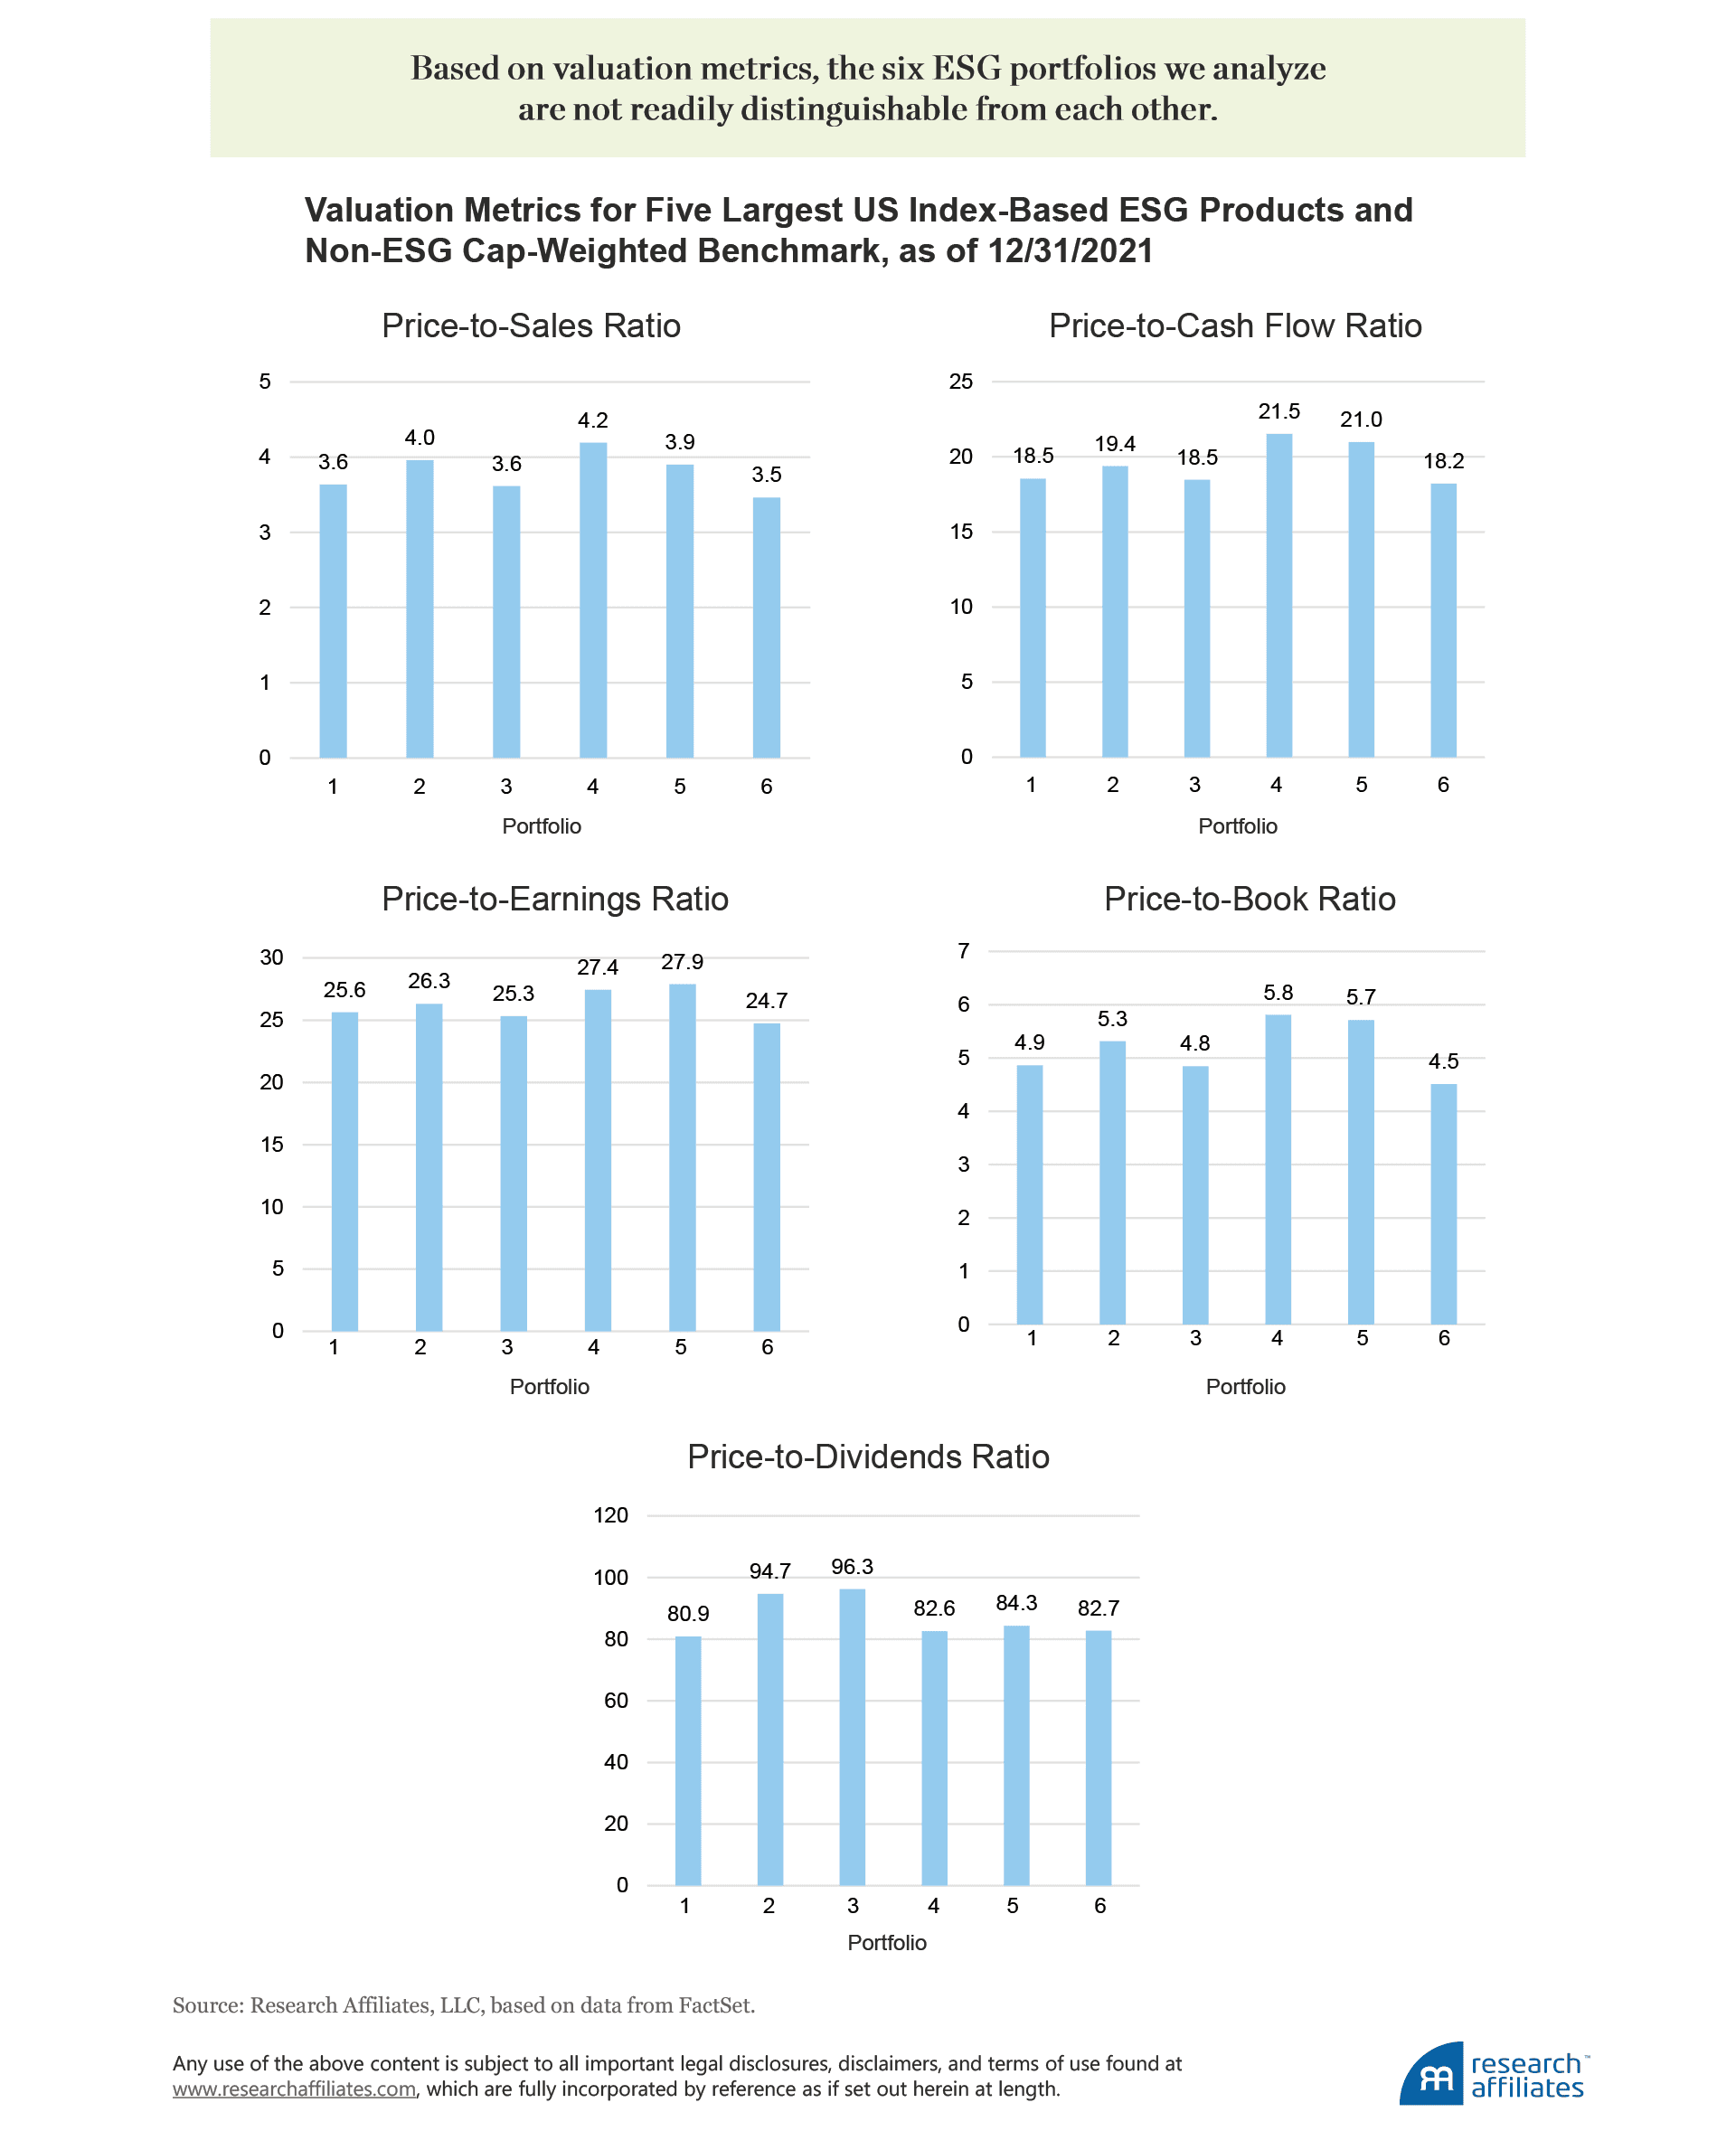
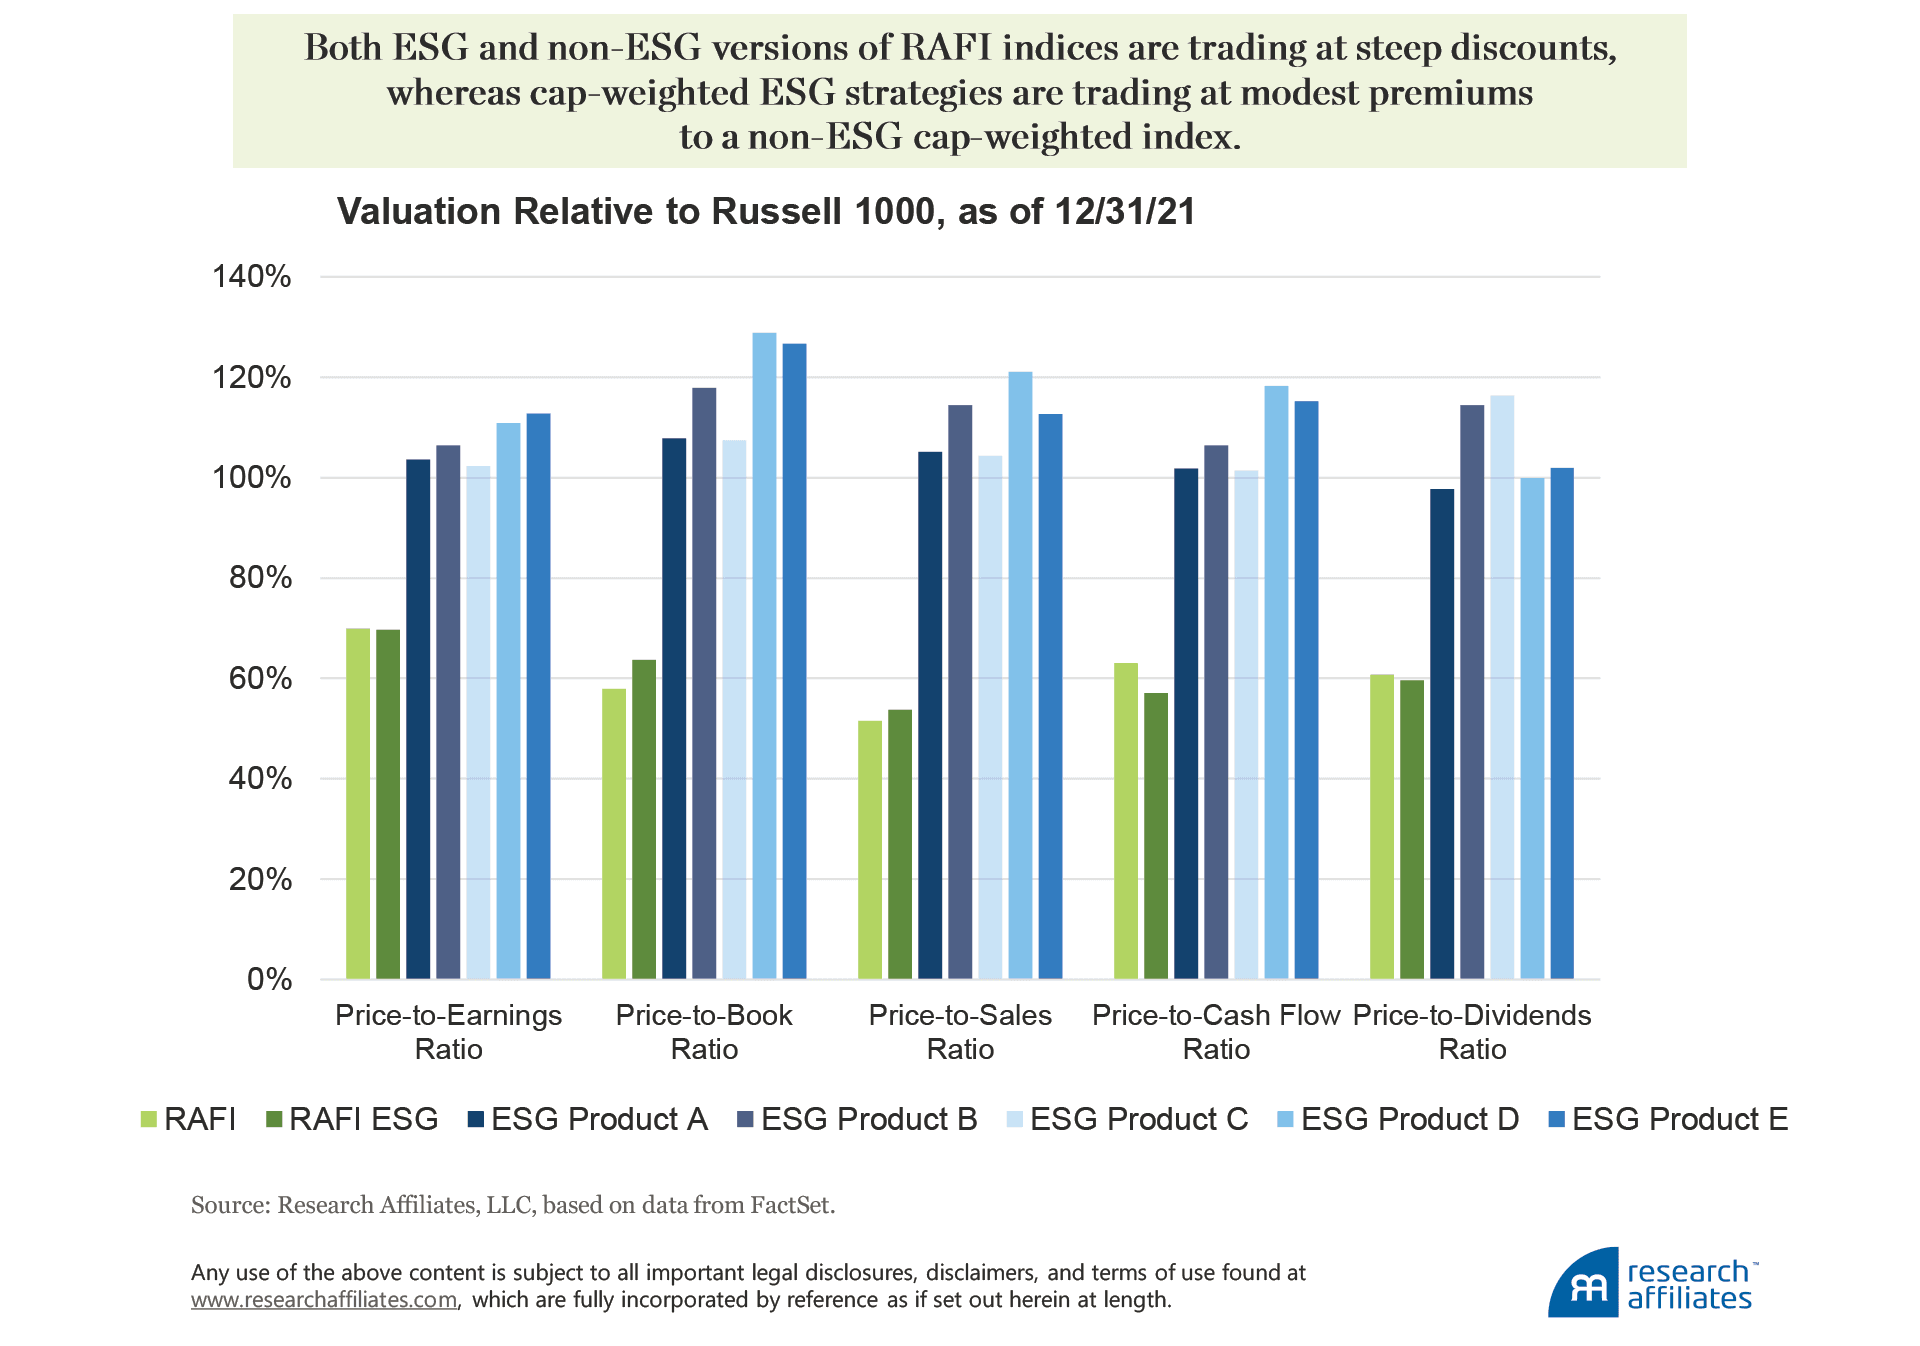
We consider just the top 10 holdings of the six portfolios, each of which holds hundreds of positions. An analysis of the portfolios’ valuations should offer a better comparison of the portfolios. Our regular readers know we do not like to rely on a single valuation ratio. We prefer to look at multiple metrics and thus we compare the portfolios using the following ratios: price to sales (P/S), price to cash flow (P/CF), price to earnings (P/E), price to book (P/B), and price to dividends (P/D).
We like the ability to align our portfolios’ composition with our beliefs without a meaningful impact on performance.
”
Does the non-ESG portfolio stand out yet?
Based on valuation metrics, again all six portfolios appear quite similar. The range of values for each of the five metrics is quite narrow; for example, P/E ranges from 24.7 to 27.9 and P/B ranges from 4.5 to 5.8. Thus, both holdings and valuation characteristics show a lack of differentiation. Next, let’s compare the portfolios based on performance. (And yes, we recognize you already know what this comparison is going to show.)
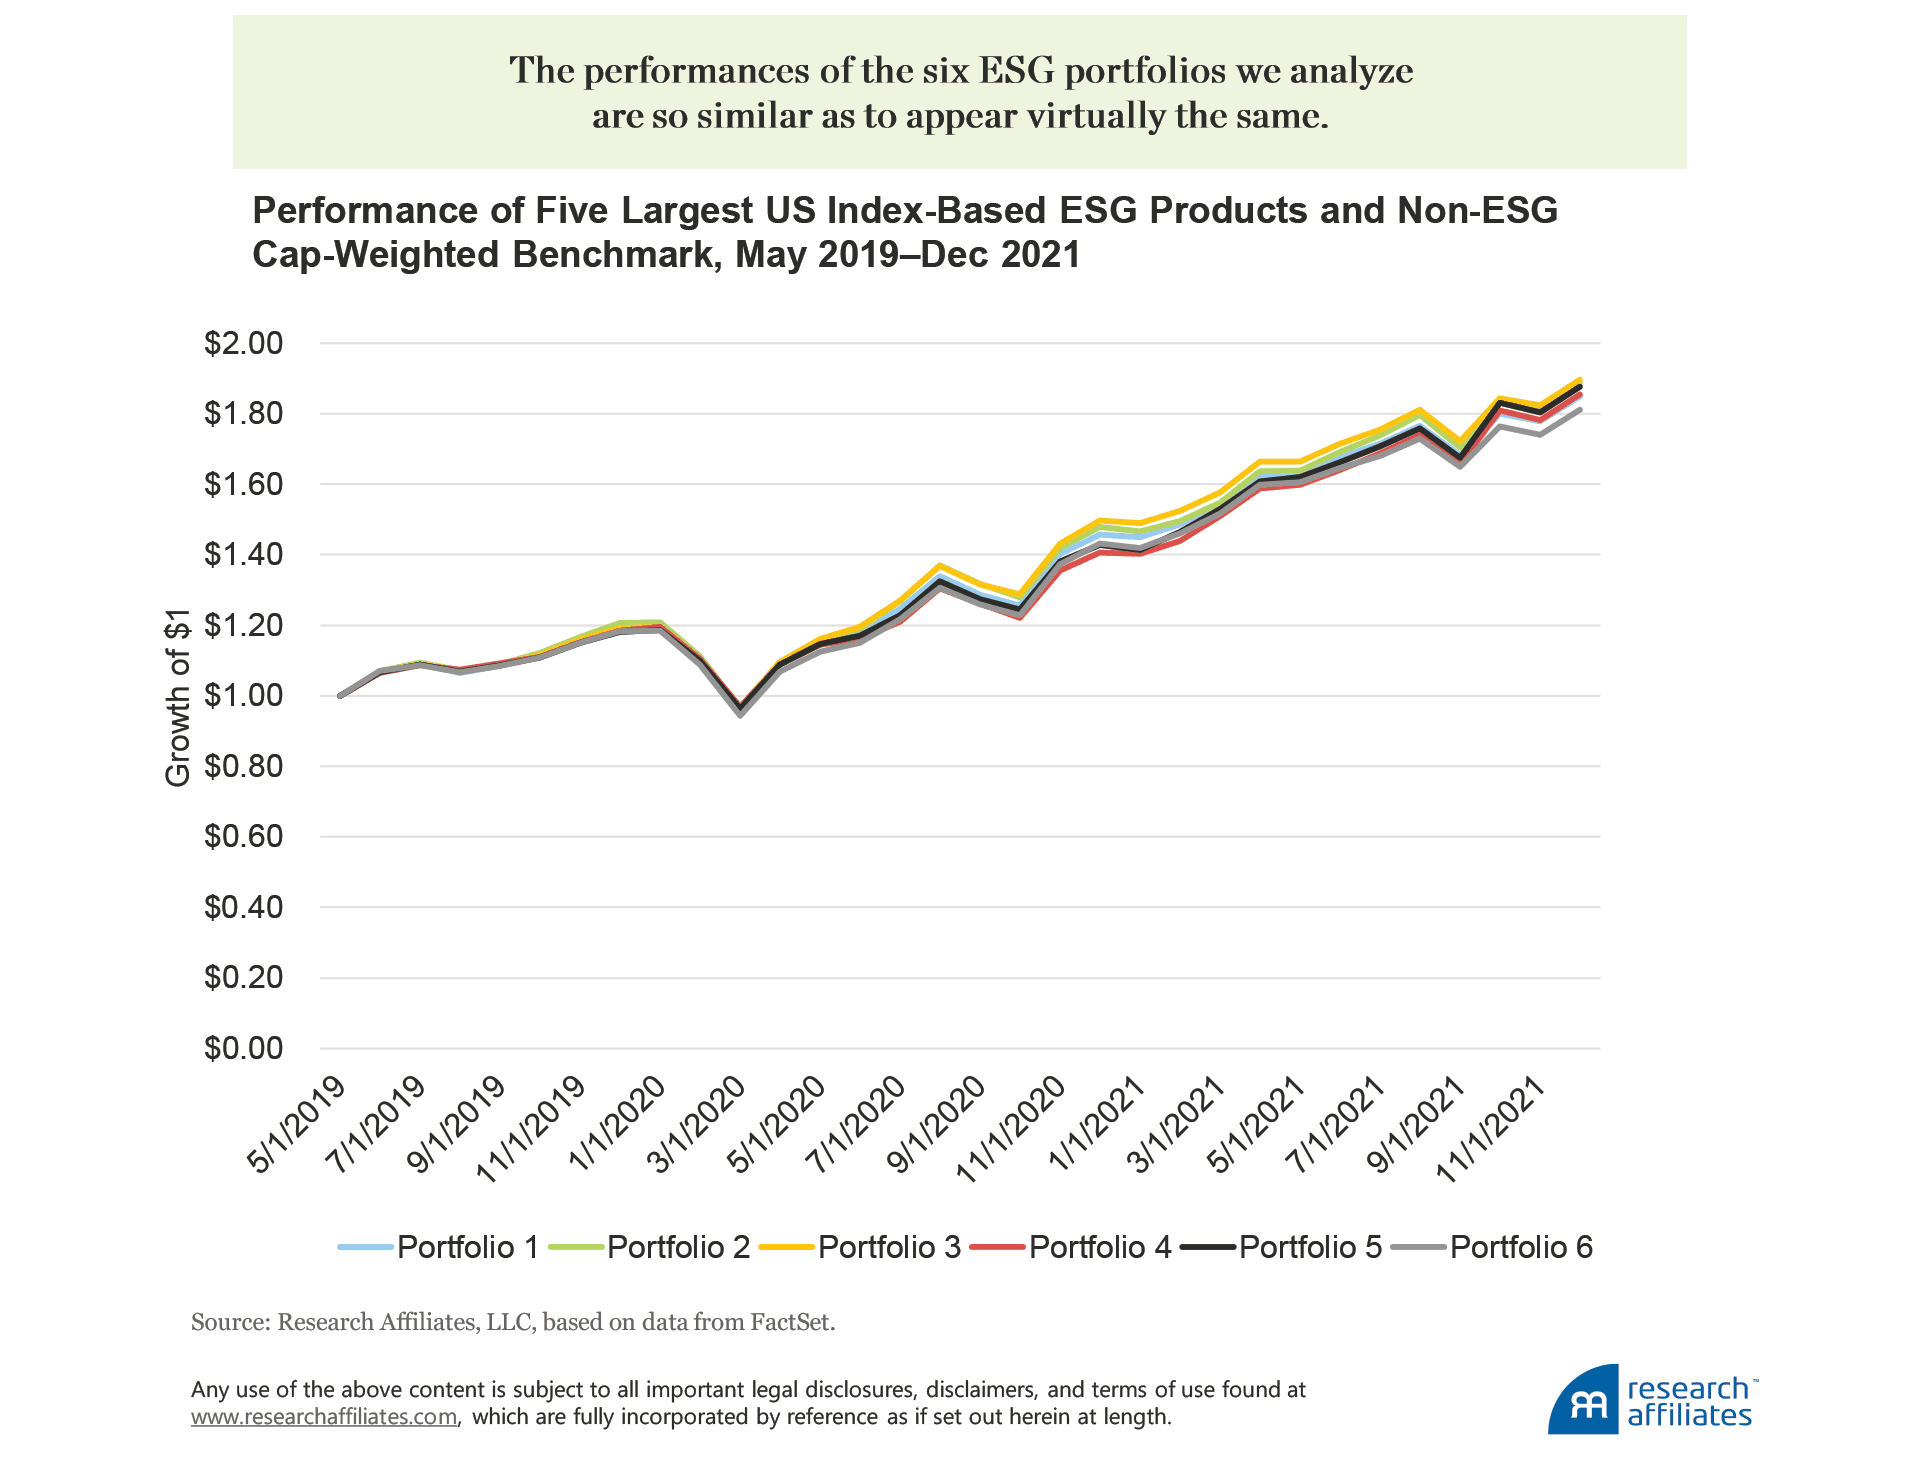
We show performance beginning in May 2019 because some of the ETFs are relatively new, however, the tight correlation between the various portfolios' returns would persist if we included simulated results for the indices the products track. Even though the graph contains six separate return series, it appears as a single line because the nearly identical returns blend together.
Therefore, let us reiterate our point: the similarities—in holdings, valuation, and performance—among these five cap-weighted ESG investment vehicles and a non-ESG cap-weighted index (in this case, the non-ESG index is the Russell 1000, which was the sixth portfolio in each exhibit) is not a bad thing. Products such as these provide great solutions for investors who want exposure to a cap-weighted portfolio that aligns with their ESG preferences.
Wary of a Growth-Dominated Cap-Weighted Strategy? Read On
Of course, just as our regular readers know that we prefer multiple measures when valuing firms, so too they know we prefer an alternative to cap-weighted indices, especially when the valuation dispersion between cheap and expensive companies is as historically wide as it is today. Arnott et al. (2021) show that value investing is not broken. Value stocks have merely become far cheaper than they normally are relative to growth stocks. The elevated discount for value stocks exists both within and outside the US market.
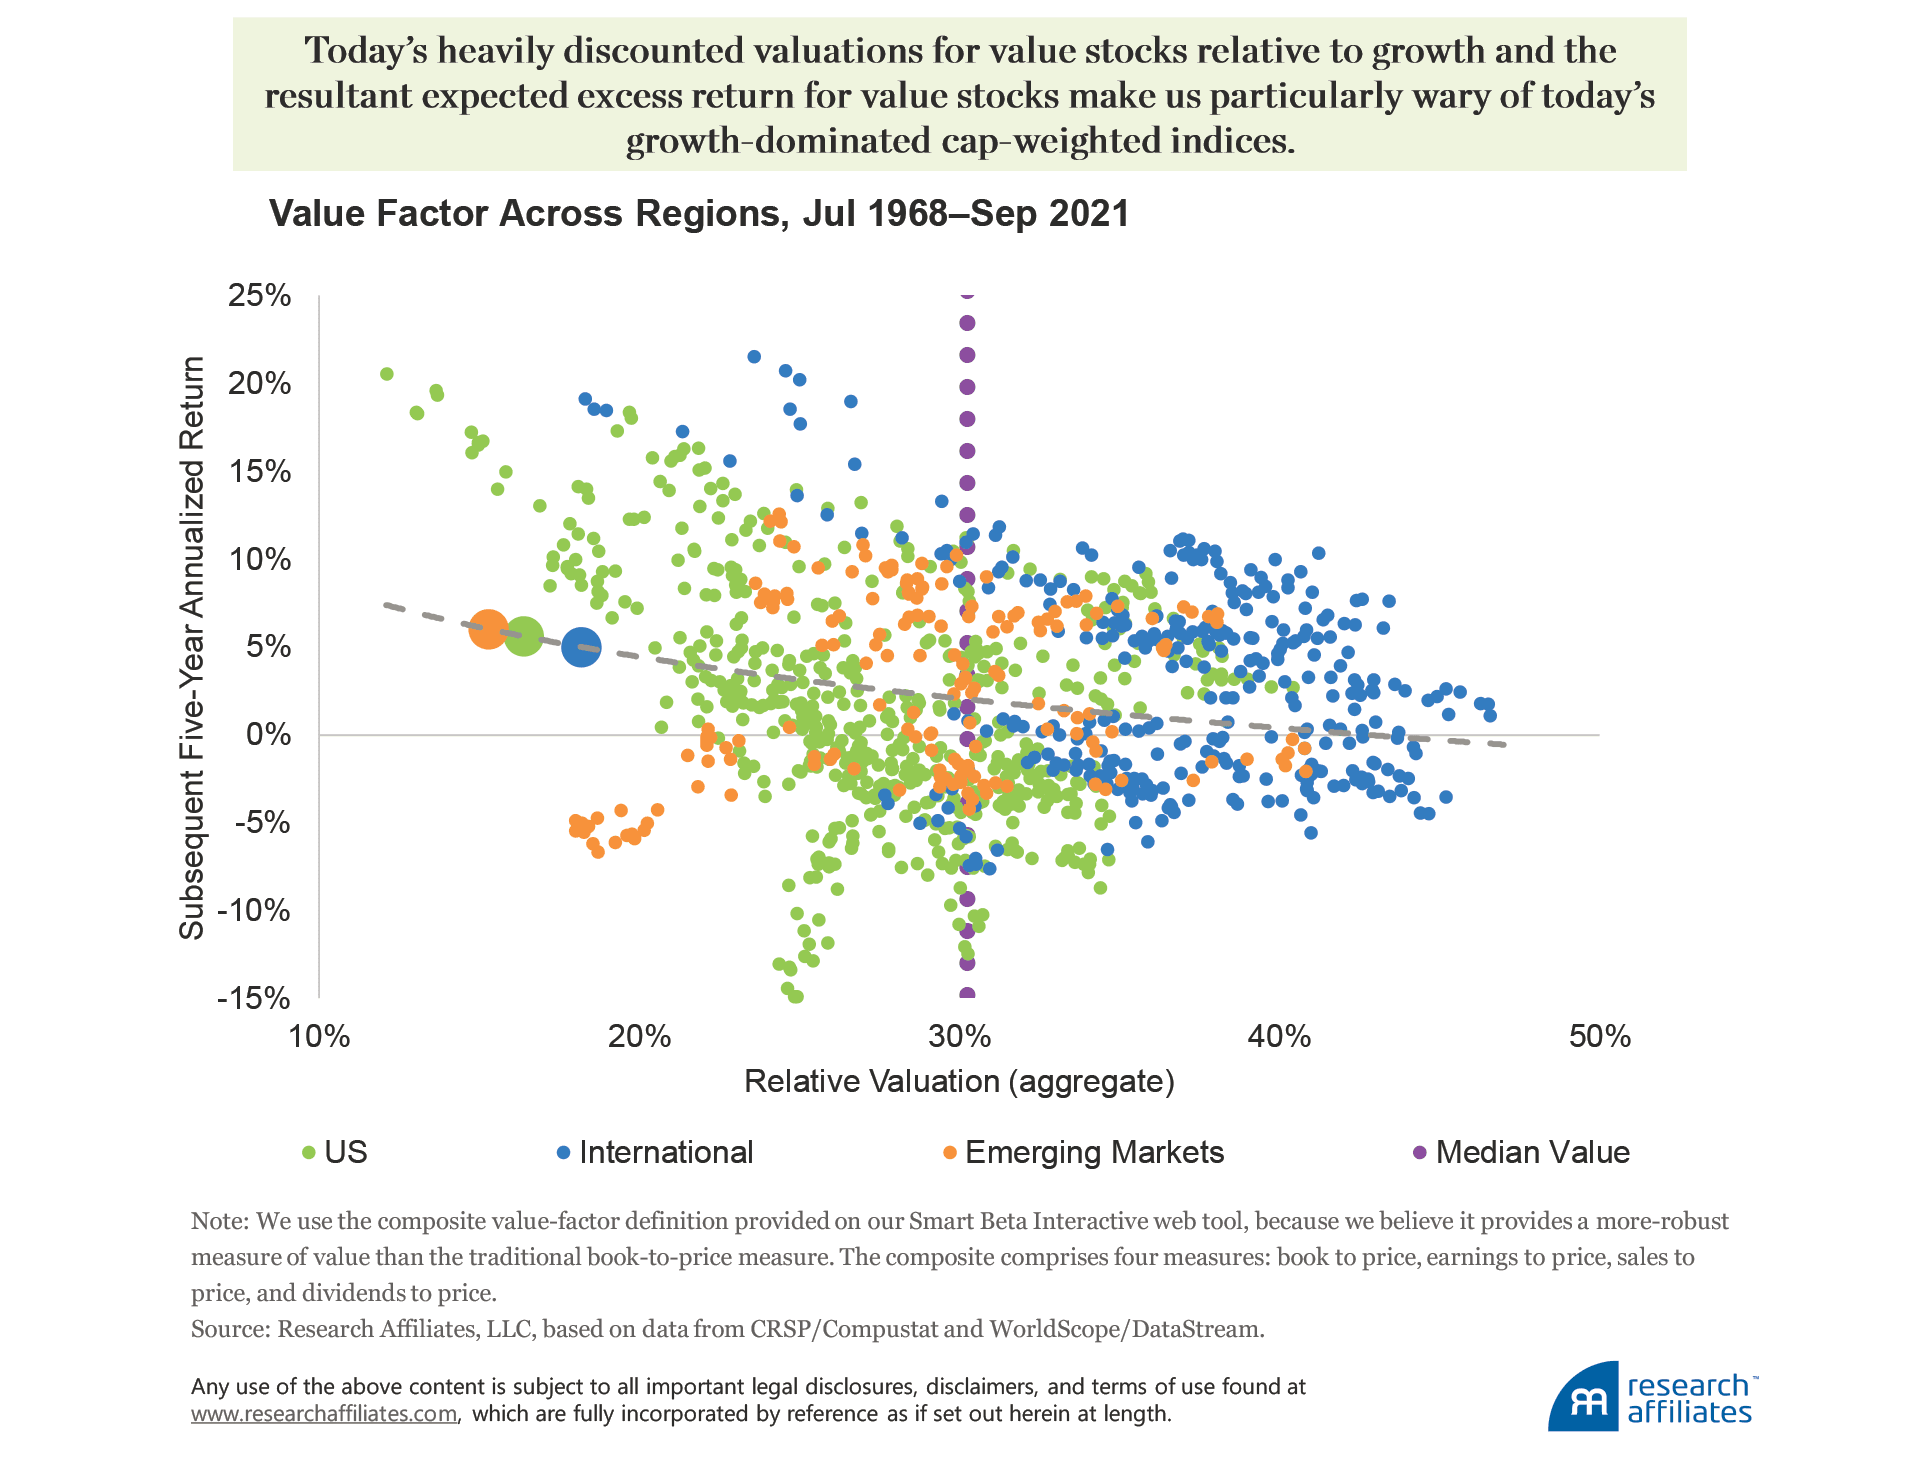
The horizontal axis in the preceding figure notes the valuation of value stocks relative to growth stocks in the US, developed ex US, and emerging markets. As we would expect, value stocks are always cheaper than growth stocks, but the degree to which value stocks are cheaper varies considerably over time. The median relative valuation of value stocks to growth stocks over the period July 1968 through September 2021 is roughly 30% when measured by an average of the following four metrics: P/S, P/E, P/B, and P/D.
As of September 30, 2021, the valuations for the value factor were 16% in the US, 18% in developed ex US, and 15% in emerging markets. The vertical axis in the preceding figure notes the subsequent five-year annualized excess return that a value strategy has generated relative to a growth strategy from each starting point used in the analysis. Whereas we observe dispersion around the line of best fit, we also see a discernable pattern in which the slope of the line indicates a relationship between starting valuation and subsequent return. Lower starting valuations translate to better performance for value strategies relative to growth strategies.
Today’s heavily discounted valuations for value stocks relative to growth stocks, and the resultant expected excess return for value stocks, make us particularly wary of today’s growth-dominated cap-weighted indices. Fortunately, investors can apply ESG preferences to any investment strategy. ESG-minded investors who are concerned with growth stocks’ high valuations can simply opt for a non-cap-weighted ESG strategy.
Structuring a Non-Cap-Weighted ESG Strategy
The RAFI™ index strategy offers one alternative to a cap-weighted index. By selecting and weighting companies based on fundamental measures of size—sales, cash flow, dividends plus buybacks, and book value plus intangibles—the RAFI approach represents a contrarian portfolio that rebalances out of the very mega-cap growth companies that currently dominate cap-weighted indices due to their significant price appreciation. When multiple dispersion between growth and value stocks is low, market-cap and RAFI indices will appear quite similar. As the market’s willingness to pay a premium for growth increases, the difference between cap-weighted and RAFI indices will also grow. RAFI indices exhibit a dynamic value exposure regardless of whether they incorporate an ESG methodology.
Cap-weighted ESG strategies are currently trading at a modest premium to a non-ESG cap-weighted index, whereas both ESG and non-ESG versions of RAFI indices are trading at steep discounts. Based on the five valuation ratios we used earlier, as of September 30, 2021, the five largest US cap-weighted ESG products were trading at an average 10.2% premium to the Russell 1000. In contrast, the RAFI ESG US Index was trading at an average discount of 39.2% to the Russell 1000, virtually the same as the 39.3% discount of the RAFI US Index.
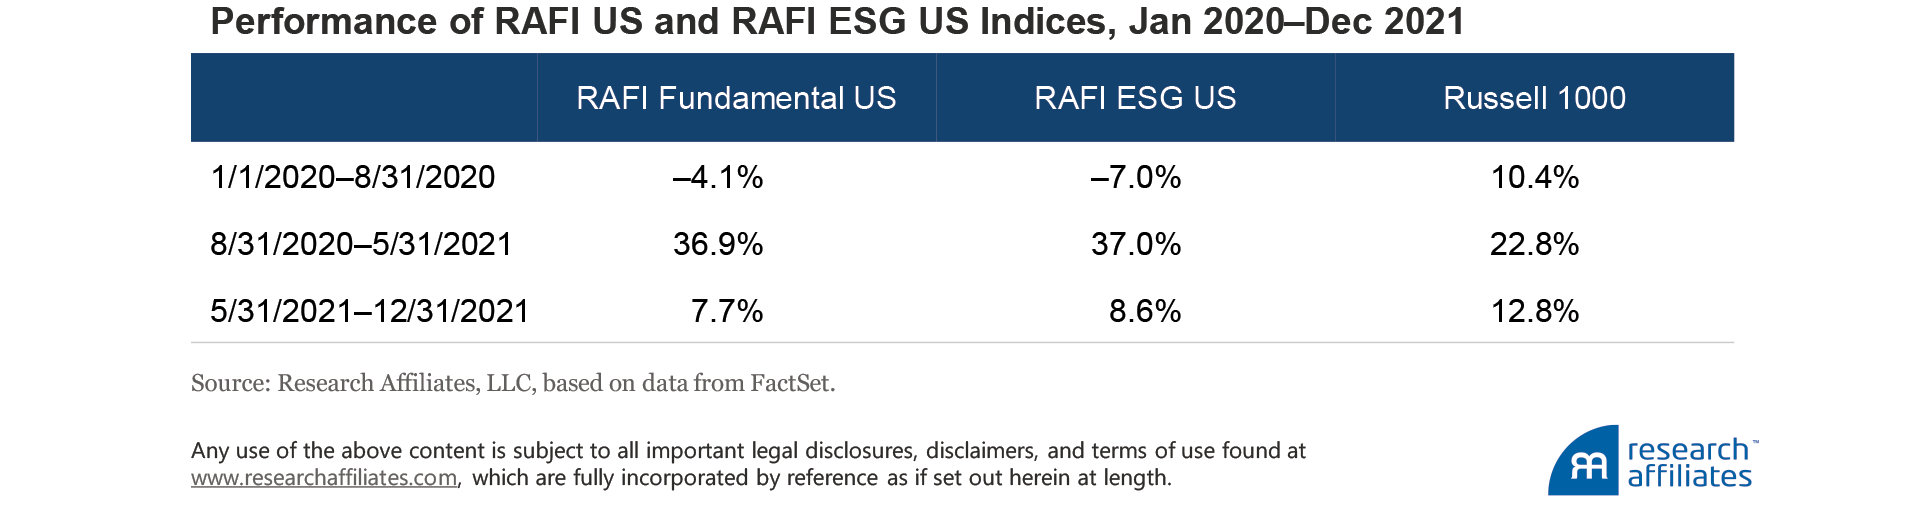
Likewise, both ESG and non-ESG versions of the RAFI strategy have exhibited similar return patterns versus the Russell 1000, particularly since the beginning of 2020. A collapse in the prices of value companies brought on by the Covid pandemic marked the first eight months of 2020. Over the next nine months, from the end of August 2020 through the end of May 2021, value stocks rallied considerably on reopening hopes. The value rally then cooled from June through December 2021. Both versions of the RAFI strategy faced performance headwinds when value was under pressure, and both outpaced the cap-weighted index when value rebounded.
Not only does the RAFI ESG Index3 have a similar valuation discount and performance to the RAFI US Index, it achieves this without sacrificing in terms of ESG characteristics. The RAFI ESG Index provides a reduction in carbon footprint close to that of the five largest US cap-weighted ESG products we analyze. The RAFI ESG Index has a carbon intensity of 70 tons CO2 equivalent/Revenue in US$MM. The five largest US cap-weighted ESG products have an average score of 71 in the same metric. The carbon intensity scores of all six ESG investment vehicles are well below the score of the Russell 1000 cap-weighted index, which has a carbon intensity score of 125.
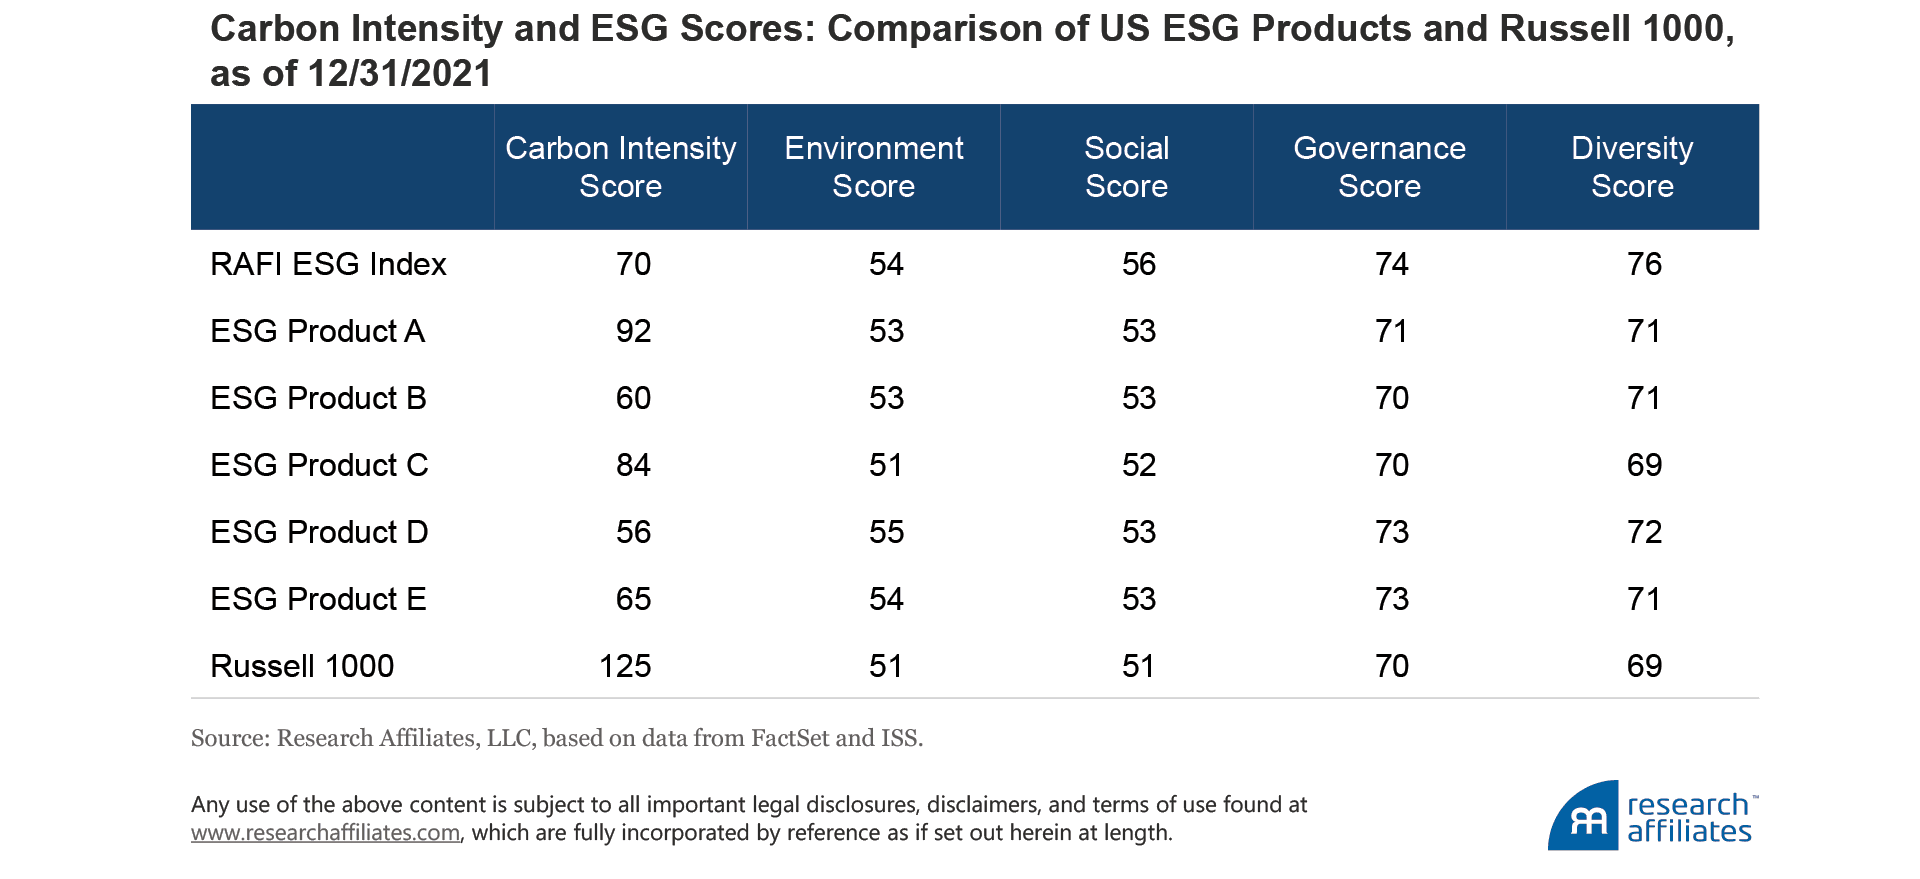
In addition to reducing carbon intensity, the RAFI ESG Index goes beyond many of the popular strategies, which rely largely on exclusions of firms with poor ESG scores and specific companies that belong to controversial industries. The RAFI ESG Index excludes any company that ranks poorly across any of five different groups of ESG metrics: environmental, social, governance, financial discipline, and diversity. Further, the RAFI ESG strategy incorporates a firm’s ESG score in its index weight.
Recall the lists of the top ten holdings of the five largest US ESG products at the beginning of this article. The holdings lists provide an example of how the RAFI ESG Index’s more stringent ESG methodology differentiates it from other portfolios. Alphabet (Google) is a top holding in all five of those ESG products. Meta Platforms (Facebook) is a top holding in four of the products. RAFI ESG includes neither firm because both fail our social and governance screens.4,5
Alternatives to ESG Cap-Weighted Strategies Can Offer Benefits
While seemingly ubiquitous, reality TV shows are not the only programming available. Viewers who are uninterested in reality TV shows yet who are attracted to drama and humor in a home renovation setting on the “big screen” can watch the severely underrated Money Pit and fans of reality show competitions (in this case best-in-class dog shows) have the option of Best in Show.
Likewise, cap-weighting is not the only form of indexing available to ESG investors. Those investors who want to incorporate their ESG preferences in their portfolios can opt for alternative forms of indexing, such as the fundamentally weighted RAFI strategies. The RAFI ESG strategy allows investors to invest according to their ESG principles and still maintain a valuation discount relative to the market at a time when value appears attractively priced.
The RAFI ESG strategy allows investors to invest according to their ESG principles and still maintain a valuation discount relative to the market at a time when value appears attractively priced.
”Please read our disclosures concurrent with this publication: https://www.researchaffiliates.com/legal/disclosures#investment-adviser-disclosure-and-disclaimers.


Endnotes
- Lively debate is ongoing regarding the efficacy of not just active management, but whether incorporating ESG provides a robust source of return (West and Polychronopoulos, 2020).
- The names of the five largest index-based ESG products that we use in our analysis are available upon request.
- The RAFI ESG Index strategy is currently provided in three regions: US, Developed, and Developed EUR Hedged (Net).
- The RAFI ESG Index series ranks companies by individual ISS social or governance score in the starting index universe and then excludes companies that rank in the bottom 10% by cumulative fundamental weight.
- To name a few recent controversies for Alphabet and Facebook: Alphabet was fined €100M in December 2020 for violating the French Data Protection Act for automatically placing tracking cookies on users’ computers without prior consent, and was fined $170M by the FTC for violating the US Children’s Online Privacy Protection Act. Facebook has long faced consumer complaints regarding data privacy and security and failing to moderate online content. On the governance side, both firms have long been criticized for the fact that company founders (Larry Page and Sergey Brin at Alphabet and Mark Zuckerberg at Facebook) own the majority of the firm’s voting stock (Source: ISS).
References
Arnott, Rob, Campbell Harvey, Vitali Kalesnik, and Juhani Linnainmaa. 2021. “Reports of Value’s Death May Be Greatly Exaggerated.” Financial Analysts Journal, vol. 77, no. 1 (First Quarter):44–67.
West, John, and Ari Polychronopoulos. 2020. “Is ESG a Factor?” Research Affiliates Publications (July).
