
The RAFI™ Fundamental Index has a value tilt, but to characterize it as a value index would be an oversimplification that misses the important advantages that the fundamental index offers above standard “value” index approaches.
RAFI has produced consistent historical outperformance, and we continue to expect stronger excess returns for RAFI compared with standard value indexes, due to the structural nature of its alpha.
Companies with growing fundamentals not only contribute to a strategy's total return but also provide a foil against which to rebalance out of newly expensive names into cheaper alternatives.
RAFI is designed to reward growing companies with higher weights (not punish them for not fitting the conventional profile of a distressed value stock), and it systematically rebalances holdings against market sentiment, generating premium in the long run.
Data about fundamentals can be used to identify valuation characteristics, or it can be used to identify growth characteristics. We ask, “Why not both?” RAFI was designed to keep your growth and contra-trade too.
This article is a companion to the longer article Fundamental Growth on SSRN.
A cynic is a man who knows the price of everything and the value of nothing. So Oscar Wilde quipped 130 years ago in his play Lady Windermere’s Fan. If Wilde’s turn of phrase is true, today’s index investing ecosystem is full of cynics. To invest in an index, a portfolio manager must know only the price of all the stocks and ignore the true value of any of those companies. The invention of the RAFI™ Fundamental Index (RAFI) 20 years ago sought to turn this practice on its head by focusing on the economic value of companies, remaining agnostic as to their prices. The result was an approach with a stark value tilt, and since that time, RAFI has been associated with value investing.
Create your free account or log in to keep reading.
Register or Log in
Yet this characterization of RAFI is an oversimplification and misses the important advantages that the fundamental index offers above standard “value” index approaches.1 Indeed, using the US market as an example, RAFI has outperformed other popular value indexes through multiple cycles, as shown in Exhibit 1 below.
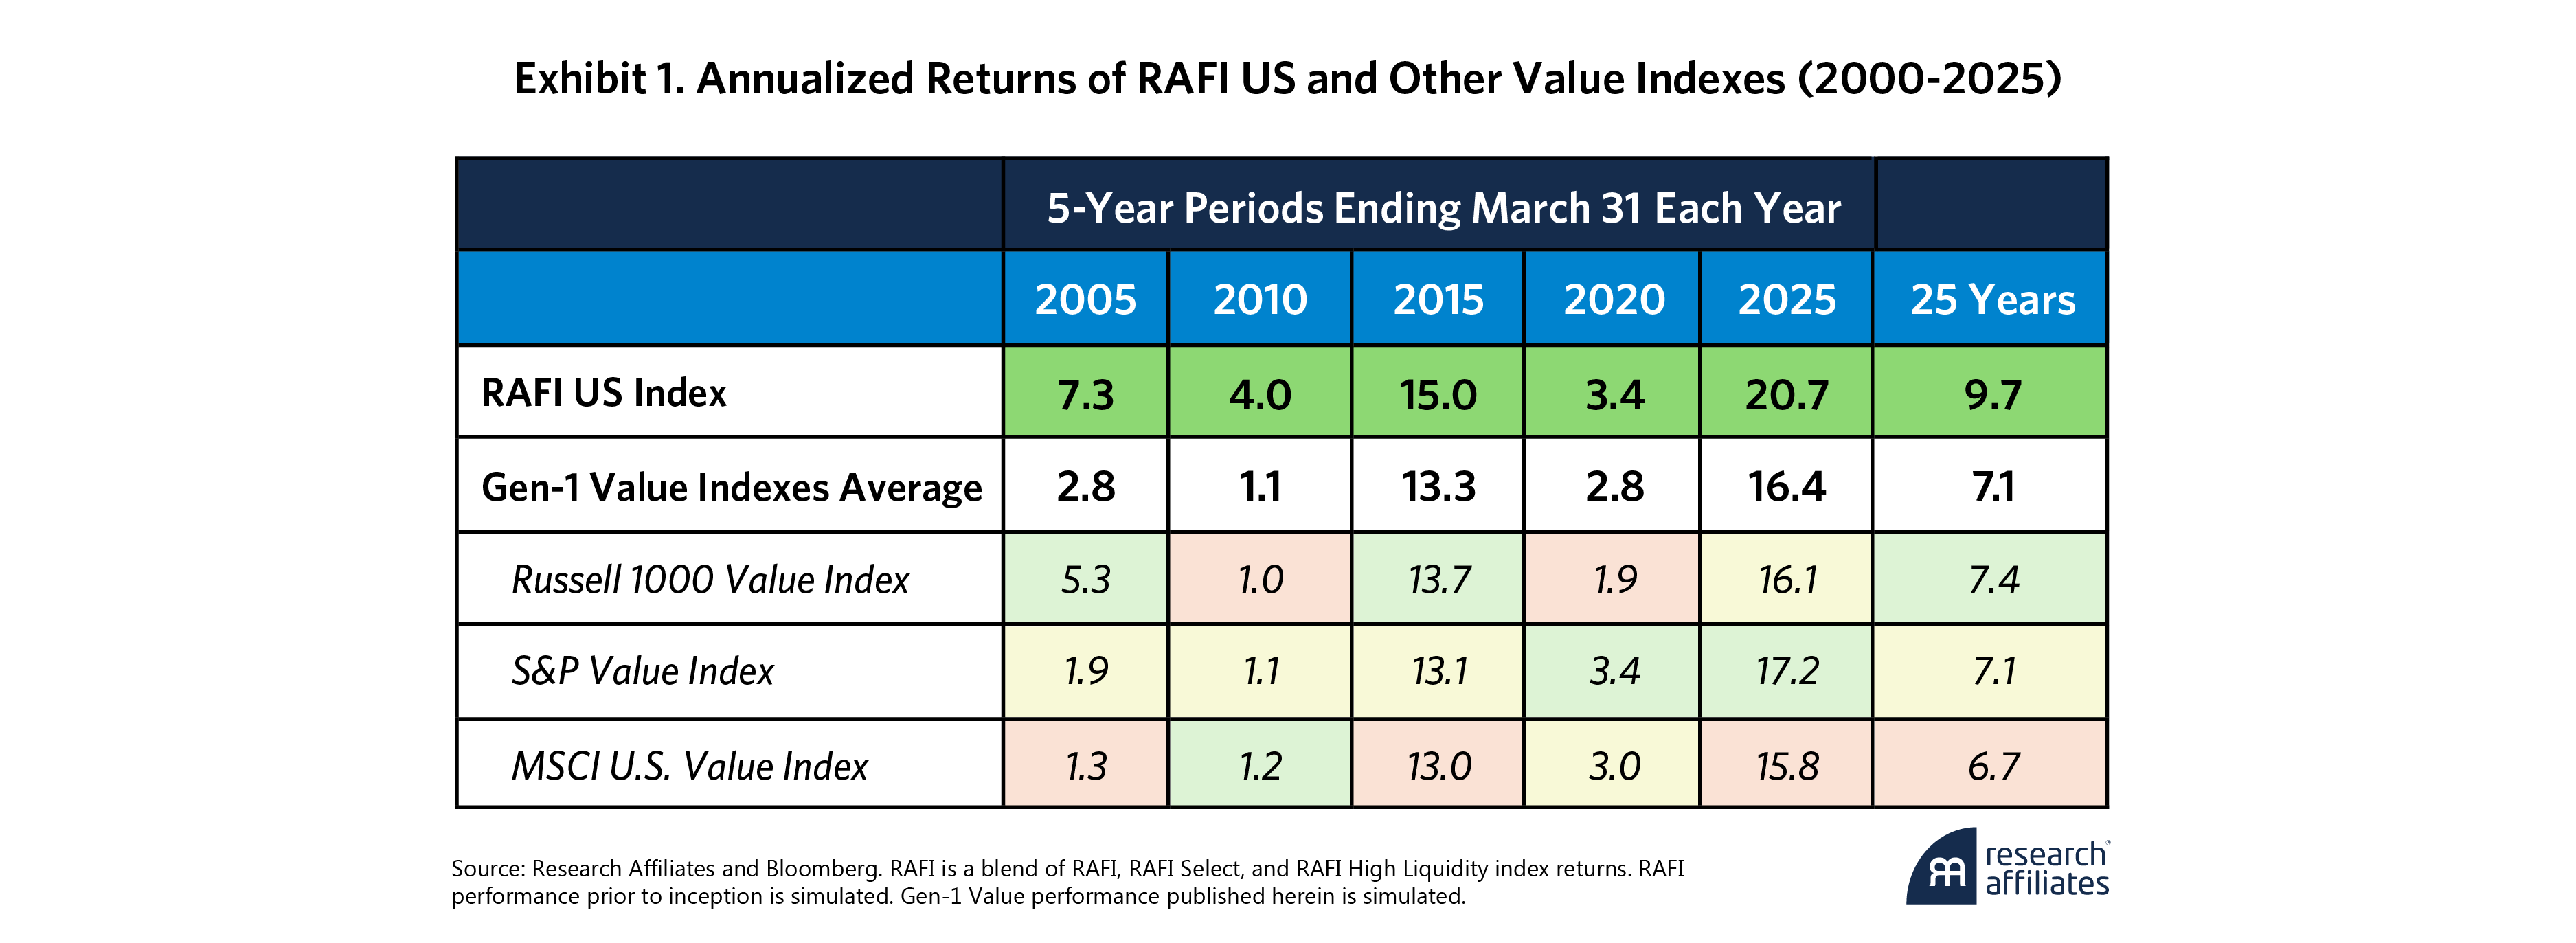
Despite this glaring historical outperformance, we continue to expect stronger excess returns for RAFI compared with standard value indexes (or Gen-1 Value). Readers who know us as the “mean reversion” investors may find this expectation confusing or surprising. However, a more careful examination of the drivers of RAFI’s historical outperformance will also reinforce why we expect this outperformance to persist.
Readers who know us as the ‘mean reversion’ investors may find this expectation [of RAFI’s continuing outperformance] confusing or surprising. However, a more careful examination of the drivers of RAFI’s historical outperformance will also reinforce why we expect this outperformance to persist.
”Excess returns can be decomposed into revaluation and structural components. Revaluation is the tendency of highly cheap (or expensive) assets to revert back toward a more normal valuation relative to the market. The second component—“structural alpha”—includes everything outside of revaluation, such as dividends, growth, and rebalancing effects. Historically, structural alpha is what has given RAFI its edge over Gen-1 Value indexes, and we expect it to continue doing so.
A Review of Structural Alpha
As noted above, rebalancing effects are just one component of structural alpha. A closer look reveals that growth is equally important and a synergistic contributor to rebalancing alpha. To understand the roles of growth and rebalancing, we review the fundamental components of investment returns.
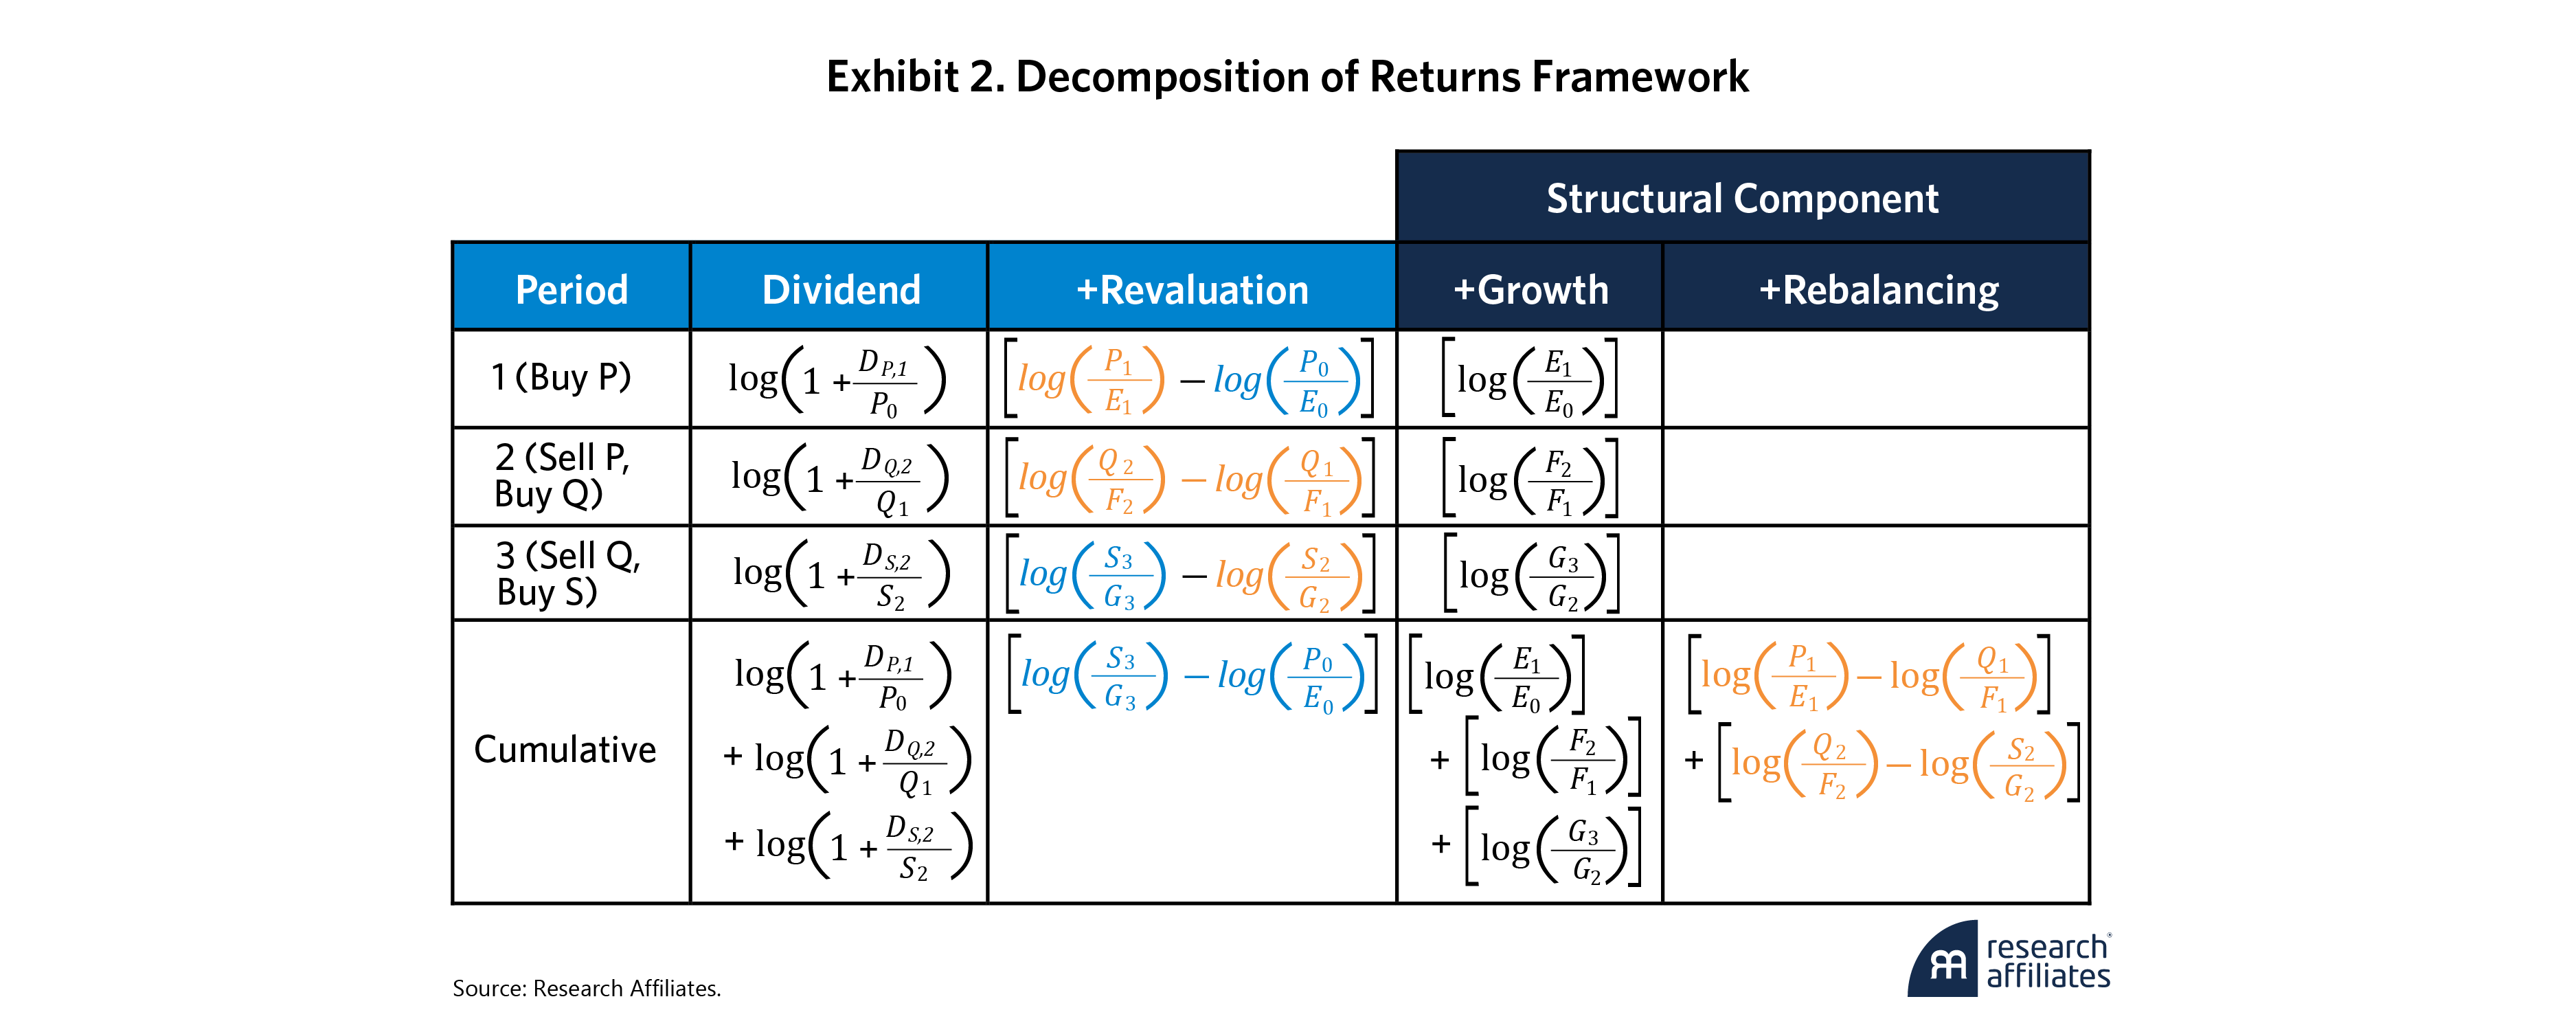
The return to a stock over a given period can be decomposed into the fundamental components of dividends received, earnings growth, and the change in valuation of those earnings (i.e., revaluation). For an un-rebalanced portfolio of many stocks, this simple decomposition holds. However, most portfolios, including indexes, eventually rebalance. Reflecting this dynamic, the decomposition of returns becomes a bit more complicated. To illustrate how this works, we consider a portfolio strategy that owns a single stock (P) in the first period and that is fully rebalanced into another stock (Q) in the second period and then into yet another stock (S) in the third period. These stocks have earnings denoted by E, F, and G. The return to each stock can be decomposed using the framework shown in Exhibit 2, and accordingly, the cumulative return over time results in a rebalancing effect.2
Whereas valuations, particularly relative valuations, tend to mean-revert over time, growth and rebalancing effects do not necessarily do so. As a result, we refer to the combination of growth and rebalancing as “structural alpha” because they can persist structurally through time.
Investors can easily grasp the desirability of higher dividends, higher growth, and higher revaluation to portfolio returns. Rebalancing is less well understood and is often overlooked. Rebalancing effects will be positive if the portfolio rebalances into less expensive holdings and will be negative if the portfolio trades into more expensive holdings. Value-oriented strategies, which sell expensive stocks to buy cheaper ones, tend to have a positive rebalancing return, while momentum-oriented strategies tend to have a negative rebalancing return. The potential for a larger rebalancing return contribution arises if the portfolio holds many stocks which re-value much higher than the market and is able to trim these holdings at high prices to buy others at much lower prices. The rebalancing return will be smaller if the portfolio holdings do not revalue against the market very much. In this case, the portfolio can still sell a few slightly expensive holdings to buy less expensive ones, but the benefit is more muted. In other words, for rebalancing to contribute meaningfully, the portfolio must hold some stocks that revalue significantly higher in between each rebalancing. Through this lens, the rebalancing return can be understood as the cumulation of realized revaluation effects over time.
Decomposing RAFI’s Alpha
Using the framework in Exhibit 2, we decompose the returns to RAFI and Gen-1 Value.3 In the return decomposition, the choice of valuation and growth fundamentals can vary but must remain internally consistent. For example, if the valuation metric is price to sales, the growth metric must be sales-per-share growth. The decomposition in Exhibit 3 shows the results using two different fundamentals: sales and earnings.
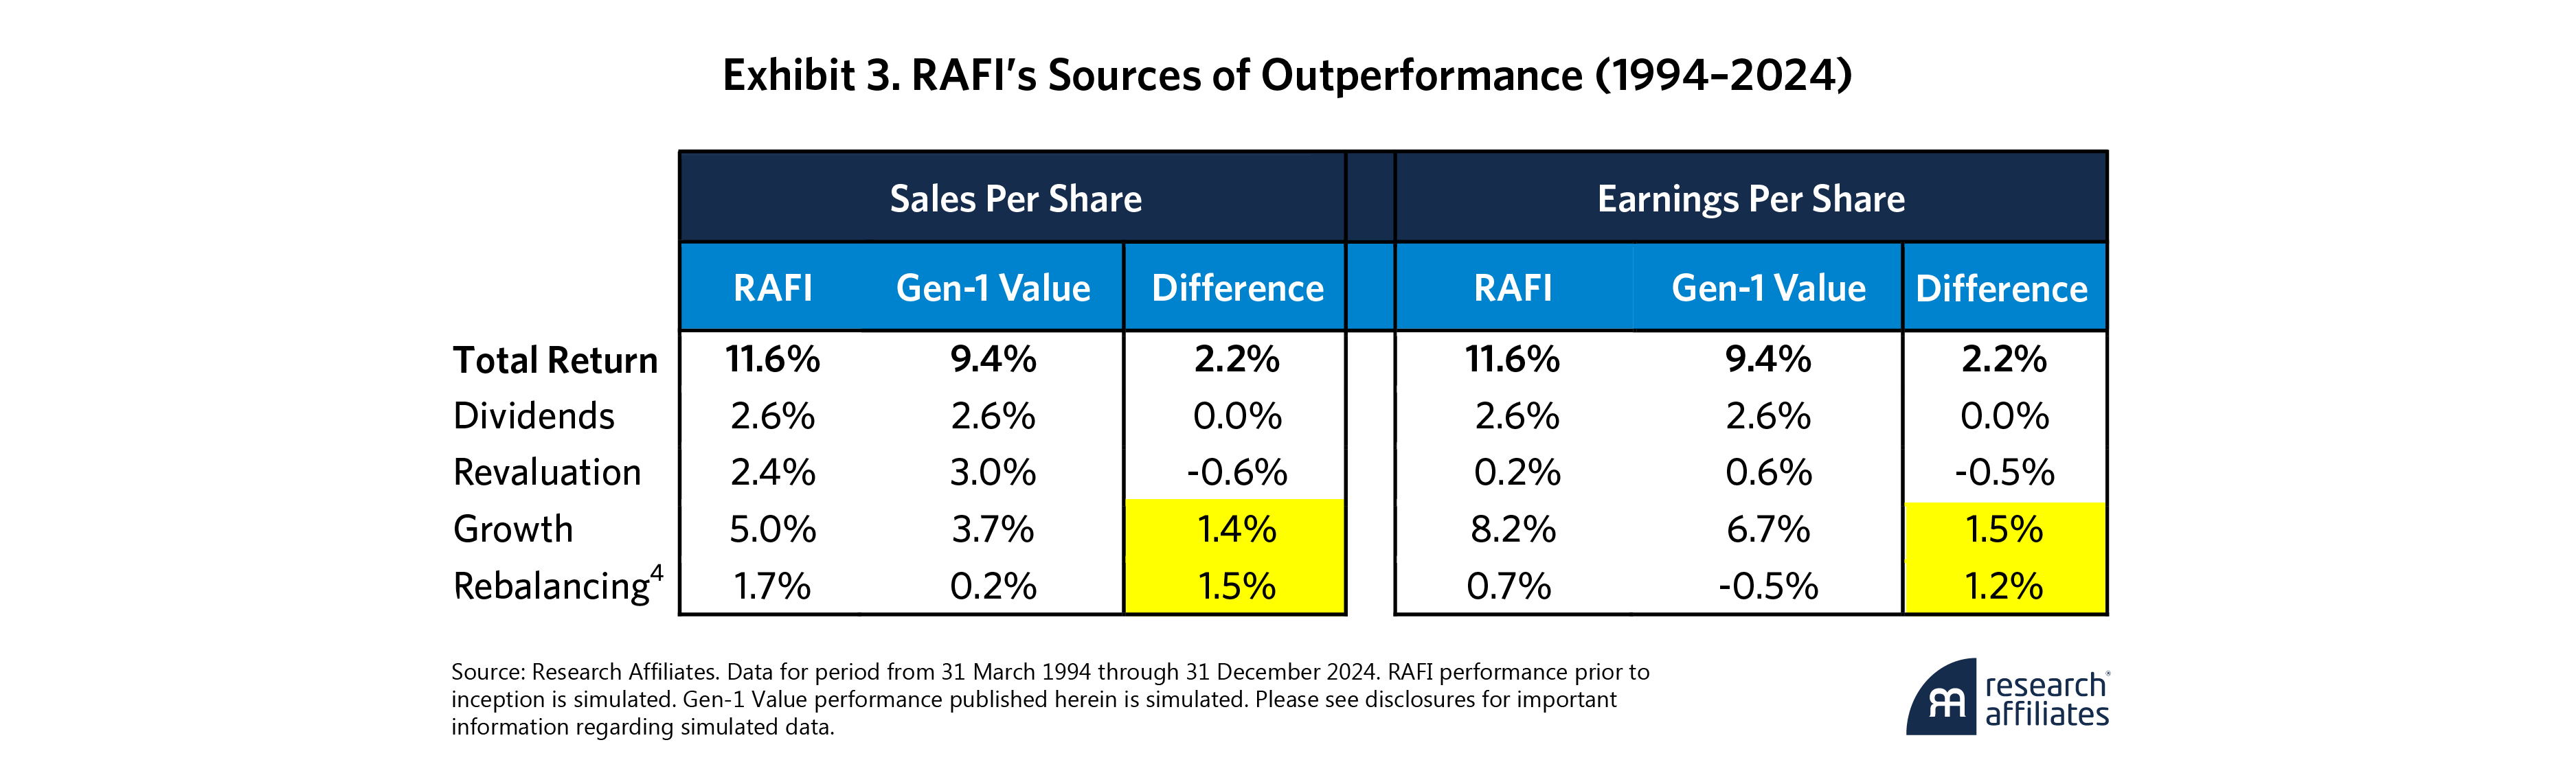
Both of these value indexes experienced similar dividend income, and both have become more expensive versus the underlying fundamentals over this period—to the tune of 2.4% and 3.0% respectively—commensurate with the rest of the US market over the past three decades. The primary source of the differing performance of these two value strategies comes down to growth and rebalancing alpha. Note that RAFI’s revaluation alpha is smaller than for Gen-1 Value. This means that the price/sales ratio or price/earnings ratio has risen by less than it has for Gen-1 Value, over the past 30 years. If the market decides that RAFI deserves valuation multiples that are the same relative to Gen-1 Value as in the past, this will add another half-percent to the already-remarkable value that RAFI has added relative to Gen-1 Value.
The substantial rebalancing return realized by RAFI is not surprising, given its value orientation and buy-low/sell-high discipline. The relatively small rebalancing return to Gen-1 Value is more surprising, given that it is also a value strategy. Recall, however, that the rebalancing alpha will tend to be smaller if the portfolio revalues by a smaller amount before each rebalancing or fails to buy inexpensive stocks to replace expensive ones. Because RAFI tends to have stronger growth fundamentals, it tends to have stronger revaluation in between each rebalancing, creating more opportunity for rebalancing alpha. In this way, growth and rebalancing effects, while seeming independent, can be reinforcing, and rebalancing needs growth to work.
RAFI tends to have stronger growth fundamentals, it tends to have stronger revaluation in between each rebalancing, creating more opportunity for rebalancing alpha.
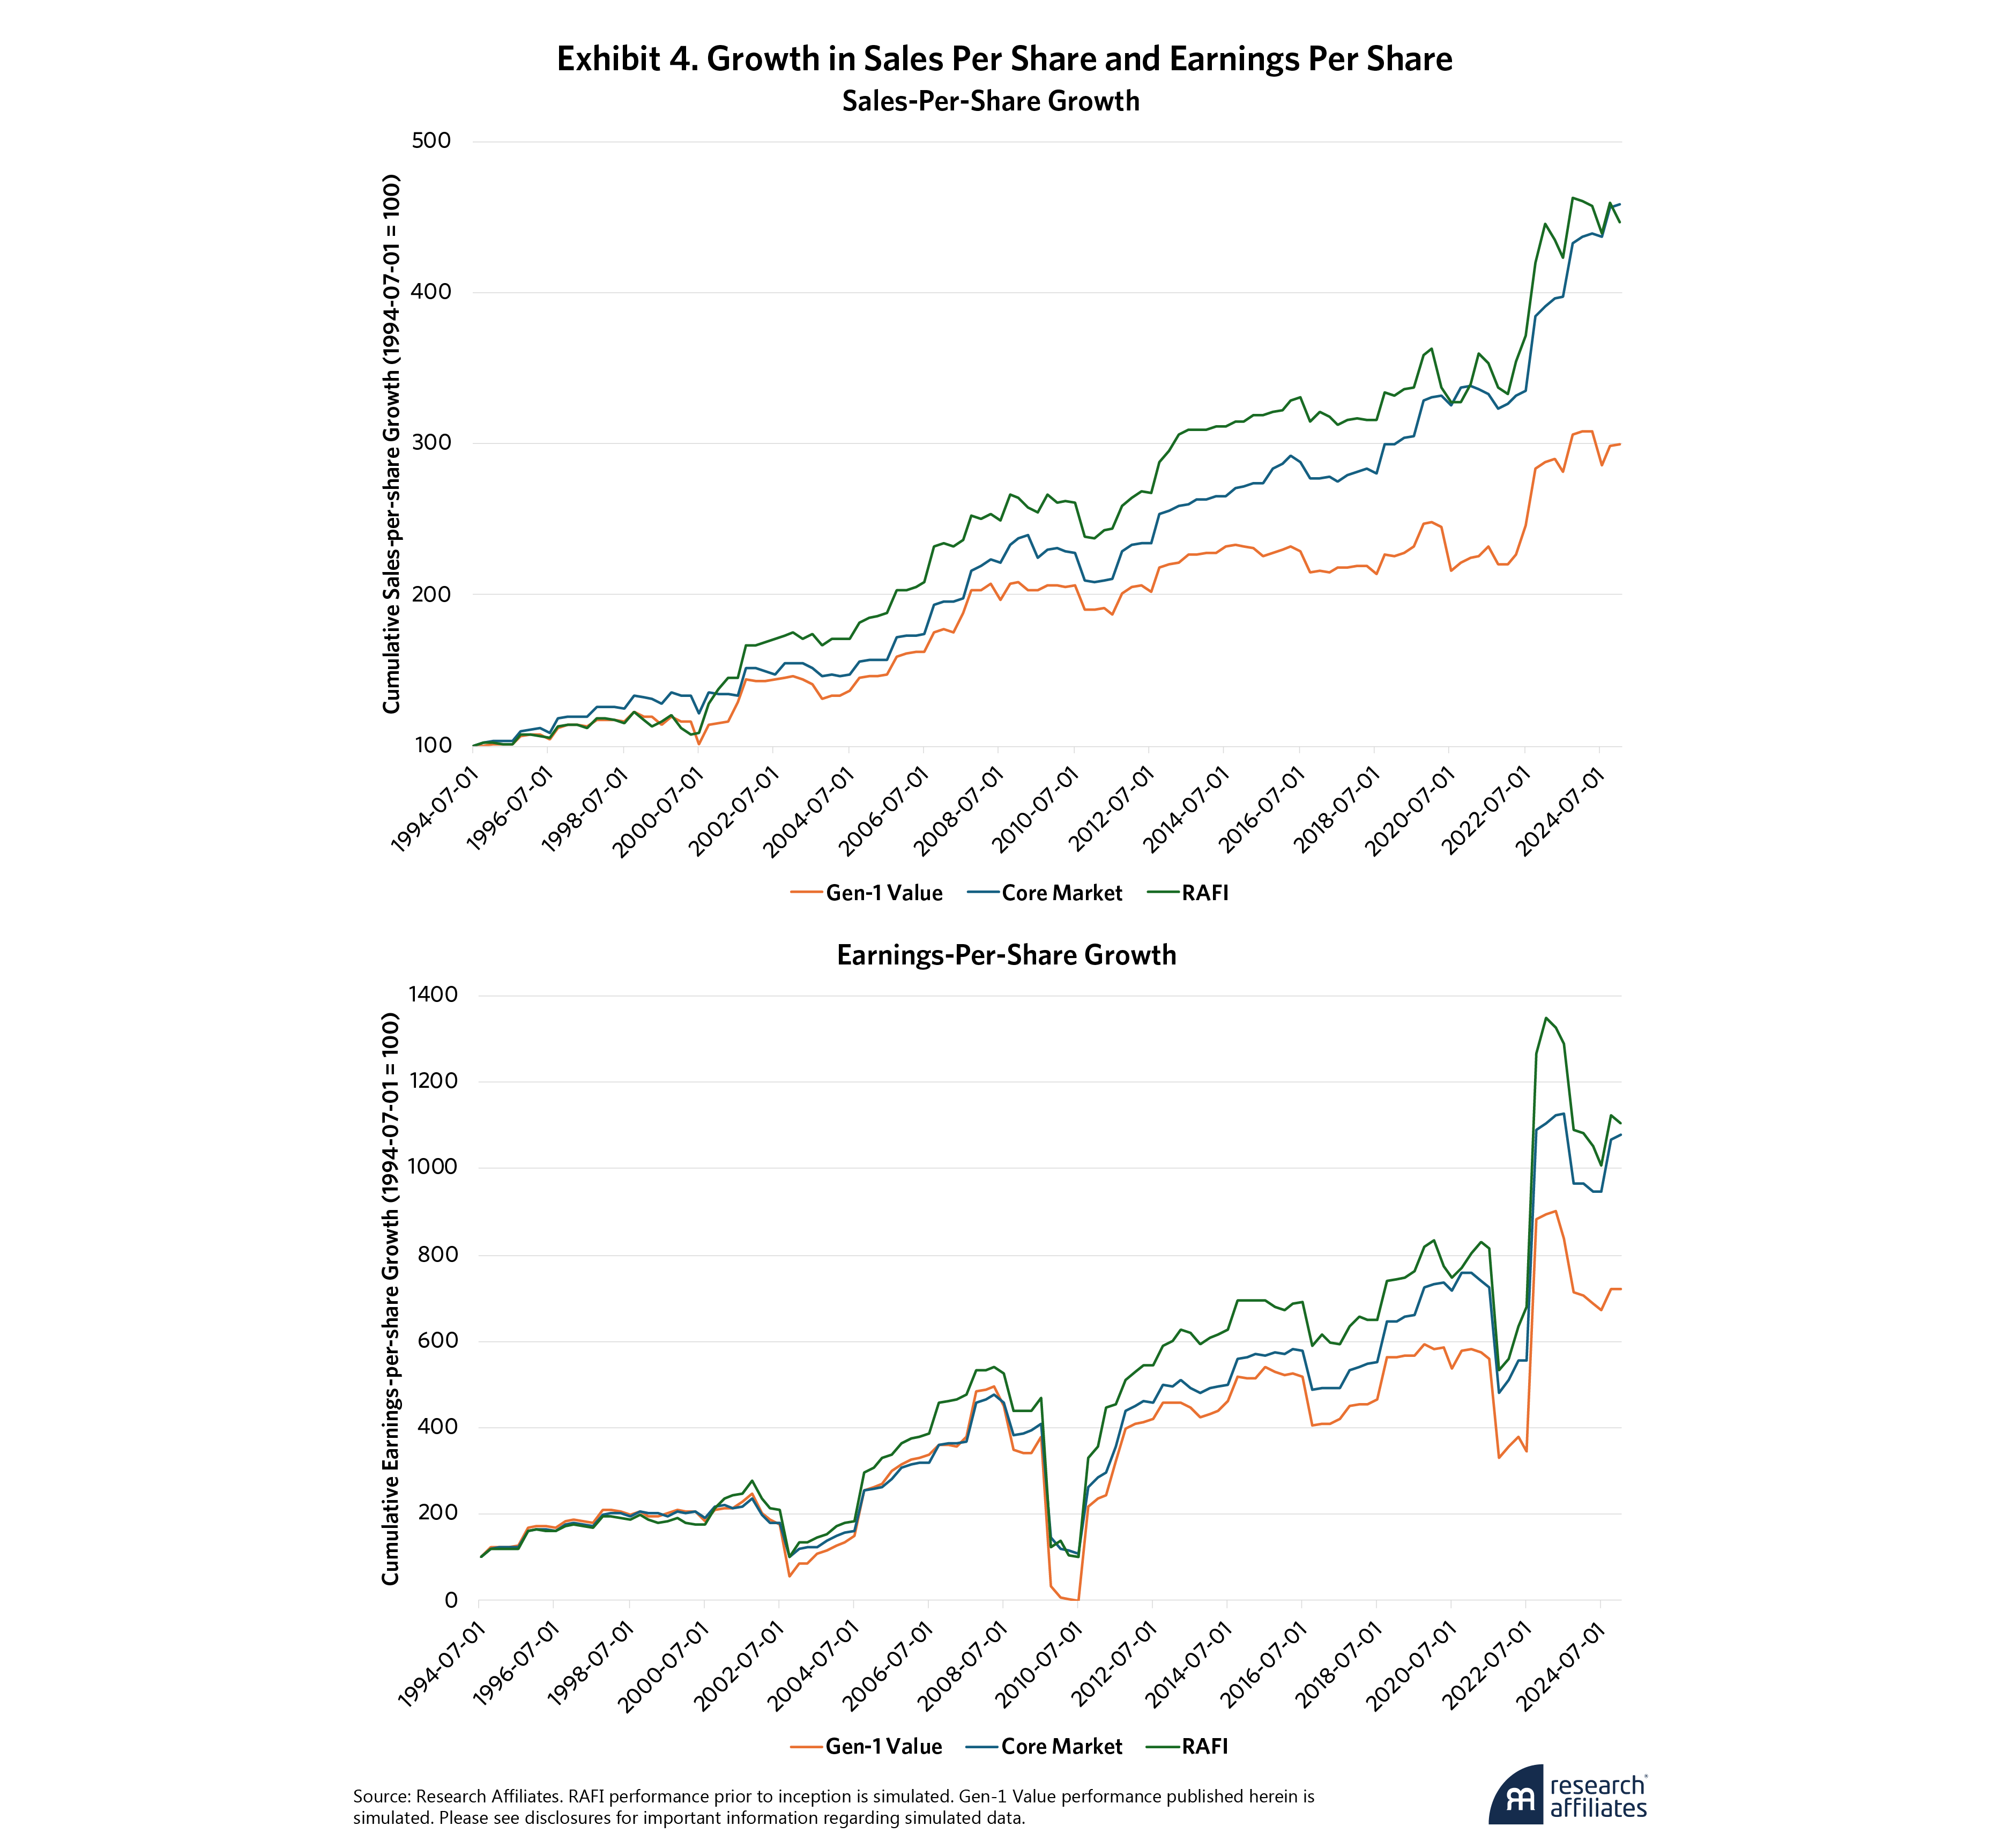
”RAFI’s alpha from growth is equal in size to its rebalancing alpha and is consistent in magnitude, whether the chosen metric is sales or earnings. As shown in Exhibit 4, the historical time series of sales and earnings growth for these indexes reveals that RAFI’s growth dominance is not isolated in any specific period but is persistent over time.
Growth and Rebalancing in Value Indexes
RAFI’s historical advantage of growth and rebalancing over Gen-1 Value is empirically clear, and we expect this advantage to continue in the future due to important differences in how each defines value investing. Both RAFI and Gen-1 Value emphasize stocks whose prices are cheaper relative to their fundamentals. Both approaches periodically sell more expensive holdings to rebalance into less expensive holdings. The difference lies in the selection of constituents and the weighting of those constituents.
Gen-1 Value index providers characterize stocks based on valuation (cheap vs. expensive) and growth (slow growth vs high growth).5 Depending on the combination of characteristics, stocks can end up in the value index, the growth index, or both indexes of these providers. Stocks that are very cheap and have very slow or negative growth will be allocated to the value index, while expensive and fast-growing stocks will be allocated to the growth index. Stocks that are expensive and slow growing or cheap and fast growing may be in both, with their market cap allocated partially to each. In this way, Gen-1 Value has an obvious anti-growth bias because fast-growing stocks are either removed from inclusion or down-weighted. This methodology implies a belief that value stocks aren’t just cheap stocks but that they should also be anti-growth companies.
By contrast, RAFI makes no evaluation and selection based on a company’s growth but only on its fundamental characteristics of sales, cash flow, book value plus intangibles, and dividends plus buybacks. RAFI achieves its value orientation not by removing fast-growing or expensive companies but by choosing to weight companies by their fundamental size rather than market cap. In this way, RAFI tilts toward less expensive companies that have lower market caps relative to their fundamentals and away from expensive companies with large market caps relative to fundamentals. This approach makes RAFI decidedly value oriented but keeps RAFI growth agnostic. RAFI’s construction embodies a belief that value investing should tilt toward cheapness but that value investing does not have to be anti-growth.
RAFI’s construction embodies a belief that value investing should tilt toward cheapness but that value investing does not have to be anti-growth.
”The anti-growth nature of Gen-1 Value indexes is a clear disadvantage in its growth contribution to returns. This has also been a disadvantage in its rebalancing. To illustrate both effects, we turn to a case study of Meta.
Case Study: Meta
When Facebook went public in May 2012, it was one of the largest and most anticipated IPOs of all time. The stock, formerly known as FB, was quickly included among the pantheon of “FANG” stocks, along with Amazon, Netflix, and Google.6 It was undeniably a growth stock with a lot of excitement around it.
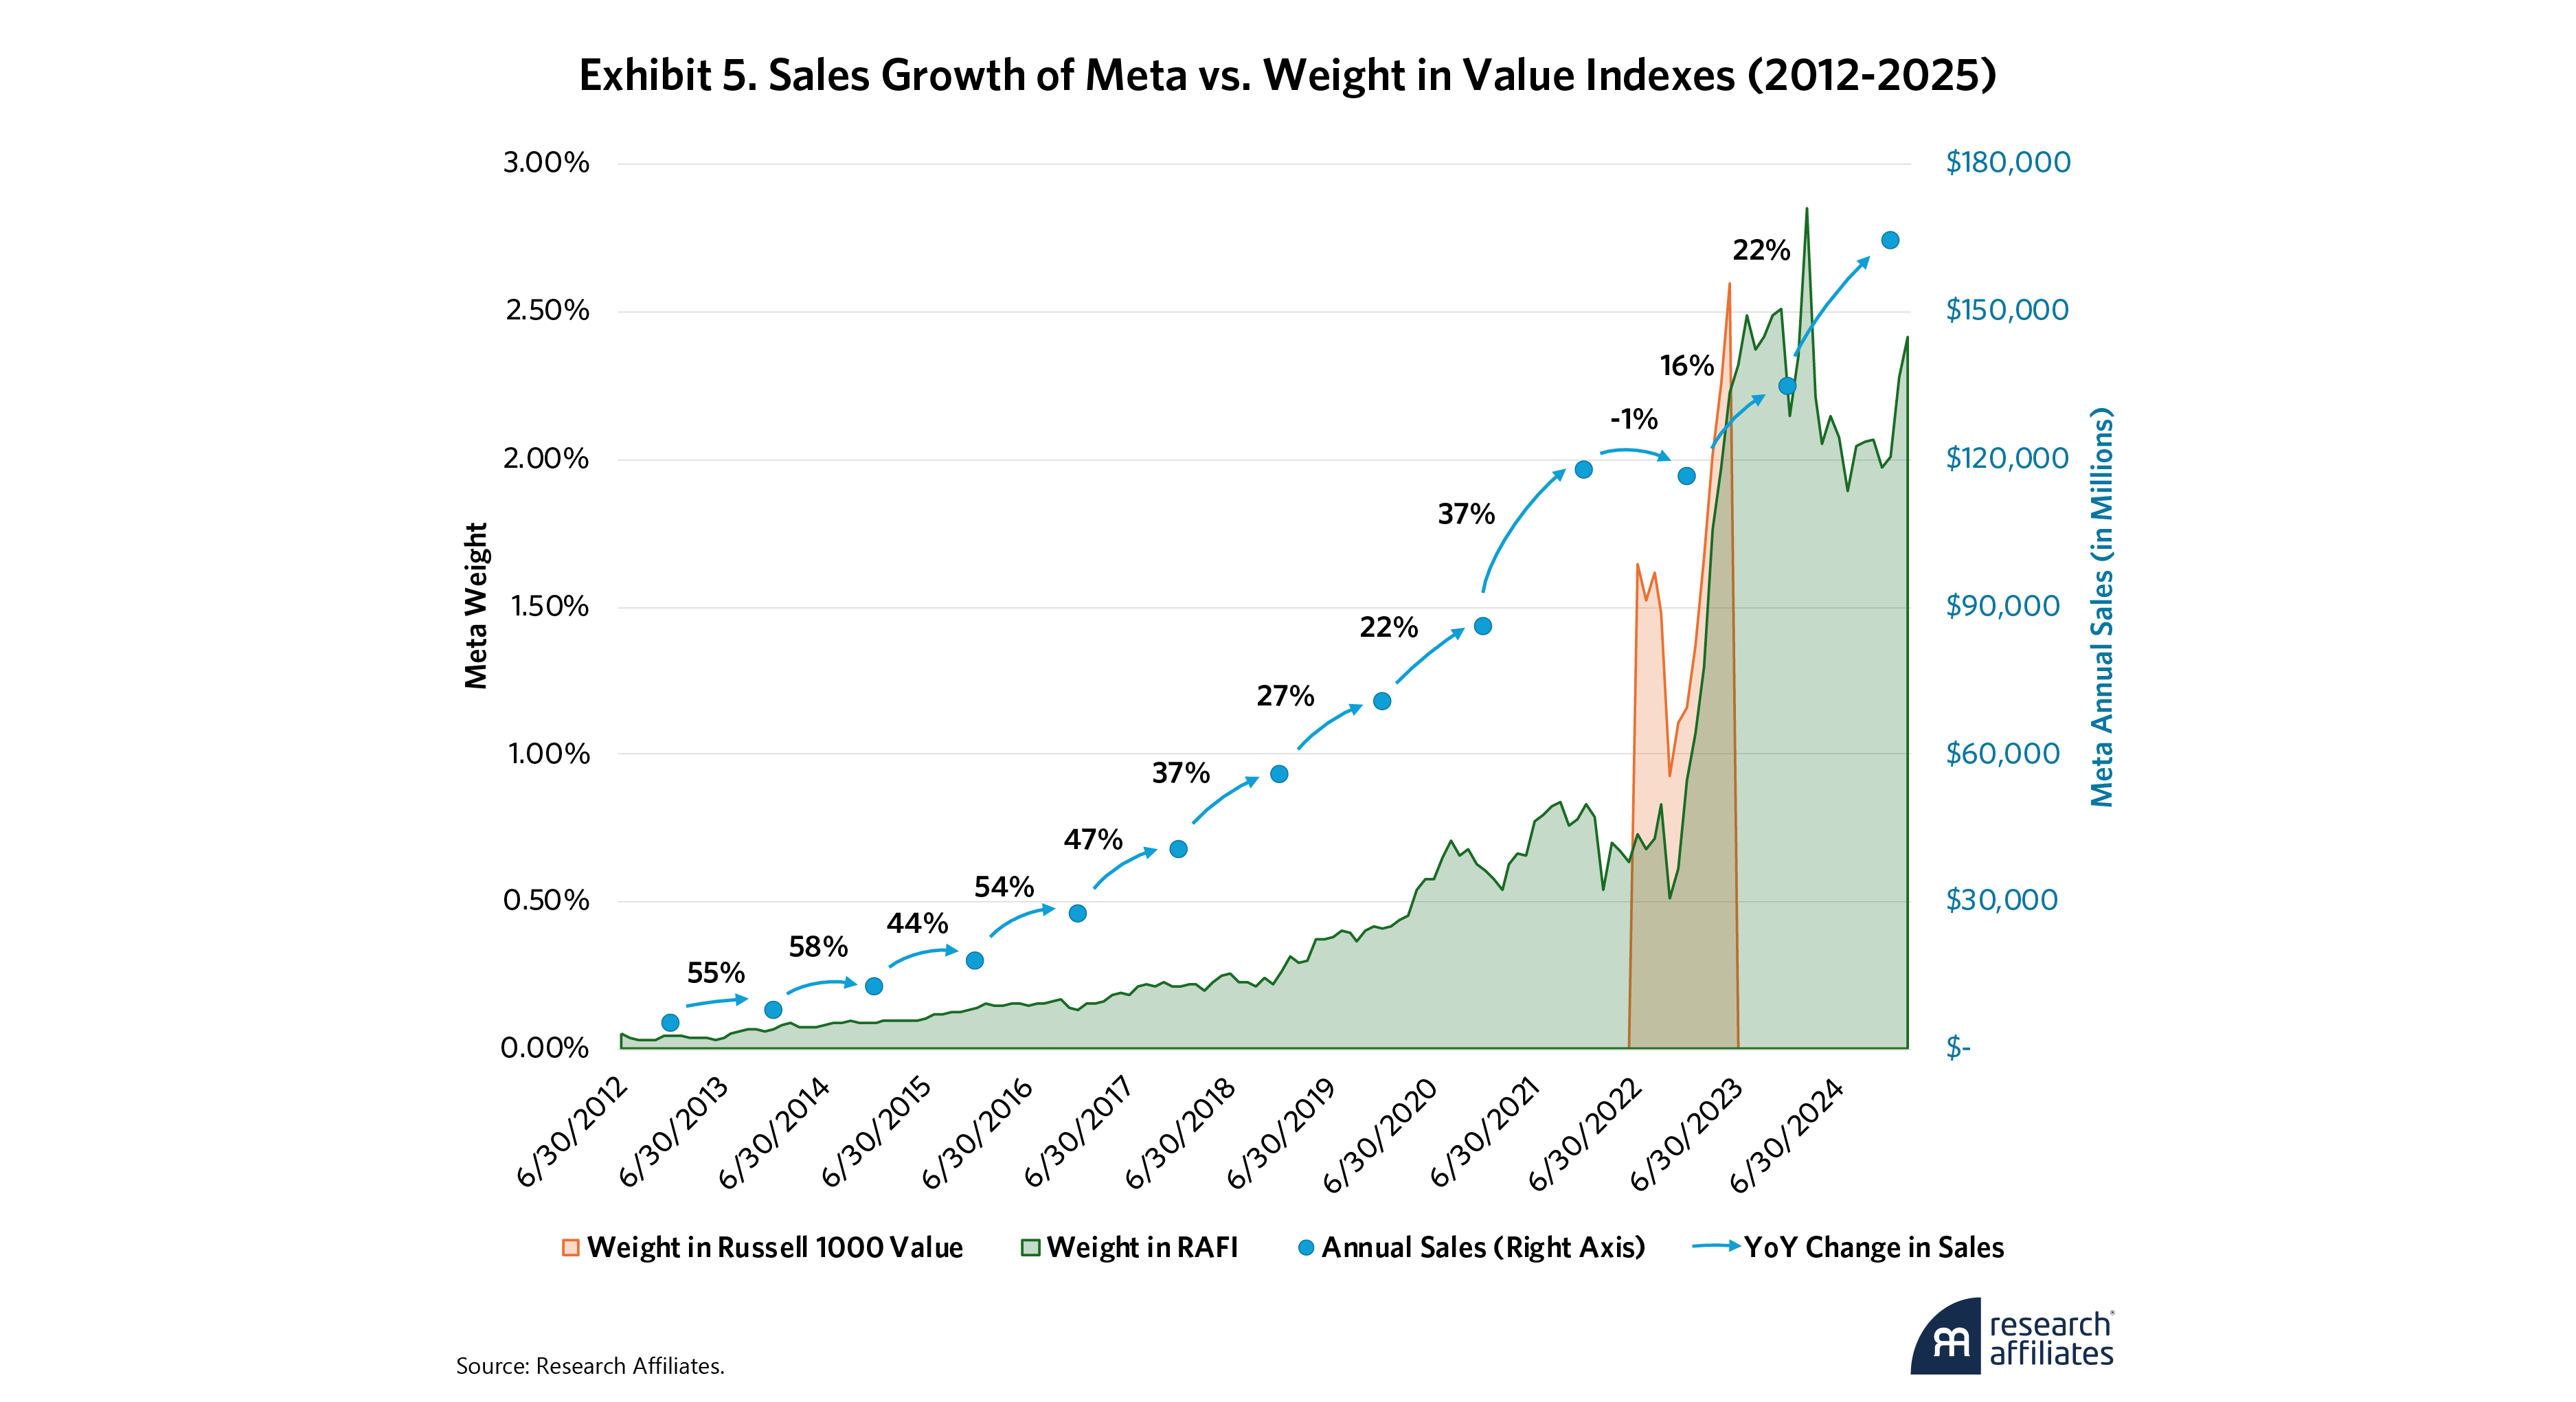
Exhibit 5 shows the tremendous rise of Meta since its IPO, growing from $5 Billion in sales in its first year as a public company to $164 billion in 2024. A traditional Gen-1 Value Index would exclude the stock entirely from its holdings, identifying Meta explicitly as a growth stock. Not until 2022 did Russell 1000 Value include Meta in its index, following Meta’s price decline earlier that year that brought its valuation below market multiples. At the time, Meta still had impressive growth characteristics, which led to its inclusion in the Russell 1000 Growth index as well and caused its market cap to be split between the two.
In contrast, RAFI included Meta from the very beginning, holding it in ever-increasing weights as the company’s fundamentals grew, as illustrated in Exhibit 5. Its weight in RAFI was of course lower than its weight in the cap-weighted market index. Even so, RAFI was able to participate in the growth of the company as it became a larger and larger proportion of the economy. The benefit to RAFI of continuous exposure to Meta is obvious, as this holding alone contributed a cumulative return to the Fundamental Index of 4.1% since 2012. By comparison, Russell 1000 Value’s brief exposure to Meta resulted in a return contribution of 1.1%.7
Meta’s weight in RAFI has risen almost monotonically over the history of the index, which seems to imply that RAFI was only buying over this time. But Meta has been a significant source of rebalancing selling over some of this period as well, with both buys and sells contributing to RAFI’s rebalancing alpha.
To understand the rebalancing around Meta, we must consider both its returns and its fundamental growth over time. Exhibit 6 shows the rebalancing process of RAFI and how it relates to growth.
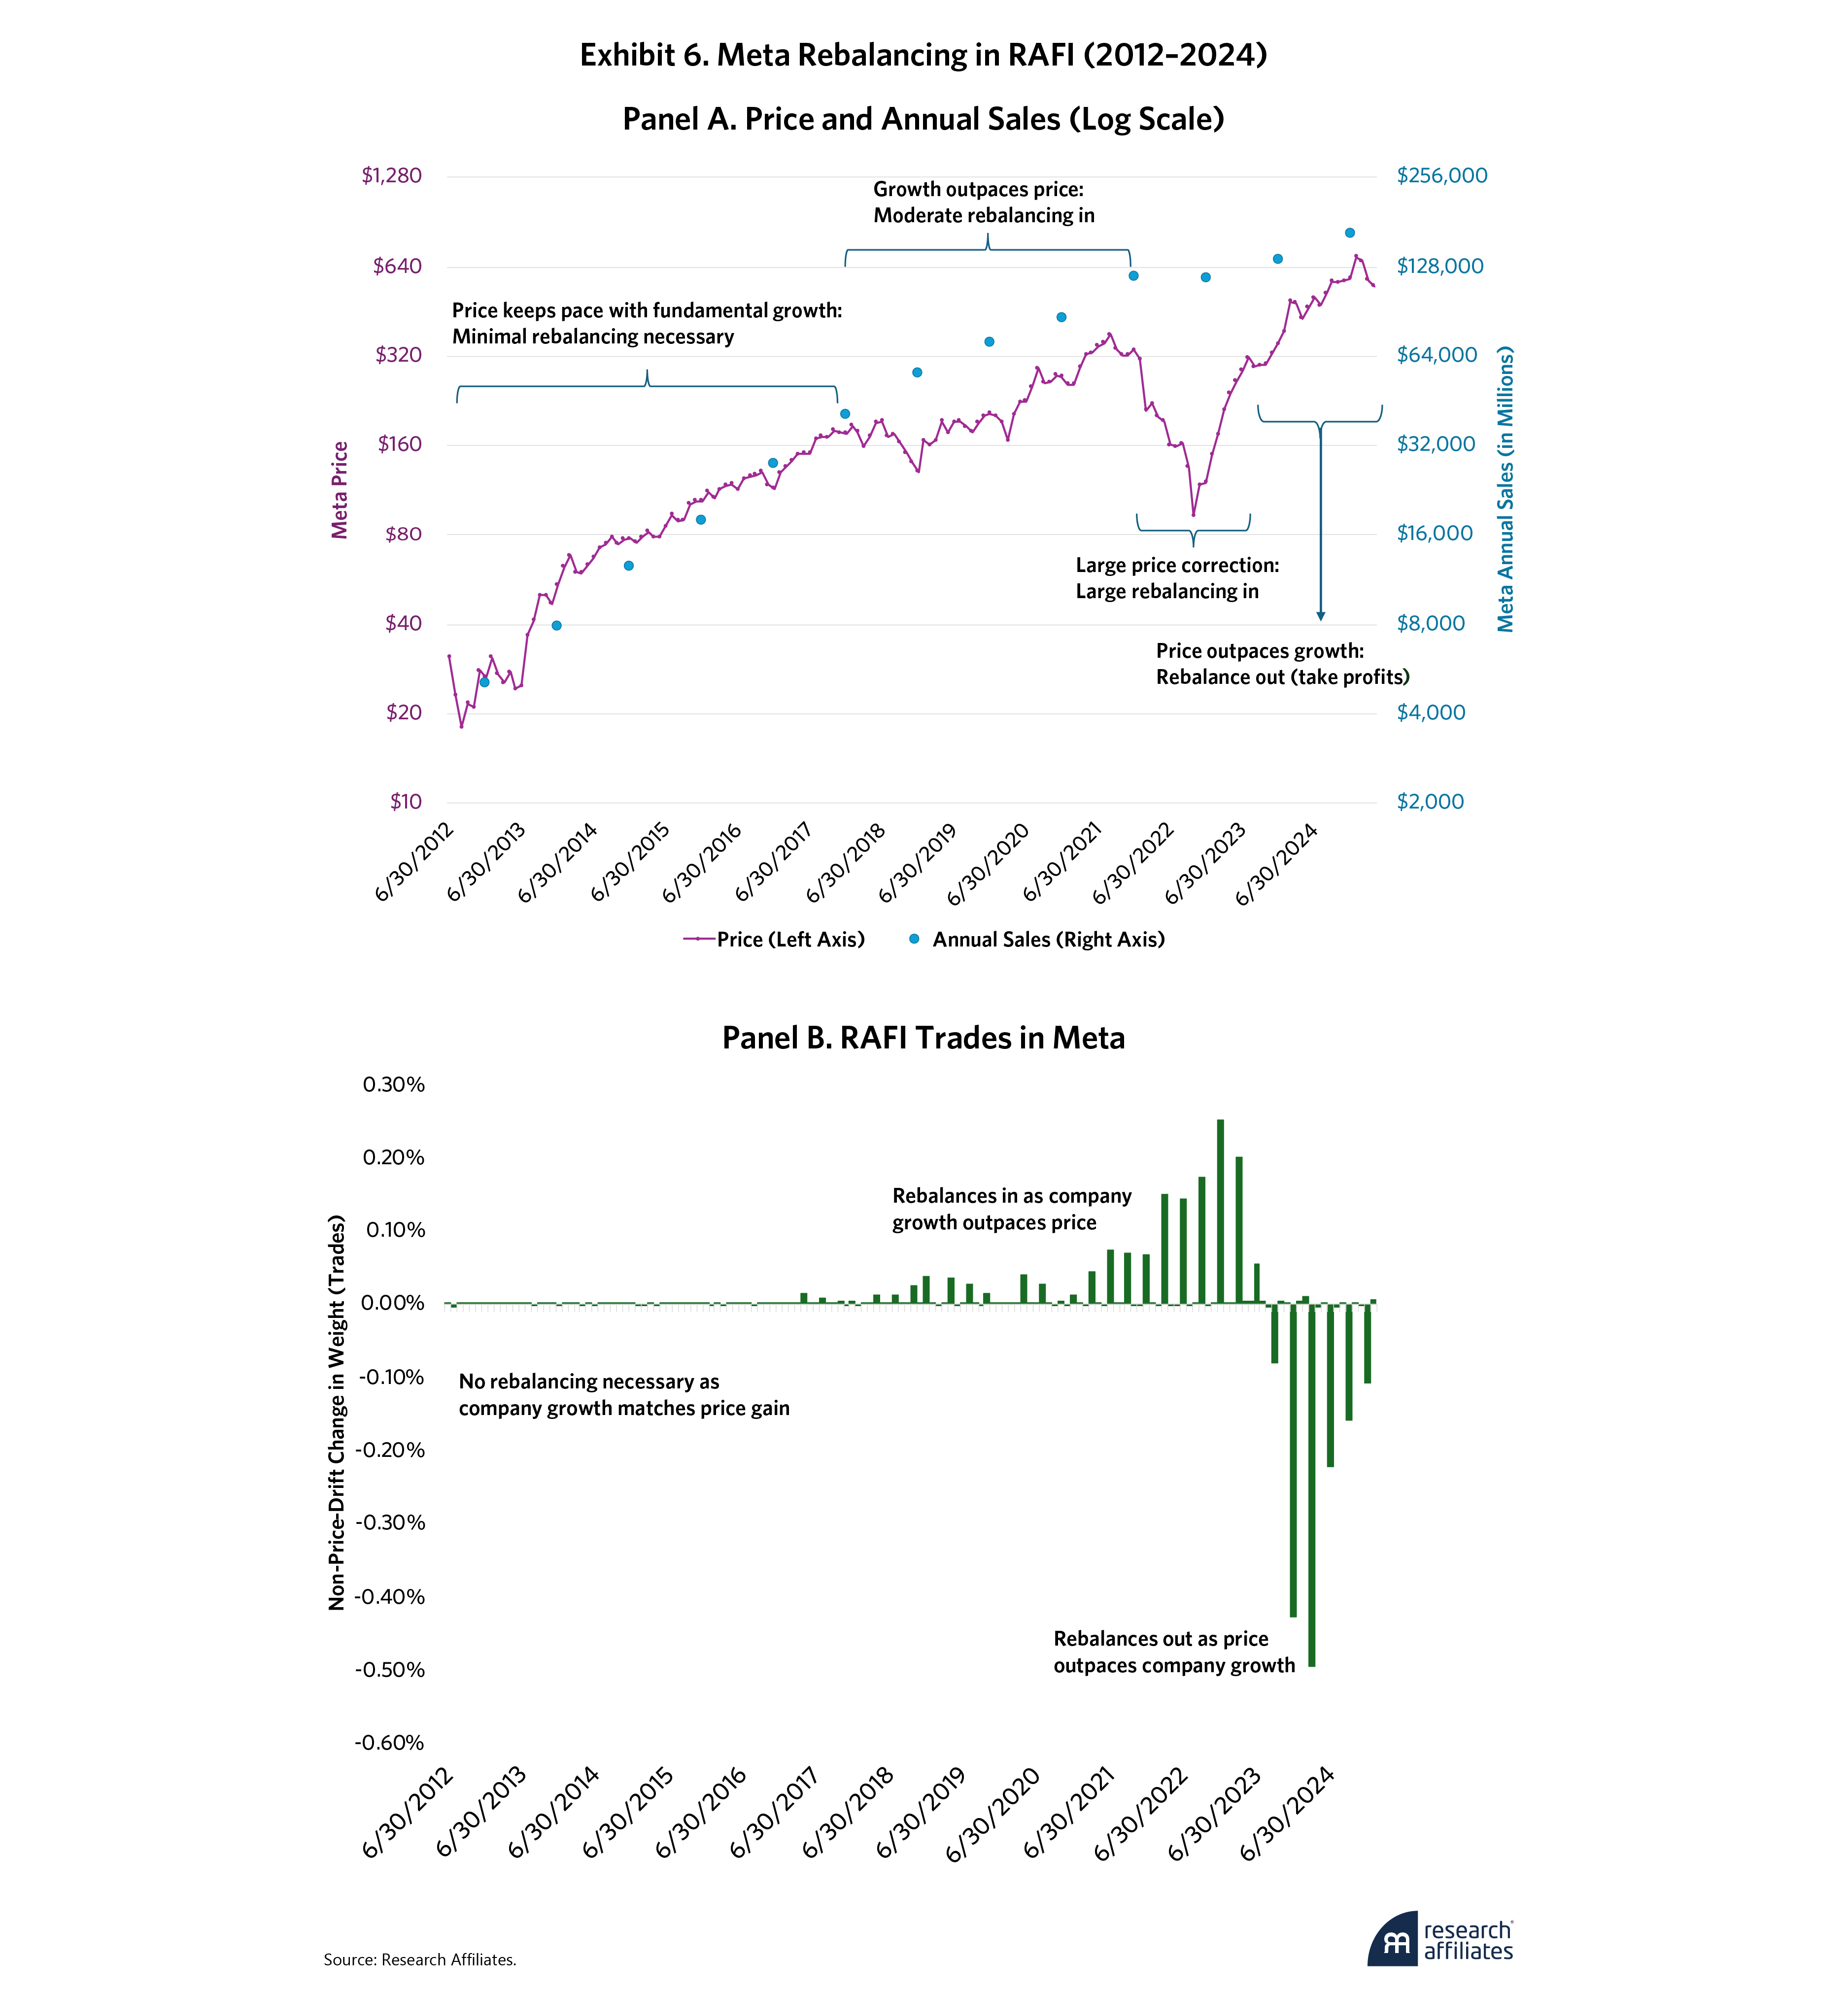
Panel A shows Meta’s share price alongside the growth of the company’s annual sales. Note that though the two series are on separate axes, each step up in scale represents a 2x increase in both sales and share price. From 2012 through 2018, both the sales and the price increased at approximately the same rate. Because RAFI weights stocks by their fundamentals,8 RAFI had to increase its weight in Meta over this span. But note that as Meta’s share price increased, its weight in the portfolio naturally increased on its own via price drift. With the price increasing at about the same rate as the company’s fundamental growth, only minimal rebalancing occurred in Meta during this time. Meta’s returns were almost entirely due to growth rather than valuation changes. Hence, its contribution to RAFI’s return was via the growth component.
From 2018 through 2021, though Meta’s price performance was quite strong, its fundamental growth was even stronger, which caused RAFI to buy additional shares incrementally. This effect can be seen in Panel B, as RAFI continued to rebalance into the stock quarter after quarter. One of the earliest rebalancing buys into Meta was in Q1 2021, which began a trend of increasingly large buys, as shown on Panel B. At this time, Meta was trading at close to market multiples, with a P/E ratio of 25x. So, how did rebalancing into a stock that was not deeply discounted on valuations contribute to rebalancing alpha? Because we must also consider what was sold. That quarter, one of the largest rebalancing sells was Apple, which was trading at a P/E of 36x. While Meta was still rich, the large sale of a much more richly priced stock to rebalance into a cheaper stock created rebalancing alpha. While Meta continued to contribute to RAFI via the growth component, it also began to contribute through the rebalancing component.
From late 2021 through the end of 2022, Meta’s share price dropped dramatically from over $370 down to $92, though its sales held steady. RAFI increased its rate of rebalancing into Meta at these lower prices to maintain its overall weight in the stock. Since that recent bottom, Meta has rebounded to a $600 dollar valuation today, doing so at a rate faster than its fundamental growth, leading RAFI to rebalance out of Meta and take profits from the shares accumulated during both its initial growth phase and its price correction phase. Its presence in RAFI along with its recent price outperformance provides a rich source of profit taking through rebalancing. Meta’s impressive growth over the past 13 years has earned it a roughly 2.2% weight in the Fundamental Index today, just below its weight in the core market index and about 2.2 percentage points more than its weight in the Gen-1 Value index.
Growth Agnostic Is Not Anti-Value
The case of Meta is a single-stock story, but it illustrates the overarching importance of remaining growth agnostic in value investing. Jaded value investors may see this growth advantage in RAFI as a form of “cheating.” To outperform value indexes, value portfolio managers can migrate their portfolios toward growth companies when the going gets tough in value. Does RAFI’s growth agnosticism result in the index becoming less value oriented or even anti-value? To answer this question, Exhibit 7 shows characteristics of RAFI compared with Gen-1 Value and the capitalization-weighted Core Market.
The case of Meta is a single-stock story, but it illustrates the overarching importance of remaining growth agnostic in value investing.
”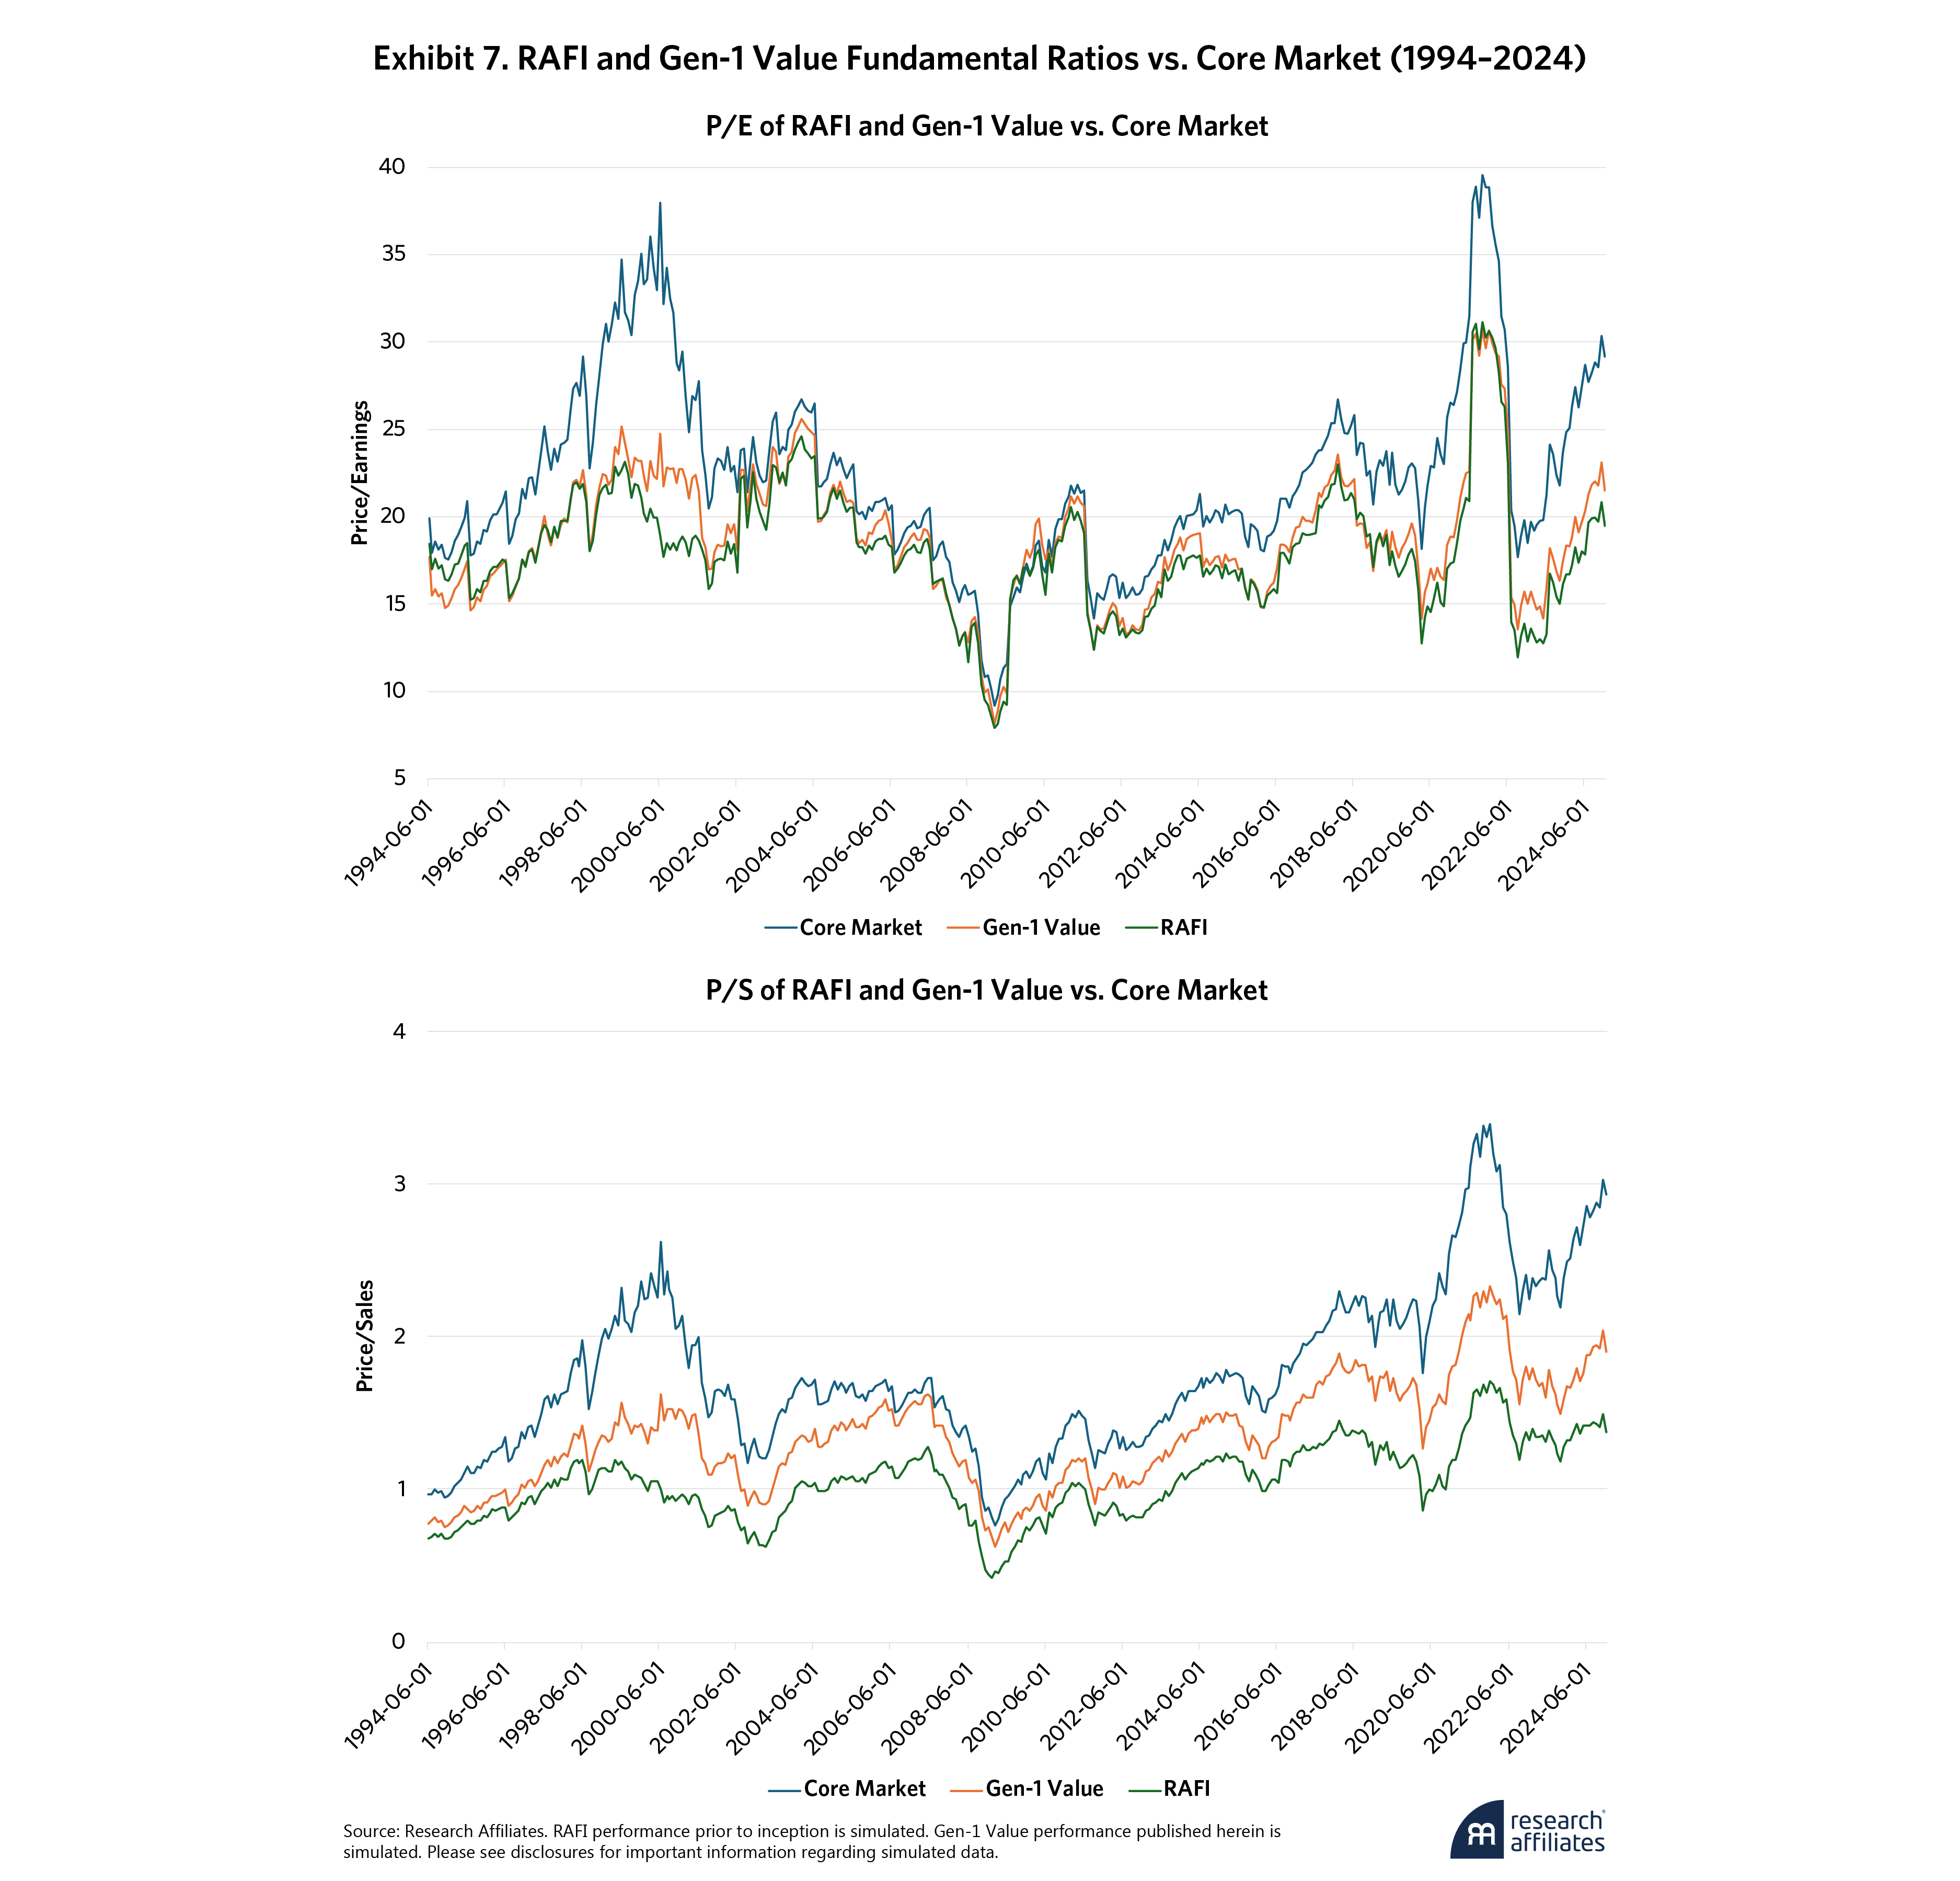
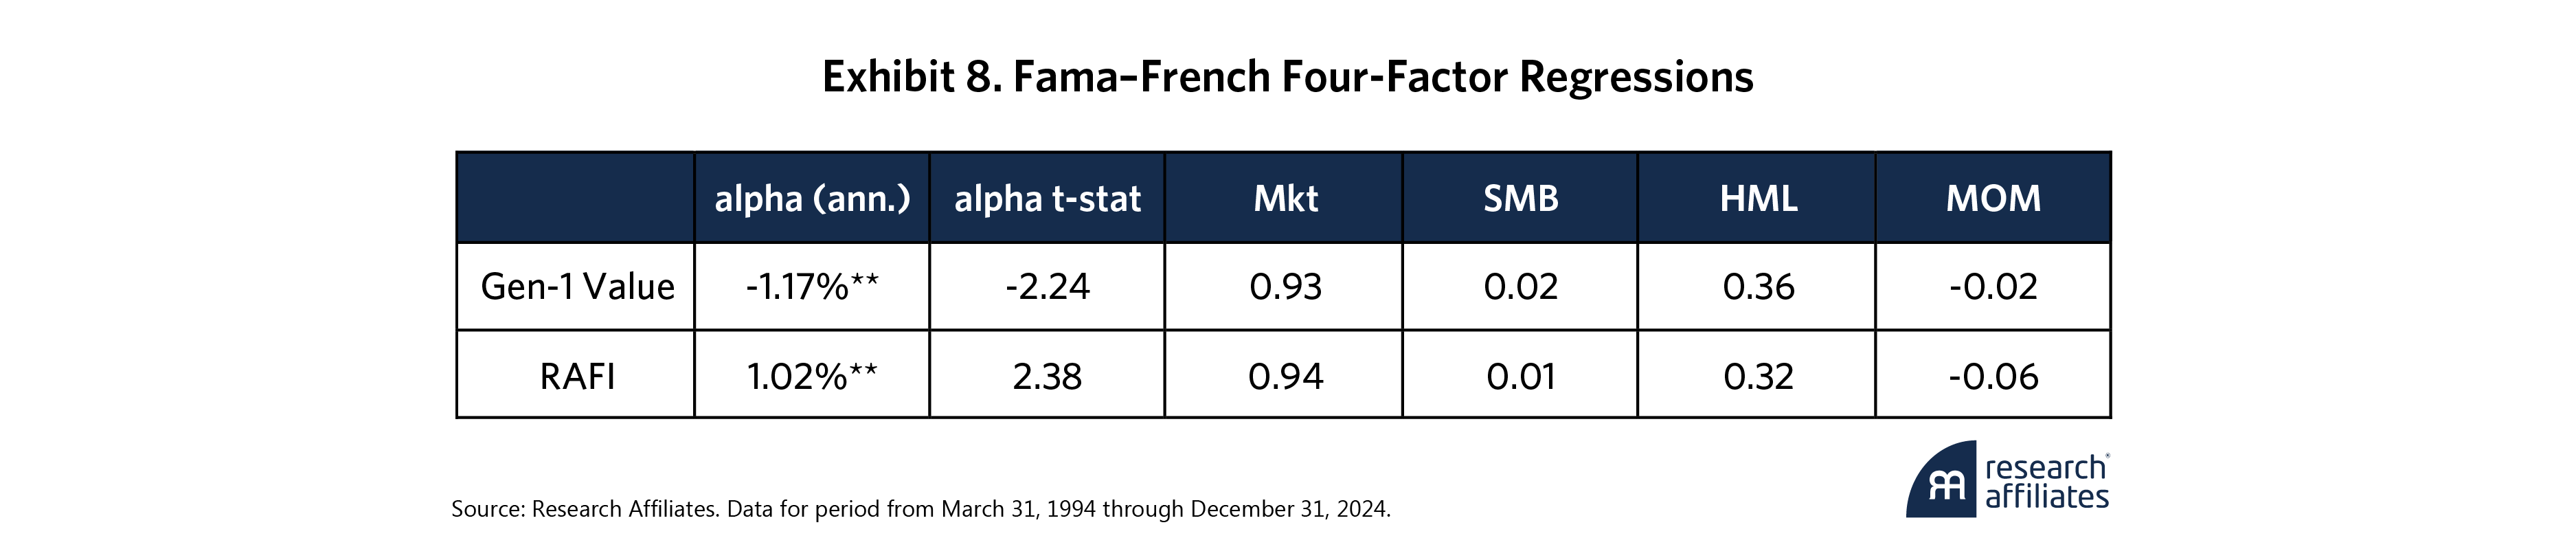
As shown in Exhibit 7, RAFI’s price-to-earnings ratio is as cheap as Gen-1 Value indexes and decidedly cheaper on a price-to-sales basis. The growth agnosticism of RAFI is clearly not anti-value by these fundamental characteristics. Nor is it anti-value in its performance characteristics. To demonstrate how this dynamic works, we ran a Fama–French four-factor regression on its historical returns. Exhibit 8 shows that RAFI’s exposure to the value factor (HML) is on the same order of the HML exposure of Gen-1 Value, though slightly lower. The fact that the RAFI portfolio is as cheap or cheaper on average than traditional value indexes yet with slightly lower HML exposure means that RAFI’s returns co-move with other value stocks slightly less than Gen-1 Value does while offering the same or greater valuation discounts and higher alpha.
RAFI’s Fundamental Advantage
In Wilde’s play Lady Windermere’s Fan, when the character Lord Darlington remarks that a cynic knows the price of everything and the value of nothing, another character replies, “And a sentimentalist, my dear Darlington, is a man who sees an absurd value in everything, and doesn’t know the market price of any single thing.”
Unlike Wilde’s characters, investors can choose a more nuanced perspective and avoid the trap of simplistic either/or thinking. They do not have to be limited to the conceptual equivalent of “quips,” even if such mental models have a measure of truth. Fundamental data can be used to identify valuation characteristics, or it can be used to identify growth characteristics. We ask, “Why not both?” The index is designed to reward growing companies with higher weights, not punish them for not fitting the conventional profile of a distressed value stock. At the same time, it continuously rebalances its holdings against the prevailing market sentiment, which, though not easy to do, generates premium in the long run. These two fundamental advantages over first-generation indexes are structural in nature—permanently embedded into the design of the portfolios. RAFI was designed to keep your growth and contra-trade too. Why would you invest in value any other way?
Fundamental data can be used to identify valuation characteristics, or it can be used to identify growth characteristics. We ask, “Why not both?
”Please read our disclosures concurrent with this publication: https://www.researchaffiliates.com/legal/disclosures#investment-adviser-disclosure-and-disclaimers.


End Notes
1. See Rob Arnott et al., “RAFI Rocks: Taking Smart Beta Back to Basics” (2023).
2. A similar decomposition was explored by Michael Aked in “Is Value Investing Structurally Impaired?” (2020). Aked chose to include dividends in structural alpha, but we exclude dividends here to focus on growth and rebalancing effects.
3. The U.S. Gen-1 Value simulation selects stocks from the top 1000 by market capitalization according to a composite value score calculated using high B/P, low five-year sales per share growth, and low two-year EPS growth. Stocks are weighted by the product of this score and market capitalization, rebalanced annually. We simulated smart beta strategies rather than use live indexes. This approach gives us a longer history, going back to 1969 in the US, and allows us to compare fundamentals on an apples-to apples basis using the same underlying company-level data and starting universe across all strategies. More information on the Gen-1 Value strategy and simulated performance is available on our website.
4. Rebalancing effects are calculated gross of transaction costs. We estimate the transaction costs associated with Gen-1 Value turnover to be 0.06% per year and the transaction costs of RAFI to be 0.01% per year. Both of these rebalancing costs are small relative to returns.
5. See Russell US Equity Indexes Construction and Methodology v6.6 (May 2025), page 22; S&P U.S. Style Indices Methodology (September 2024), pages 5–9; MSCI Global Investable Market Value and Growth Index Methodology (May 2023), pages 5–18.
6. The popular acronym has evolved over the last decade from FANG to names such as FAANG, FAANG+, MAMAA, and (more recently) the Magnificent 7.
7. Cumulative contribution to portfolio return is defined as the accumulation of the product of stock weight and stock return. This can be interpreted as the return to a portfolio that invests in Meta with the weights shown in Exhibit 4 Panel A, with the remainder of the portfolio earning zero return. For example, a $100 portfolio with a weight in Meta of 2% would hold $2 of Meta and $98 of cash. If Meta were to return 20%, the value of the portfolio would rise from $100 to $100.40.
8. RAFI weights stocks with a composite of fundamentals, though just one (sales) is used in this example.
References
Aked, Michael. 2020. “Is Value Investing Structurally Impaired?” Research Affiliates.
Arnott, Hsu, Kalesnik, and Tindal. 2013. “The Surprising Alpha from Malkiel’s Monkey and Upside-Down Strategies.” Journal of Portfolio Management 39(4): 91–105
Arnott, R. D., C.R. Harvey, V. Kalesnik, and J.T. Linnainmaa. 2021. “Reports of Value’s Death May Be Greatly Exaggerated.” Financial Analysts Journal 77(1): 44–67.
Arnott, Rob, B. Leadbetter, and Q. Nguyen. 2023. “RAFI Rocks: Taking Smart Beta Back to Basics.” Research Affiliates.
Chaves, Denis, and Robert Arnott. 2012. “Rebalancing and the Value Effect.” Journal of Portfolio Management 38(4): 59–74.
Fama, Eugene, and Kenneth French. 2007. “Migration.” Financial Analysts Journal 63(3): 48–58.
Treynor, Jack. 2005. “Why Market-Valuation-Indifferent Indexing Works.” Financial Analysts Journal 61(5): 65–69.
