Investors are wise to be concerned by zero and negative interest rate policies promulgated by central bankers, because starting yields predict future investment returns. Zero real interest rates predict zero real returns, and negative real interest rates predict negative real returns.
For long-term investors, risk is more about failing to meet wealth accumulation goals than about short-term changes in the price of their portfolios; thus, the more appropriate measure of risk is the estimated probability of reaching or failing to reach the desired or needed long-term real return level.
Given the new NIRP environment, investors may wish to look beyond a traditional 60/40 portfolio to a portfolio holding substantial allocations in non-U.S. equities, alternatives, and credit.
Negative interest rate policy, or NIRP, is the most recently deployed weapon of central bankers in their long campaign of financial repression—a deliberate policy of depressing interest rates in order to transfer wealth from savers (private citizens) to debtors (largely governments). Financial repression is intended to improve near-term growth by encouraging consumption and discouraging savings. Why save today if your money will purchase less tomorrow?
Whether NIRP will produce the results intended and/or create unintended problems is not the subject of this article. Rather, we discuss how investors may wish to alter their investment plans to take account of the changes in expected returns both within and across capital markets given the new NIRP environment.
Abandoning ZIRP for NIRP
Many investors are understandably unnerved by news of NIRP. In Europe and Japan, monetary authorities have concluded that zero interest rate policy (ZIRP) has been insufficient to meet their inflation targets. Consequently, the European Central Bank and Bank of Japan replaced ZIRP with NIRP in June 2014 and February 2016, respectively.1 Government bonds issued by these governments, and some corporate bonds in these markets, now trade at negative yields. The Fed has not (yet) deployed NIRP but is actively discussing it. In a Congressional hearing on February 11, 2016, Federal Reserve Chair Janet Yellen said the Fed is “taking a look at them [negative interest rates]…I wouldn’t take those off the table.”2 In addition to the eurozone and Japan, the central banks of Denmark, Sweden, and Switzerland have also adopted a negative interest rate policy.
In years past, economists generally dismissed negative nominal interest rates as a mere theoretical concept. In the real world, went their reasoning, rates were bounded at zero because savers would store cash in a vault before they would endure a negative interest rate. As the Swiss National Bank demonstrated in December 2014 when the institution lowered its deposit rate to −0.25%, the cost of storing cash is the actual lower bound for nominal interest rates. Nominal interest rates, we now learn, can fall to −1.00% or more before savers will abandon their bank accounts for physical cash.
Safety Warning
Ten-year real return forecasts3 are a valuable input to long-term investment planning! For investors who establish and stick to long-term plans and are able to persist with those plans over multi-year periods—for those with the conviction to increase positions that have disappointed over recent years—read on. Traders beware. Long-term return forecasts can be worse than useless for those looking for a trade. Over periods of months (and even a year or two), such forecasts are not much better than random noise. Frequent trading on such signals will enrich your broker, not you.
Negative Rates and Returns
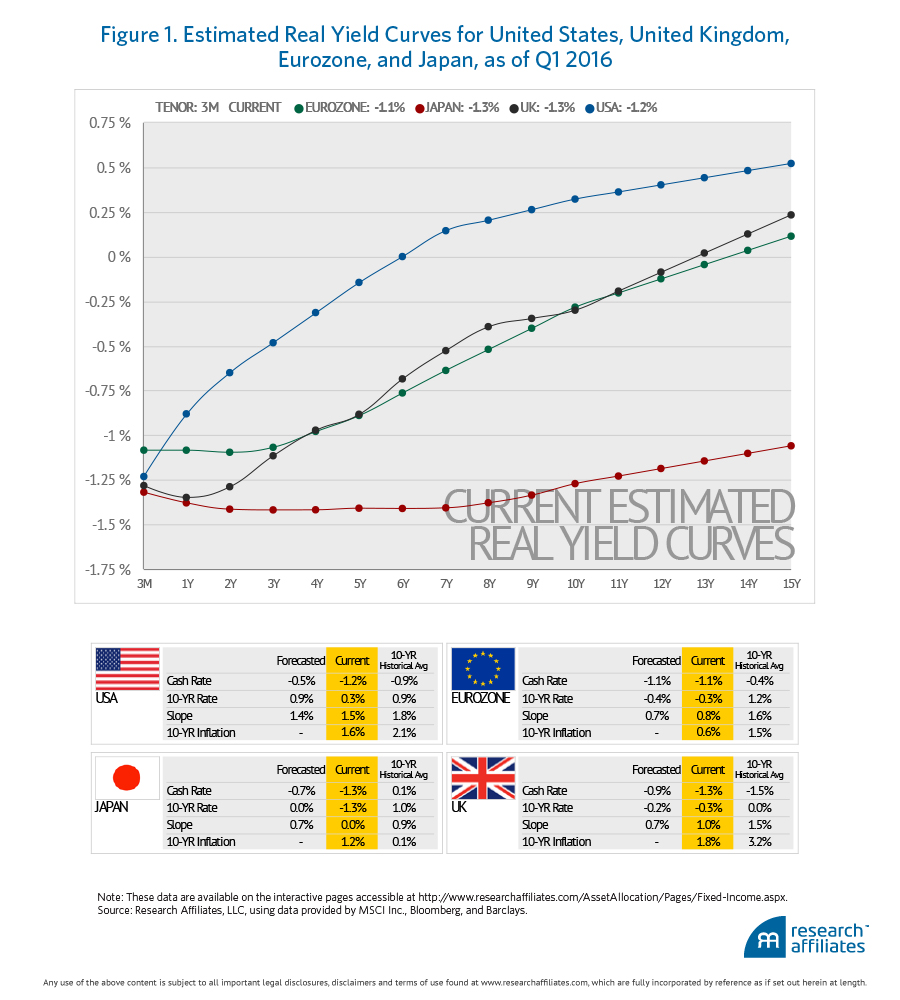
Real interest rates (nominal interest rates minus the inflation rate) determine the growth in real purchasing power from investing in bonds. Real cash rates have been negative across the developed world since the global financial crisis in 2008. Today, real bond yields are negative in longer maturities too: out to 5 years in the United States, past 10 years in the United Kingdom and the eurozone, and across the entire yield curve in Japan, as shown in Figure 1.
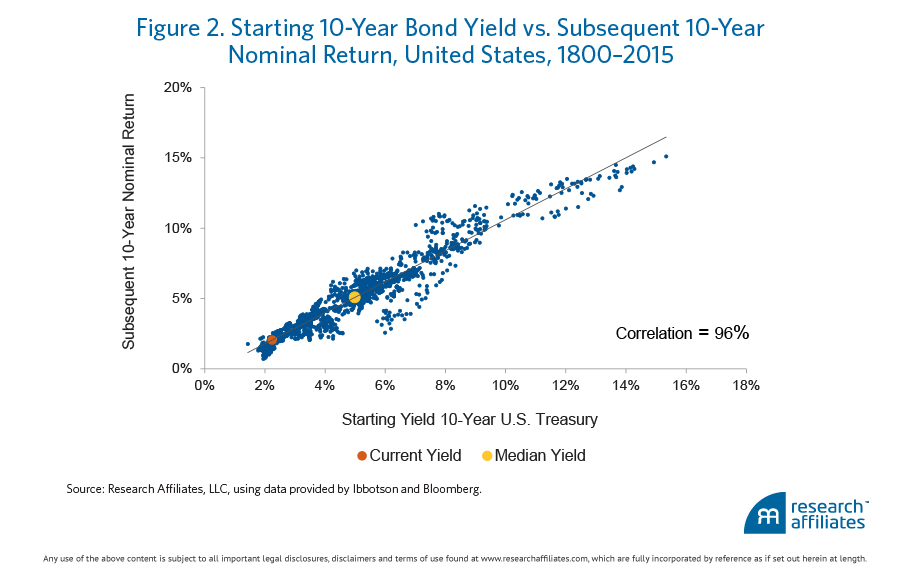
Investors have good reason to be concerned by ZIRP and NIRP because starting yields predict future investment returns. As we observe in Figure 2, the starting yield on the 10-year U.S. Treasury note has provided a highly accurate forecast of the subsequent 10-year return for those investing in the note. Consistent with this observation, zero real interest rates will predict zero real returns, and negative real interest rates will predict negative real returns.
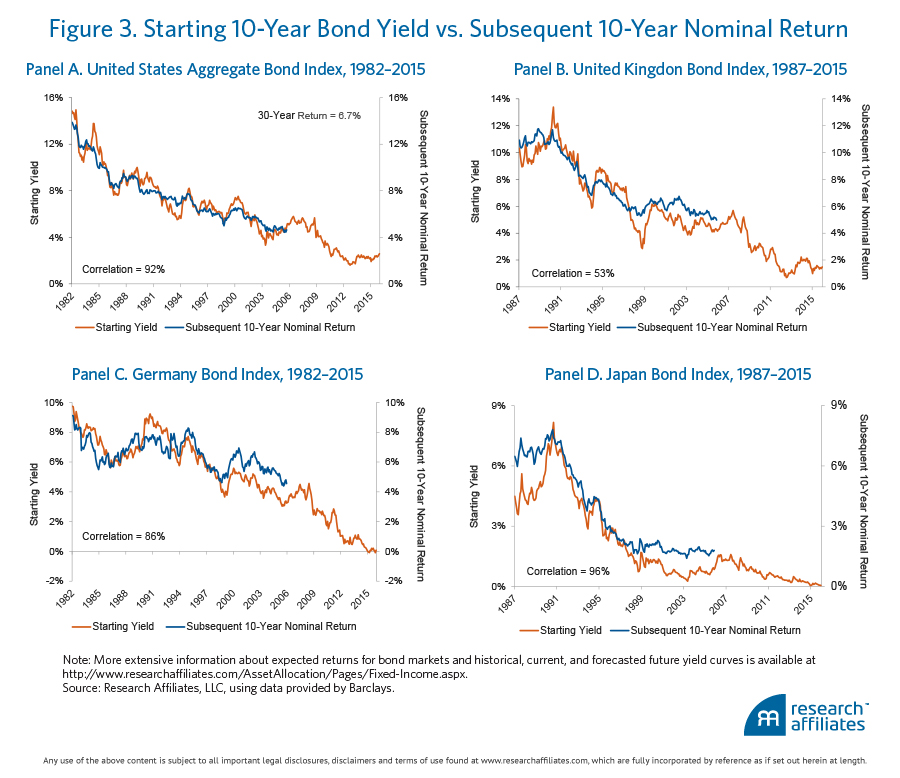
The strong predictive relationship between starting yield and subsequent return is not limited to the 10-year U.S. Treasury. The same predictive relationship is apparent for the broad investment grade bond market (U.S. Aggregate Bond Index), shown in Figure 3, as well as for 10-year sovereign debt of other developed countries. The figure plots this relationship for the United Kingdom, Germany, and Japan.
Good Credit
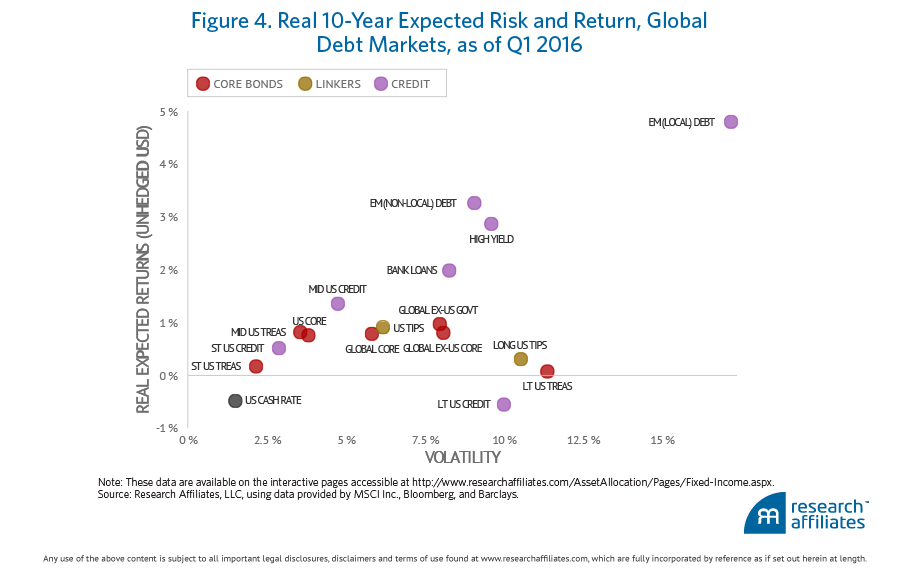
By our calculations, ZIRP and NIRP have depressed the expected real returns of core bond portfolios to within the narrow range of −1% to +1%. Fortunately, government bonds are not the only choice for fixed income investors. For those willing to substitute credit asset classes for core fixed income, our current estimates of expected returns are more attractive. At the end of the first quarter of 2016, our forecasted 10-year expected real returns (in unhedged U.S. dollars) ranged from −0.56% for long-term U.S. credit to 4.80% for local emerging-market debt. Figure 4 displays our expected 10-year risk and real return forecasts for 16 U.S. and non-U.S. fixed income sectors and the U.S. cash rate.
To be sure, asset classes such as bank loans, high-yield bonds, and emerging market debt require the investor to bear credit risk, but the yield spread over the comparable-maturity government bond provides compensation for this risk. Investors may find credit spreads and the corresponding risk premiums to be an attractive means of earning positive real returns while real yields on government bonds are being repressed by central bank policies.
Opportunity in Equities
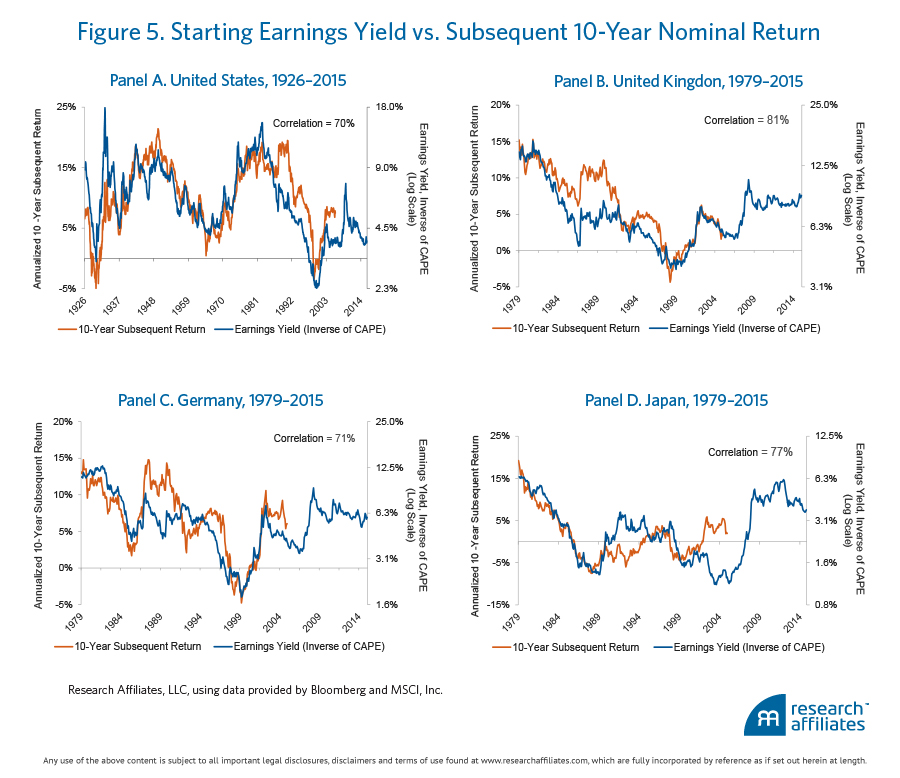
To many, the understanding that starting bond yields predict subsequent bond returns is intuitive and unsurprising. Perhaps less well understood is that the same relationship between yield and return exists in equity markets. Starting yield, which we define as the ratio of 10-year trailing real earnings per share divided by current price, has been demonstrated to provide an accurate forecast of future 10-year real returns in equity markets.
The correlation between starting earnings yields and subsequent 10-year equity returns is quite high: 70% in the U.S. market, 81% in the United Kingdom, 71% in Germany, and 77% in Japan. Figure 5 illustrates the strong predictive power of starting earnings yields for these four equity markets.
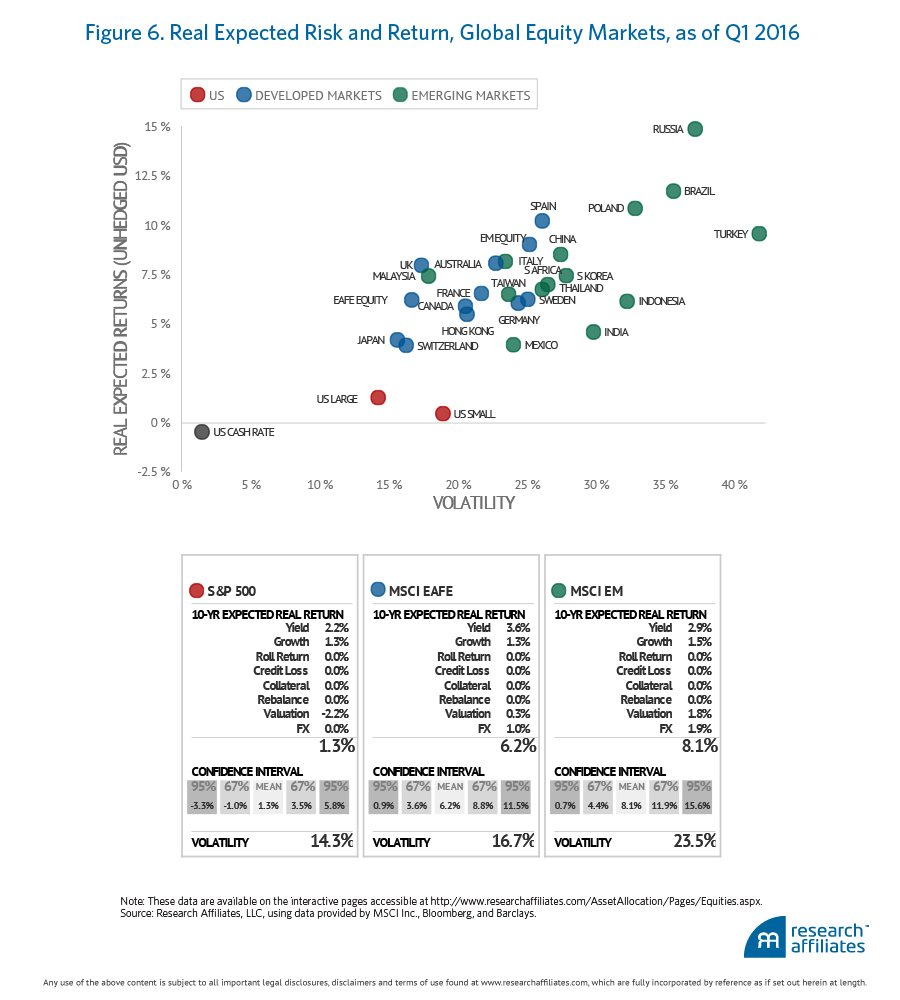
Today’s wide dispersion in equity yields across global markets provides tremendous opportunity for investors willing to look beyond the seemingly safe U.S. equity market with its high prices and low yields. Other equity markets around the world are priced much lower and consequently provide higher yields and correspondingly higher expected returns. We forecast a 10-year average annual real return of 1.25% for the U.S. equity market, 6.20% for developed ex U.S. equities, and 8.15% for emerging market equities.
At the end of the first quarter of 2016, our forecasted 10-year expected real returns for equities (in unhedged U.S. dollars) ranged from a low of 0.44% for U.S. small-cap stocks to 14.85% for Russian stocks. Figure 6 displays our expected 10-year risk and real return forecasts for 28 U.S. and non-U.S. equity sectors and the U.S. cash rate.
Out of Mainstream
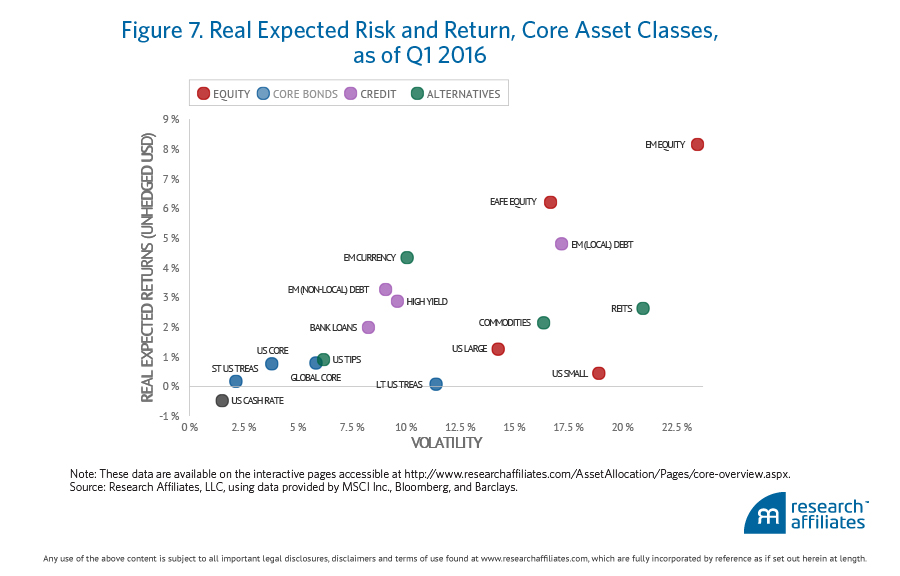
For investors willing to consider alternatives to mainstream stocks and bonds, today’s global capital markets provide ample opportunity for attractive long-term investment returns. Credit, non-U.S. equities, and alternative asset classes, such as commodities and REITS, provide investors the means to assemble a broadly diversified portfolio with a real expected long-term return of 5% or better. As with global fixed income and equity markets, the core asset classes represent a wide array of return forecasts over the next 10 years. The forecasted real returns of these global publically traded capital markets vary, as depicted in Figure 7, from a low of 0.07% for long U.S. Treasury bonds to a high of 8.15% for emerging market equities. The primary and most important, but not only, input to these return forecasts is the starting yield.
Risk With That Return?
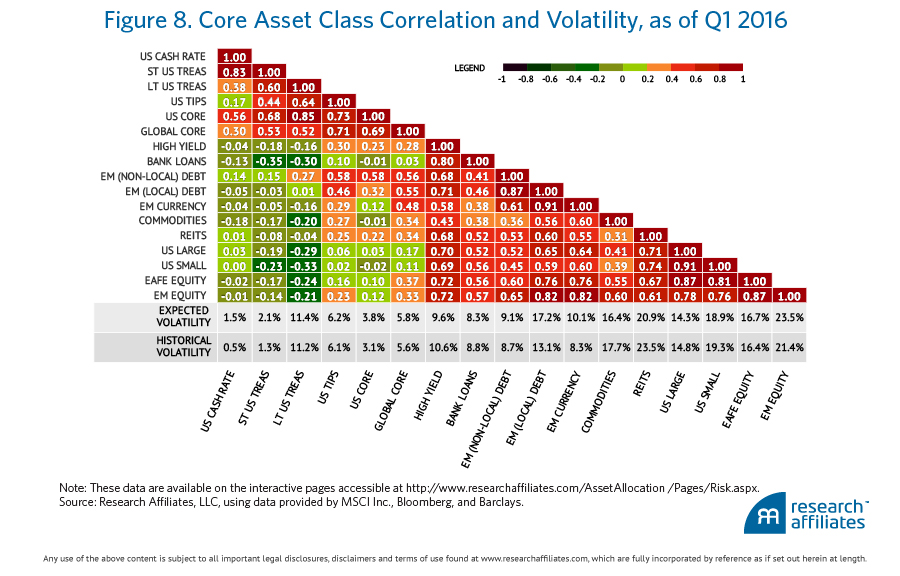
Like the coins in our pockets (or for many of us, like the memory of the coins in our pockets), financial assets have two sides. One is return, one is risk. Investment planning requires forecasting both. When two or more assets are combined in a portfolio, the risk of the portfolio is determined by the correlation of their volatilities: the more highly correlated, the riskier the portfolio.
Our estimate of volatilities and correlations for 16 global asset classes are reported in the heat map in Figure 8. The highest correlations (riskiest two-asset portfolio combinations) are colored the darkest red; the lowest (negative) correlations (least risky two-asset portfolio combinations) are colored the darkest green. But because a well-diversified portfolio combines numerous asset classes, we provide investors a portfolio tool on our Asset Allocation site that does the complex matrix algebra necessary to calculate a portfolio’s risk.
The Policy Portfolio
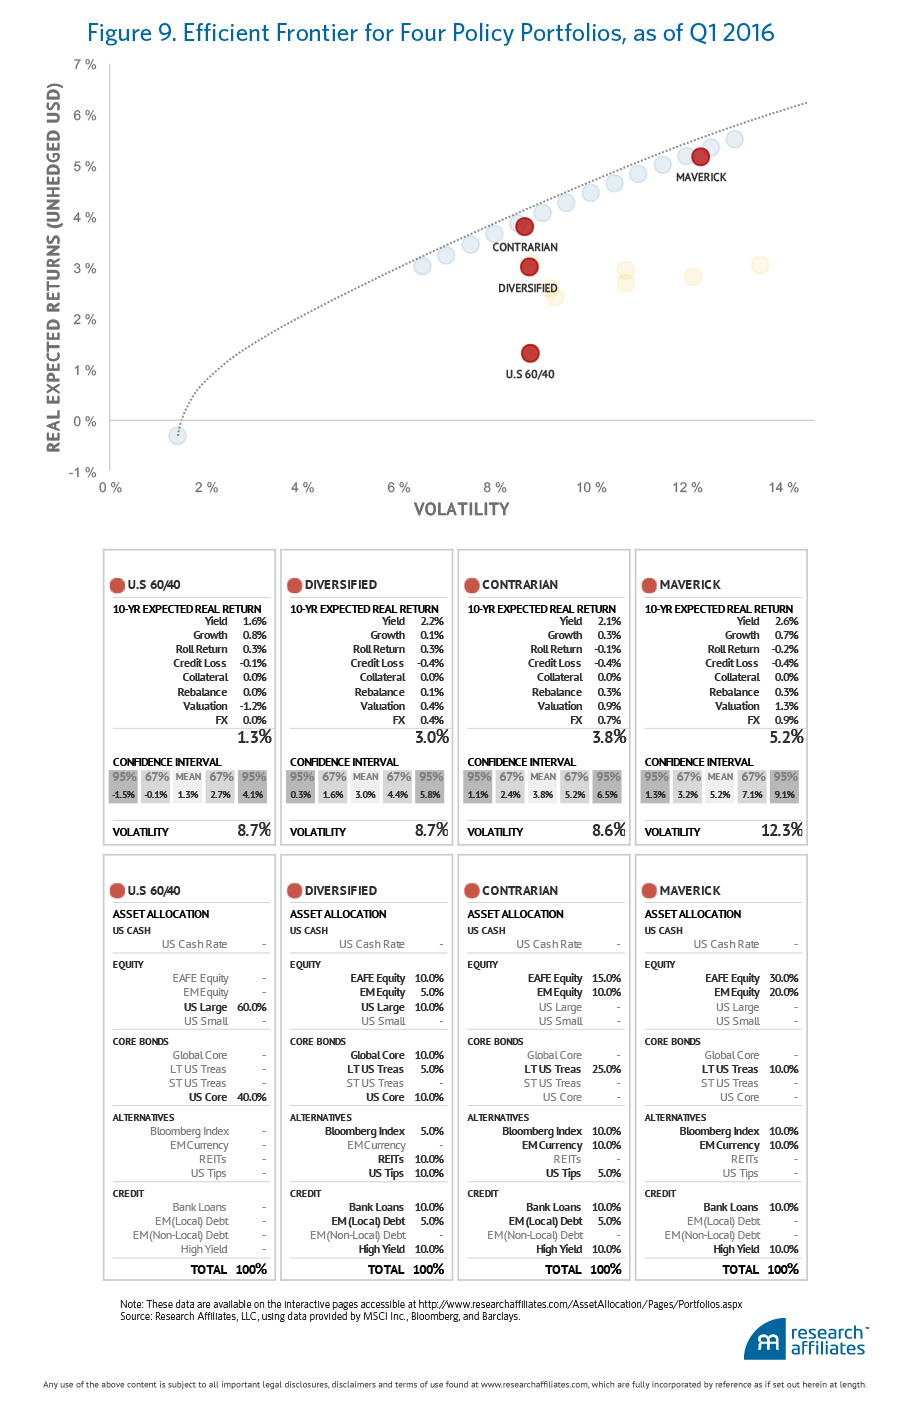
To explore investment plans in today’s capital market environment, we assemble four illustrative policy portfolios. We label the portfolios as US 60/40, Diversified, Contrarian, and Maverick.
The asset mix, expected return, and forecasted volatility of each is displayed on the scatter plot in Figure 9. The expected real return is on the vertical axis and forecasted annual volatility is on the horizontal axis. Moving from the poorly diversified and financially repressed 60/40 portfolio to the Diversified portfolio more than doubles the expected real return from 1.3% to 3.0% with no increase in forecasted volatility. Clearly, moving from a poorly diversified portfolio to a well-diversified portfolio is better than free in today’s economic and capital markets environment.
For investors who wish to maintain the modest volatility of both the low-return 60/40 portfolio and the higher-return Diversified portfolio, expected return can be further improved by embracing a contrarian stance. Substituting cheaply priced non-U.S. equities for expensively priced U.S. equities and concentrating fixed income investments in risk-reducing long Treasuries and TIPS, the 10-year expected real return can be nudged up to 3.8% with no increase in forecasted volatility.
Planning for an expected real return above 5% in today’s world of negative real interest rates requires accepting higher volatility. The Maverick portfolio with a 50% allocation to non-U.S. equities has an estimated volatility of just over 12% versus a bit below 9% for the other three portfolios. Are we faced with a risk/return quid pro quo if we invest all of our equity allocation in non-U.S. equities? Must we take more risk to earn a higher return? Read on.
What Risk?
To accurately answer the preceding question, we must define risk. Volatility is not the only—or even the most relevant—measure of risk. For long-term investors, risk is more about failing to meet wealth accumulation goals than about short-term changes in the price of a portfolio. A better measure of risk than annual volatility is the estimated probability of reaching or failing to reach the desired or, more important, needed long-term real return level.
Using our estimates of risks and returns, investors in the Maverick portfolio should be 95% confident of reaching or exceeding an annualized 10-year real return of 1.3%. In contrast, investors in the 60/40 portfolio have a 50% probability of failing to exceed a 10-year real return of 1.3%. From this perspective, such a high probability of low or zero real returns is not low risk! For the long-term investor, the 60/40 portfolio presents the highest risk of failing to accumulate wealth.
Why does the 60/40 portfolio seem safer? This traditional investment portfolio protects the investor from having to accept maverick risk—a conceptually uncomfortable position for many investors. As John Maynard Keynes wrote in 1935 in his well-known tome Theory of Employment, Interest, and Money, “Worldly wisdom teaches that it is better for reputation to fail conventionally than to succeed unconventionally.”
We will have more to say about maverick risk in forthcoming articles and in the information provided on our Asset Allocation site in the months ahead.
Endnotes
1. The European Central Bank announced a −0.10% deposit rate on June 12, 2014 (and as of March, 10, 2016 the rate stands at −0.40%), and the Bank of Japan announced a −0.10% current account rate on January 29, 2016, that became effective on February 16, 2016.
2. "Janet Yellen: Negative Rates Possible in U.S." CNN Money, February 11, 2016.
3. In this article, we use our 10-year real return forecasts available to all on our interactive Asset Allocation site.
