
The conventional wisdom, that market capitalization is the best metric for selecting and weighting stocks in equity market indices, hinges on the assumption that markets are efficient. If markets are not efficient, specifically if pricing errors mean revert, there will be ways to improve all categories of stock market indices.
The Research Affiliates Fundamental Index (RAFI) uses fundamental selection and fundamental weighting. Price moves do not influence either selection or stock weighting, leading to a compelling alternative to conventional value indices. The same principles can be applied to core (RACWI) and growth (RAFIG) to form the Research Affiliates Trifecta of fundamentals-based indices.
The Research Affiliates Trifecta design produces three forms of alpha: alpha from a dynamic value tilt, a rebalancing alpha, and a stock selection alpha.
In a sometimes boring field like indexing, revolutions tend to be quiet and slow. But they still happen. Standard and Poor’s debuted the first broad-market capitalization-weighted (CW) index, the S&P 500, in 1957, which sowed the seeds for the first index funds some 15 years later. Capital International – MSCI’s predecessor – pioneered international indices in 1970. Russell took the lead on growth and value and large- and small-cap indices in 1978. These legacy index providers were all trailblazers, preparing the ground for a bumper crop of further innovations by these pioneers and others in the years since. It is a privilege to build on such a sturdy foundation.
Create your free account or log in to keep reading.
Register or Log in
When we launched the Research Affiliates Fundamental Index (RAFI) in 2005, we could not have imagined how such a remarkably simple concept would inspire the ingenuity of the indexing world in the subsequent decades. RAFI challenged cap weighting’s primacy by offering a fundamentals-weighted and hence value-tilted broad-market index. Live results1 show RAFI has performed well against CW value indices all over the world. As we demonstrate here, the same idea extends naturally beyond value investing and can reshape how we think about CW growth and CW core indices as well.
When we launched the Research Affiliates Fundamental Index (RAFI) in 2005, we could not have imagined how such a remarkably simple concept would inspire the ingenuity of the indexing world in the subsequent decades.
”That the CW index is the best proxy for all types of equity markets is predicated on efficient markets, among other strong assumptions. But what if markets are not perfectly efficient? Then breaking the connection between weight and price may create opportunities for better investment outcomes. Our innovation seeks to retain indexing’s benefits while redefining how we conceive of selection and weighting.2 Fundamental measures can help select companies, weight them, or both for value, core, and growth indices. If we can develop indices that have historically outperformed3 in all three domains – value, core and growth, all over the world – the term “Trifecta” is hardly an exaggeration.
The essential elements of RAFI are fundamental selection and fundamental weighting. Fundamental selection means that we determine index membership based on objective measures of the underlying companies’ economic influence – such as sales, cash flow, dividends, and book value – while deliberately ignoring share price and market value, which already reflect consensus expectations of future growth. Fundamental weighting means that we size each holding according to those same measures of economic scale. Periodically rebalancing our portfolio to these fundamental weights can deliver an additional rebalancing alpha over time, when price movements are not supported by changes in underlying fundamentals.
The Research Affiliates “Trifecta” thus counters indexing orthodoxy by severing the tie between price and portfolio construction across the value, core, and growth segments. Its reliance on fundamental selection and fundamental weighting produces three distinct strategies: Research Affiliates Fundamental Index (RAFI), a value index that uses fundamentals for both selection and weighting; the Research Affiliates Cap-Weighted Index (RACWI), a core index that applies fundamental selection but retains cap weighting; and the RAFI Growth Index (RAFIG), a reimagined growth index that selects and weights based on the degree of actual business expansion rather than valuation multiples.
In RAFI’s early days, we observed that CW core indices studiously mirror the composition of the stock market, while RAFI studiously mirrors the composition of the publicly traded macroeconomy. RAFI therefore serves as an economy-weighted alternative to CW indexing. It can also complement conventional cap weighting, as Schwab4 and others have advocated, and provide an alternative value strategy. While RAFI introduces a stark value tilt, it differs from CW value indices by down-weighting growth stocks to their economic footprint rather than excluding them outright and by systematically contra-trading price movements not supported by changes in fundamentals.
SideBar: Is RAFI Just Value Investing?
RAFI is often characterized as a value strategy. That description isn’t wrong: By design, RAFI reduces exposure to high-multiple stocks and increases exposure to cheaper ones as measured relative to the CW market. The distinction lies in how we create that value tilt. Traditional value indices define value through prices and simply discard the stocks trading at premium multiples. RAFI considers the entire opportunity set (value and growth companies), and anchors portfolio construction to measures of a company’s fundamental economic influence so that valuation effects emerge as a byproduct rather than a design choice. This shift – from prices to fundamentals – proved sufficiently novel to earn multiple patents and allows RAFI to function not only as a value strategy but also as a complement to cap-weighted portfolios.
RAFI is sometimes criticized as backward-looking because it pays no explicit attention to a company’s expected future growth. While directionally correct, this assessment misses the point. Share prices already embed the consensus market expectations about a company’s future prospects. Precisely because those expectations are reflected in prices, they offer no reliable source of future return unless they prove incorrect. By building portfolios based on fundamentals rather than forecasts, fundamental selection and weighting systematically lean against speculative narratives and can potentially harvest a reliable risk- and style-adjusted alpha when expectations are wrong.
The intuitive logic that inspired RAFI can also inform the way we manage growth and core investing. When we buy a stock, we are buying a stake in a tangible business with observable sales, R&D, profit, net worth, dividends, and distributions to shareholders. We are not speculating on the future price appreciation of a set of factors or a ticker symbol. By moving beyond market value data to focus on the observable characteristics of a company’s real business, we create better-informed indices in all segments of the market.
Growth in this sense is not a valuation multiple or a narrative. It is an observable economic phenomenon measured by the rate and magnitude at which a company expands its contribution to the macroeconomy. When we apply these ideas systematically, something striking happens. A single guiding principle gives rise to three distinct expressions that each address a different area of the equity market. In value investing, it offers a disciplined alternative to price-based indexing. In core investing, the same selection logic – combined with cap weighting – yields an index that reflects the evolving structure of the economy rather than the market’s shifting enthusiasms. When viewed through the lens of business growth, the result is an entirely new way to think about growth investing.5
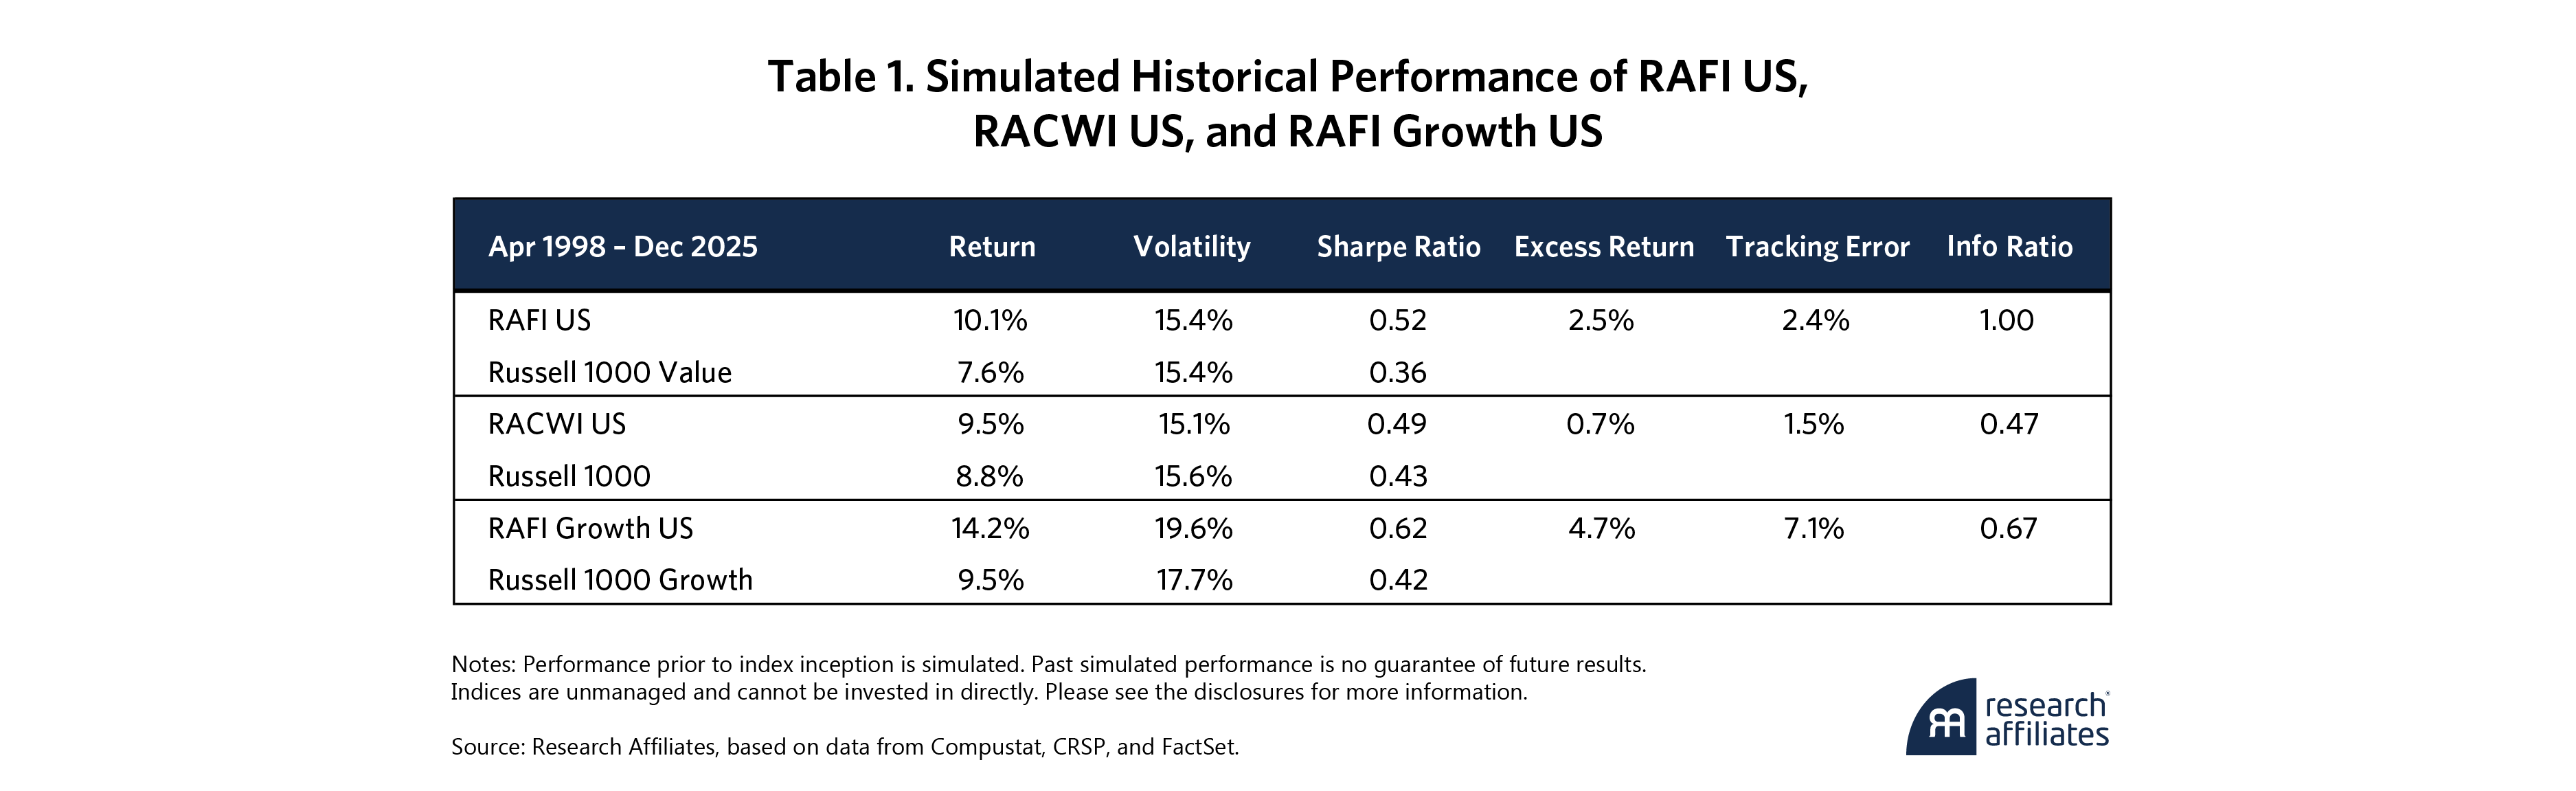
These strategies constitute the Trifecta, our unified framework that reshapes value, core, and growth investing into a potentially better total equity experience. As Table 1 shows, across nearly three decades, all three strategies have performed well, with remarkable statistical significance,6 and offer a robust alternative to traditional CW indexing.
In short, the basic insights that gave rise to RAFI have far more general applications than we initially imagined. Reframing index construction around the real economy – rather than market prices – reveals a simple but surprisingly powerful way to think about equity investing. Our analysis of the underlying dynamics begins by examining how these ideas first took root in RAFI before exploring how they extend naturally across the equity landscape and, ultimately, why they have the potential to work so well.
Trifecta, Step 1: Research Affiliates Fundamental Index
Transformative ideas are often the result of challenging conventional thinking. RAFI is a testament to that insight. For years, much of the investment industry accepted the premise that markets are efficient, and as a consequence, that the market-clearing CW portfolio offers the highest risk-adjusted returns and maximizes investor utility in the context of mean-variance optimality.7 Moreover, if the market is efficient, by extension, alternatives to cap weighting are inherently sub-optimal and therefore wastes of time. This is what academic finance has been teaching for 60 years with varying degrees of stridency depending on the era and institution. It’s no wonder then that the RAFI concept angered so many people when we first proposed it 20 years ago.
The original Fundamental Index transformed our theoretical departure from cap weighting into a practical application through its four measures of company size: sales, cash flow, dividends, and book value. Subsequent variants have applied different metrics, but the core principle, that portfolio construction should be driven by a company’s measured role in the real economy, not by fluctuations in its market price, is unchanged.
The original Fundamental Index transformed our theoretical departure from cap weighting into a practical application through its four measures of company size: sales, cash flow, dividends, and book value.
”This has translated into statistically meaningful outperformance across markets and regions. Table 2 shows the track records of various RAFI strategies from April 1998 through December 2025.8 Over this span, the RAFI US Large Index beat the Russell 1000 Value Index by an annualized 2.5%. With only 2.4% tracking error relative to Russell 1000 Value, this index provided an information ratio of 1.01, and a t-Statistic of 5.
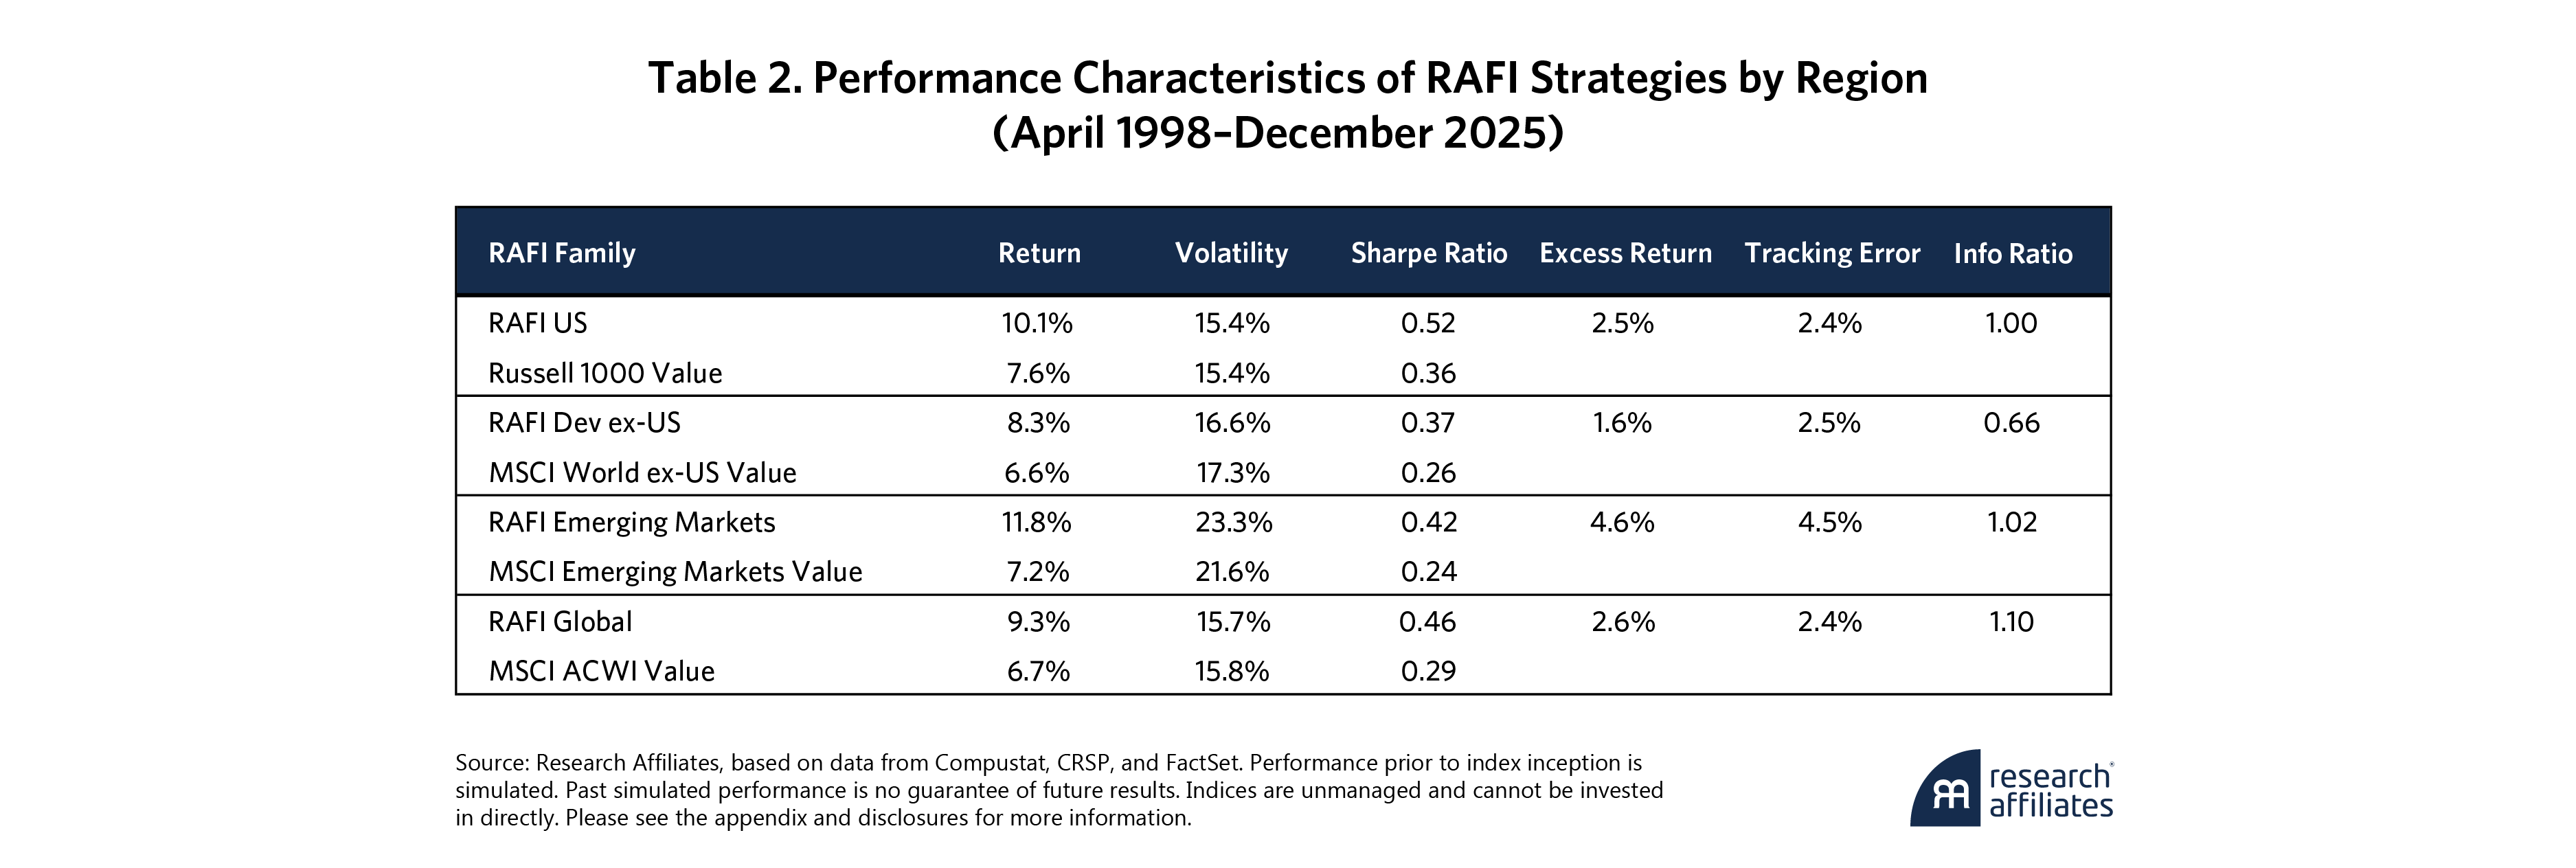
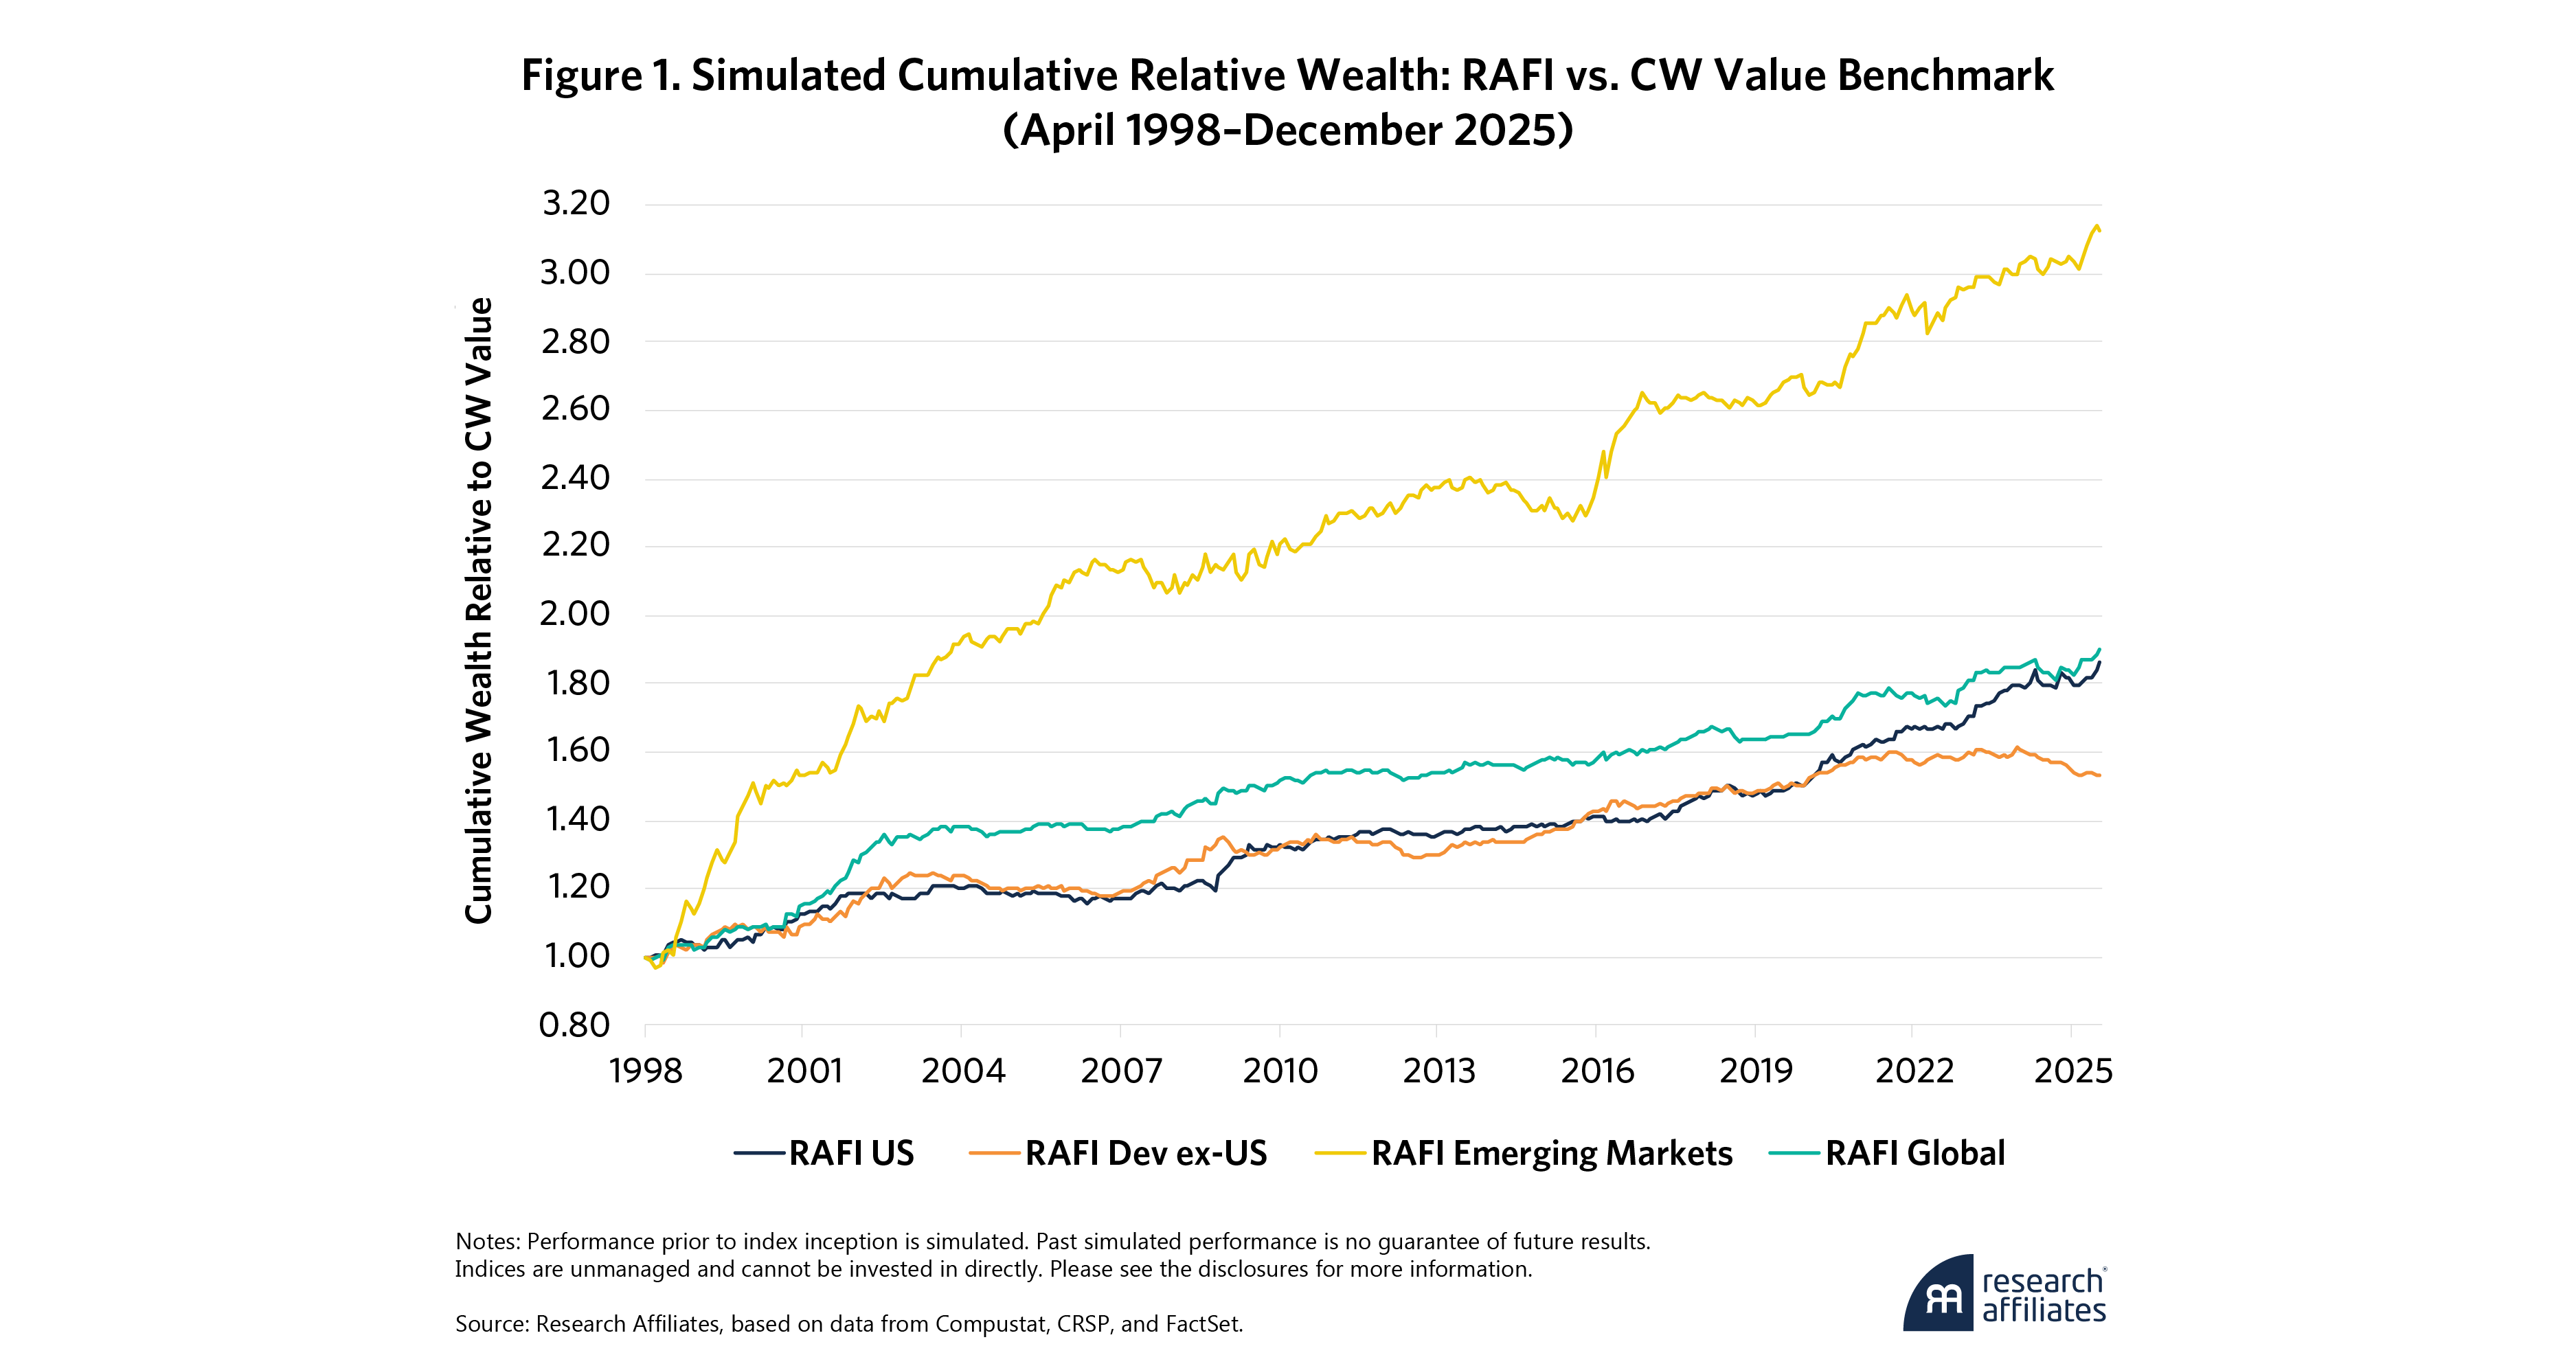
Figure 1 shows the wealth advantage that investing in RAFI has produced over the CW value indices in Table 2. Live RAFI index results span roughly two-thirds of this period, with launch dates ranging from late 2005 to late 2007.9
Several features in Figure 1 stand out. The most obvious is the sheer economic magnitude of the effect. In emerging markets, RAFI compounds to more than three times the total wealth of the cap-weighted value benchmark over the sample. Even in developed markets, with presumably more efficient pricing, the cumulative gains remain substantial, reaching about 60% to 80% in both the US and developed ex-US markets. These results are not incremental; they are the long-run consequence of modest but persistent differences in annual returns and outperformance in roughly three of every four years. Further, their cross-regional ordering feels entirely intuitive. The strongest effects occur in emerging markets, where price signals are noisier, index reconstitutions are costlier, and pricing errors tend to be more pronounced. Developed markets offer fewer such opportunities yet still reward the same discipline over time.
Trifecta, Step 2: Research Affiliates Cap-Weighted Index
CW indices were a remarkable innovation and have continued to improve over the years. But they retain an Achilles heel: While selection rules differ by index provider, the typical catalyst for adding a stock is a substantial run-up in price, leading to a market value that's too large to ignore, while a tumbling price is the proximate cause for most discretionary deletions.10 Traditional CW index additions perform brilliantly before being added to the index but often fall behind in the years just after their inclusion. Deletions perform abysmally before being dropped from the index but on average outperform after elimination.11 RACWI seeks to exclude the performance drag of buying high and selling low when stocks are added or nixed while retaining the market exposure, liquidity, and low turnover of the legacy CW indices.
We construct RACWI by selecting stocks according to measures of the fundamental size of the underlying companies rather than their much more volatile market prices and then weighting the stocks based on their market capitalization or float. In the US market, this CW index has historically delivered long-term outperformance. As both RACWI and legacy CW indices are market-cap weighted, this is entirely attributable to the "difference portfolio," the roughly 5% to 10% of the index where RACWI diverges from its conventional CW peers.
SideBar: Is RACWI Just Active Investing?
There is no unwritten rule that says an index fund must add or nix stocks based on their market cap and that anything else is an active strategy. Indeed, no legacy CW index provider relies purely on market cap for stock selection. For example, S&P Global uses its Index Committee and Russell employs banding to reduce the risk of fast flip-flops. Fundamental selection drives RACWI's alpha. Or, more accurately, we seek to remove the negative alpha from chasing recent momentum in order to add or drop stocks with surging or plunging market caps, respectively. We merely require fundamentals to validate the price move that triggers other index providers to add or drop a stock. Our turnover is also lower than the legacy CW core.12
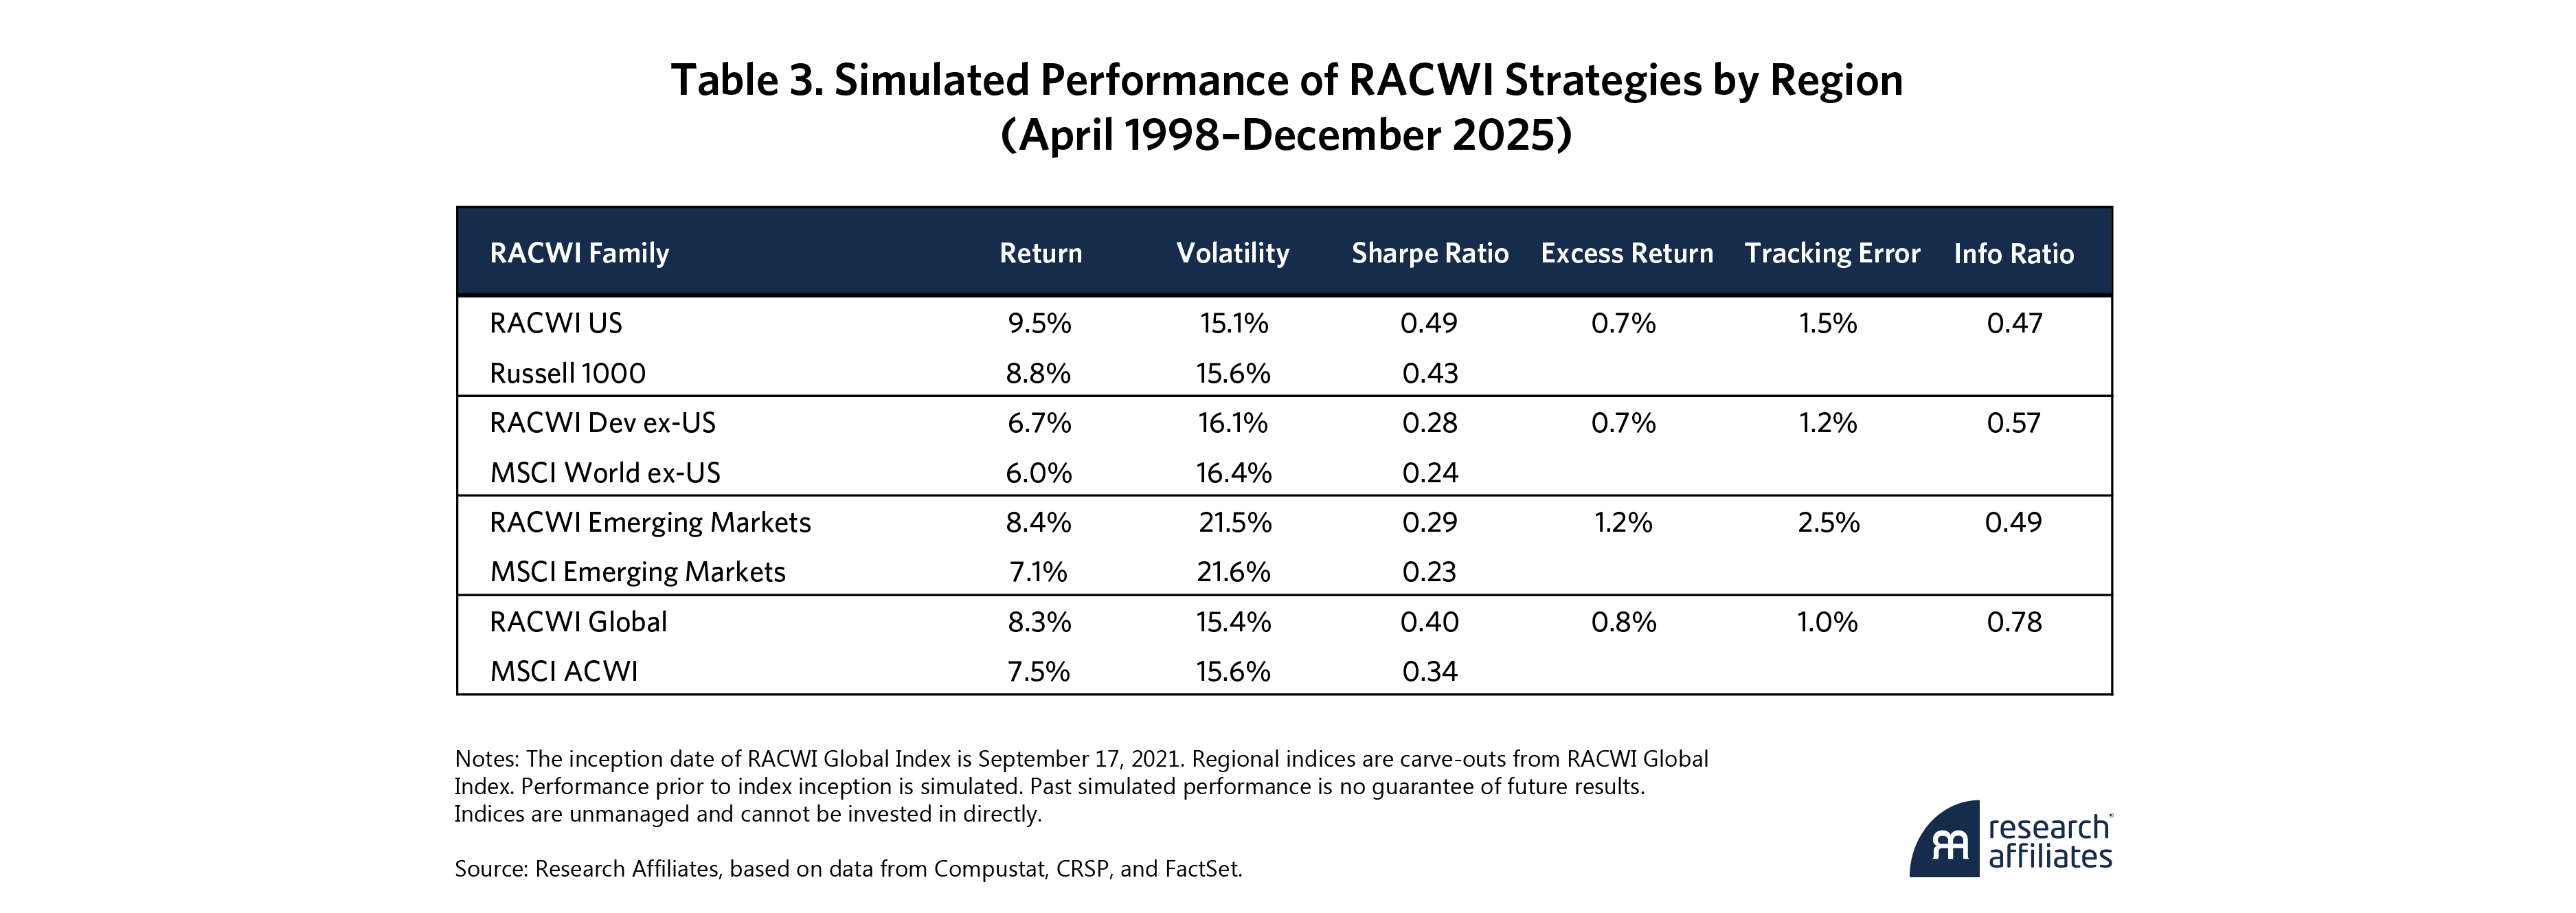
Table 3 shows RACWI’s performance characteristics from April 1998 through December 2025.13 Across all regions, RACWI delivered higher returns than its traditional CW counterparts with virtually indistinguishable volatility.
RACWI US outperformed the Russell 1000 by 0.7% per year. With a tracking error of 1.5%, this excess return delivers an information ratio of 0.47 – a strong result for a strategy with an overwhelmingly market-like construction. Very similar international results provide independent validation, and emerging markets again show the strongest results. Fundamental selection beats market value selection for cap-weighted indices all over the world.
These results are especially compelling because they are achieved without introducing systematic factor tilts or materially altering portfolio risk. The gains do not come from loading on value, size, or momentum. Instead, they arise from a quiet source: avoiding the inherent buy-high, sell-low bias of cap-weighted index reconstitutions. Again, selecting stocks based on fundamental size rather than market capitalization helps RACWI sidestep this drag while otherwise behaving like a conventional market index.
Figure 2 shows how RACWI’s excess returns over Table 3’s benchmark indices compound over time. In the US and developed ex-US markets, RACWI delivers about 20% more cumulative wealth than conventional CW benchmarks over the sample. Emerging markets exhibit an even larger effect, consistent with the greater frictions associated with cap-weighted index reconstitutions.
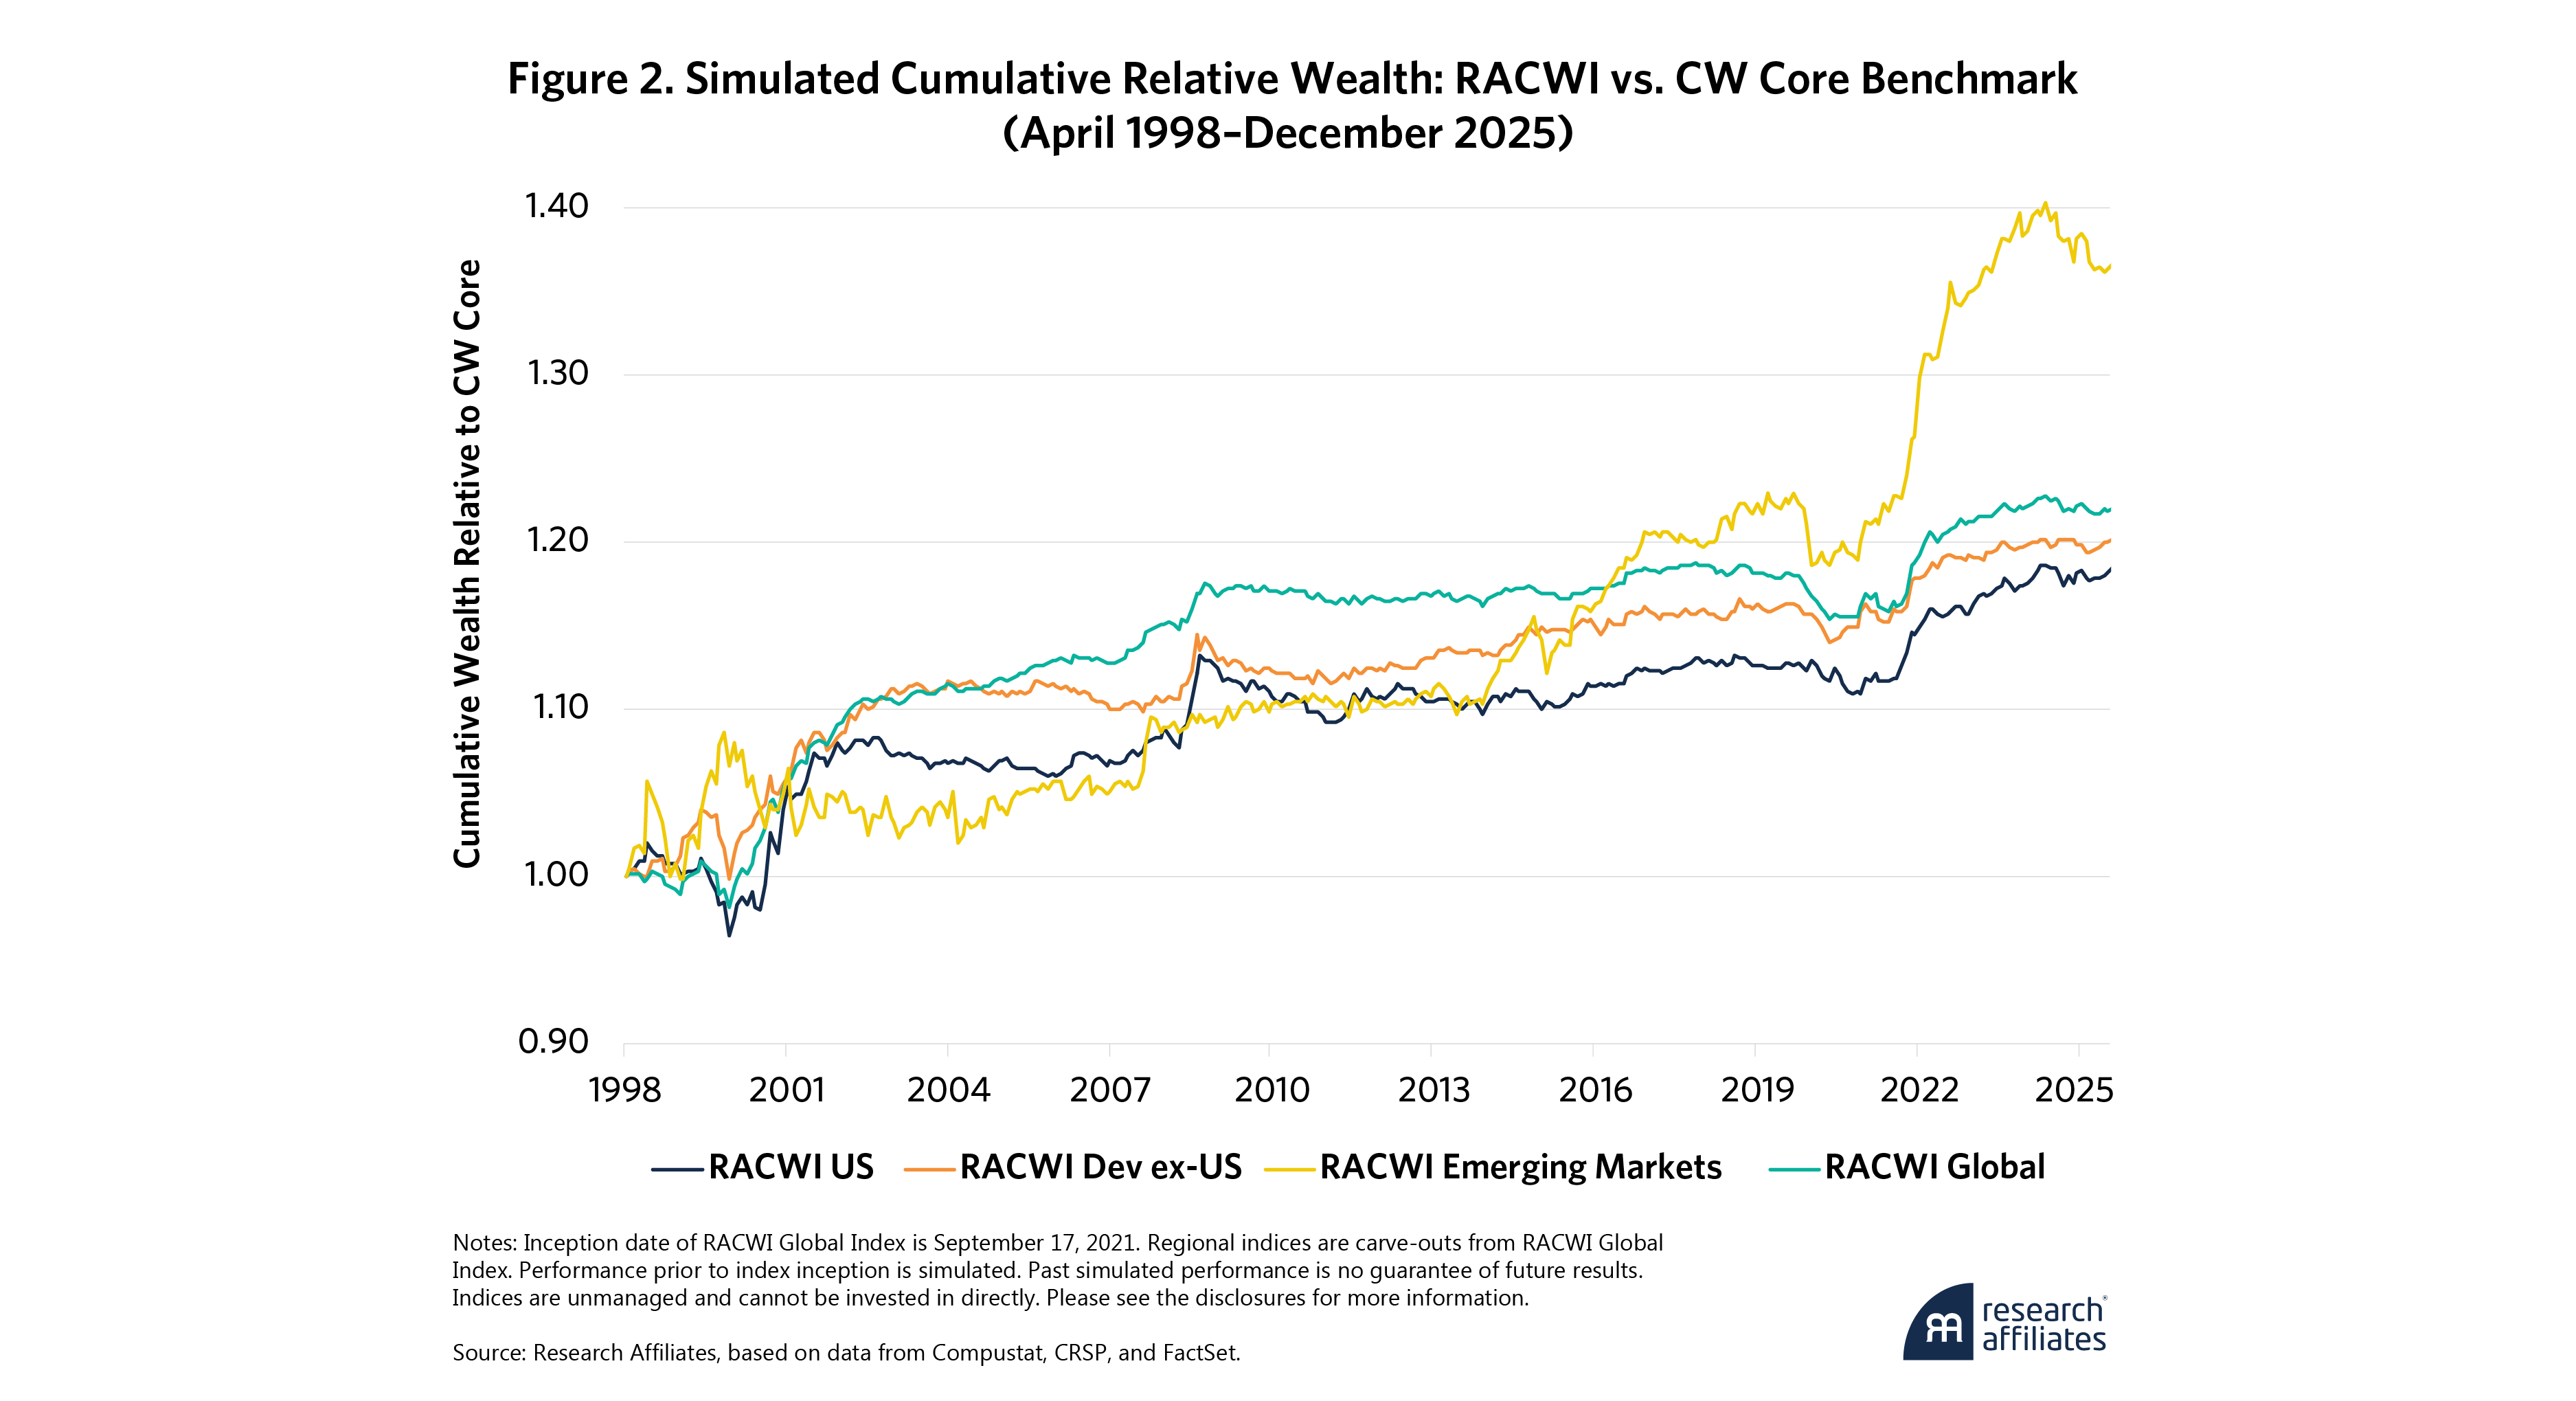
RACWI’s live performance has been especially impressive. Since its September 2021 launch, RACWI US has gained roughly 167 basis points (bps) per annum in excess return relative to the Russell 1000 (and by half as much relative to the S&P 500).14 For a passive CW index, changing only the rules by which stocks enter or leave the index highlights how a small tweak in index construction can produce economically meaningful gains. For investors seeking market-like performance with a modest but persistent edge, RACWI offers a compelling refinement of traditional cap-weighted indexing.
Trifecta, Step 3: RAFI Growth
RAFIG corrects what we believe is a critical flaw in traditional growth investing, which conflates “expensive” with “growth.” The binary duality of growth versus value – where cheap means value and expensive means growth – is nonsense. Expensive does not equate to growth, it equates to expensive. We may be the first to have created a growth index that selects stocks on their percentage growth rates and then weights them on the dollar magnitude of that growth. This is RAFI’s fundamental selection and fundamental weighting reimagined into the growth arena. Big growth stocks get more weight, jointly proportioned to the size of their business and their percentage growth rates, without any regard for valuation multiples or price. With this simple concept, RAFIG may serve growth investors in the next 20 years as well as its RAFI predecessor has served value investors for the previous 20.
The binary duality of growth versus value – where cheap means value and expensive means growth – is nonsense. Expensive does not equate to growth, it equates to expensive.
”Standard growth indices select stocks partly based on price-to-earnings (P/E) ratios or other high valuation multiples as well as projected growth, which is already reflected in share price. This effectively defines growth as high prices. RAFIG selects stocks based on the observed historical growth of the underlying companies; it chooses companies that are really growing rather than those priced for future growth. We construct RAFIG by selecting stocks based on the growth rate of the sales, profitability, and R&D spending of their underlying companies and then weighting by the dollar value of that growth.
SideBar: Why Does the World Need RAFIG, a New Growth Index?
Growth index performance has been stupendous for years. Why mess with a fabulous thing? Growth is classically defined as some mix of expensive, fast-paced growth, and fast expected growth. Why does it have to be expensive to qualify? Why should we weight these stocks in proportion to their valuation multiples? The more expensive the stock, the more it dominates our portfolio – this simply makes no sense. Expensive isn’t growth. Growth is growth. Why include stocks with anemic growth merely because they’re expensive? RAFIG redefines growth to mean GROWTH, and only growth!
Table 4 shows how RAFIG strategies fared by region from April 1998 through December 2025.15 The results are striking. Across all regions, RAFIG substantially outpaced traditional cap-weighted growth benchmarks, delivering large excess returns with only moderately higher volatility and superior risk-adjusted performance.
RAFIG US provided a 14.2% annualized return, beating Russell 1000 Growth by 4.7%. Although its volatility is somewhat higher, 19.6% to 17.7%, the improvement in returns more than compensates, with a 0.62 Sharpe ratio to Russell 1000 Growth’s 0.42. The 7.1% tracking error reflects RAFIG’s deliberate departure from valuation-based growth definitions. RAFIG’s 0.67 information ratio is also impressive.
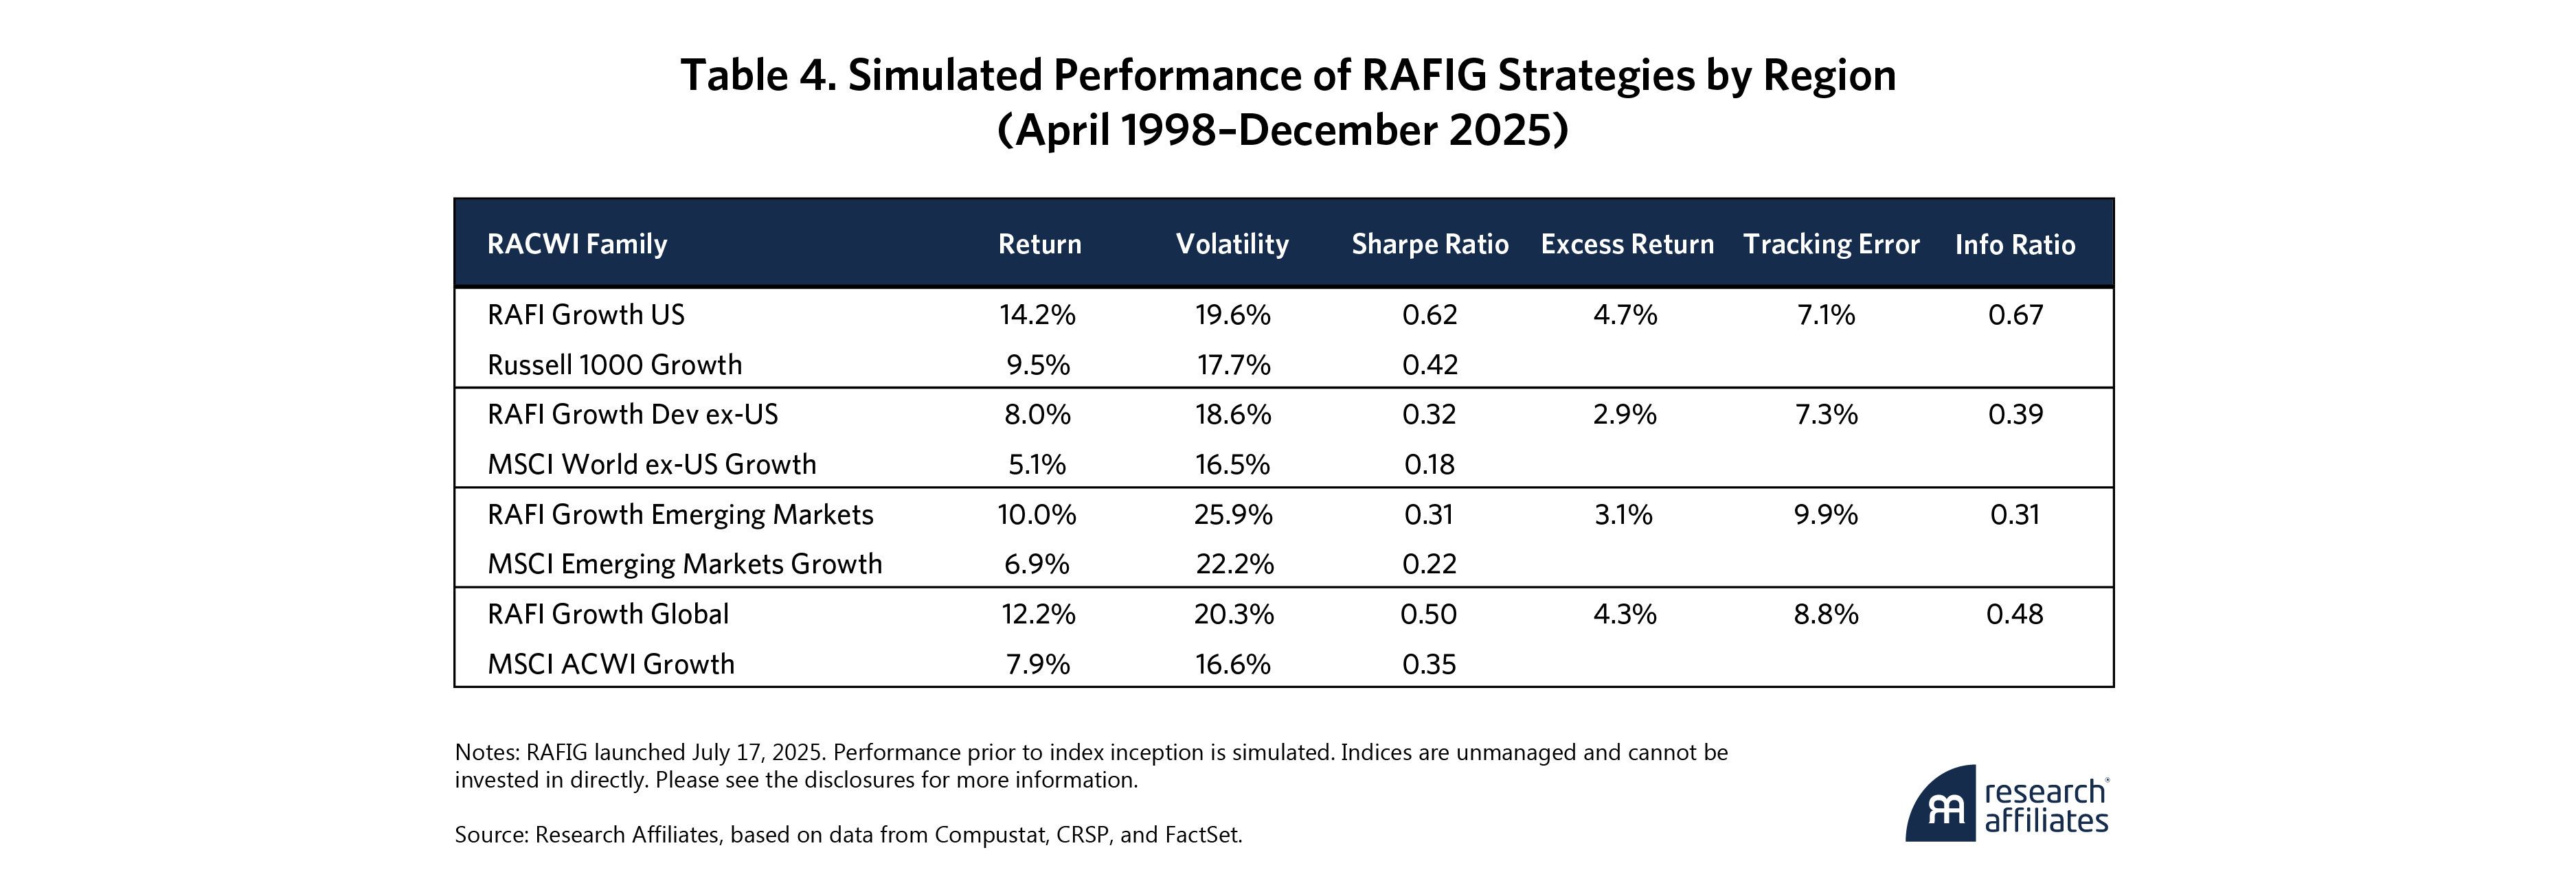
International markets reinforce these findings. Developed ex-US outperformed the MSCI World ex-US Growth index by 2.9% per year, while the excess return of RAFIG Emerging Markets relative to MSCI Emerging Markets Growth reached 3.1% per year. In both cases, the improved returns came with higher – but not disproportionate – volatility and produced consistently better Sharpe ratios than those of legacy growth benchmarks.16
Figure 3 shows the cumulative relative wealth of RAFIG strategies versus the conventional growth benchmarks in Table 4. The patterns are unmistakable. In all regions, RAFIG steadily outperformed cap-weighted growth indices, with no extended reversal periods. In the US and globally, RAFIG compounded to roughly three times the relative wealth of the Russell 1000 Growth benchmark over the full sample. Developed ex-US and emerging markets show similarly persistent advantages, effectively doubling the wealth gains of their conventional peers. These are not short-lived episodes tied to a particular market cycle or style rotation; they reflect the long-run consequence of anchoring growth exposure to actual business expansion rather than to stocks priced for growth.
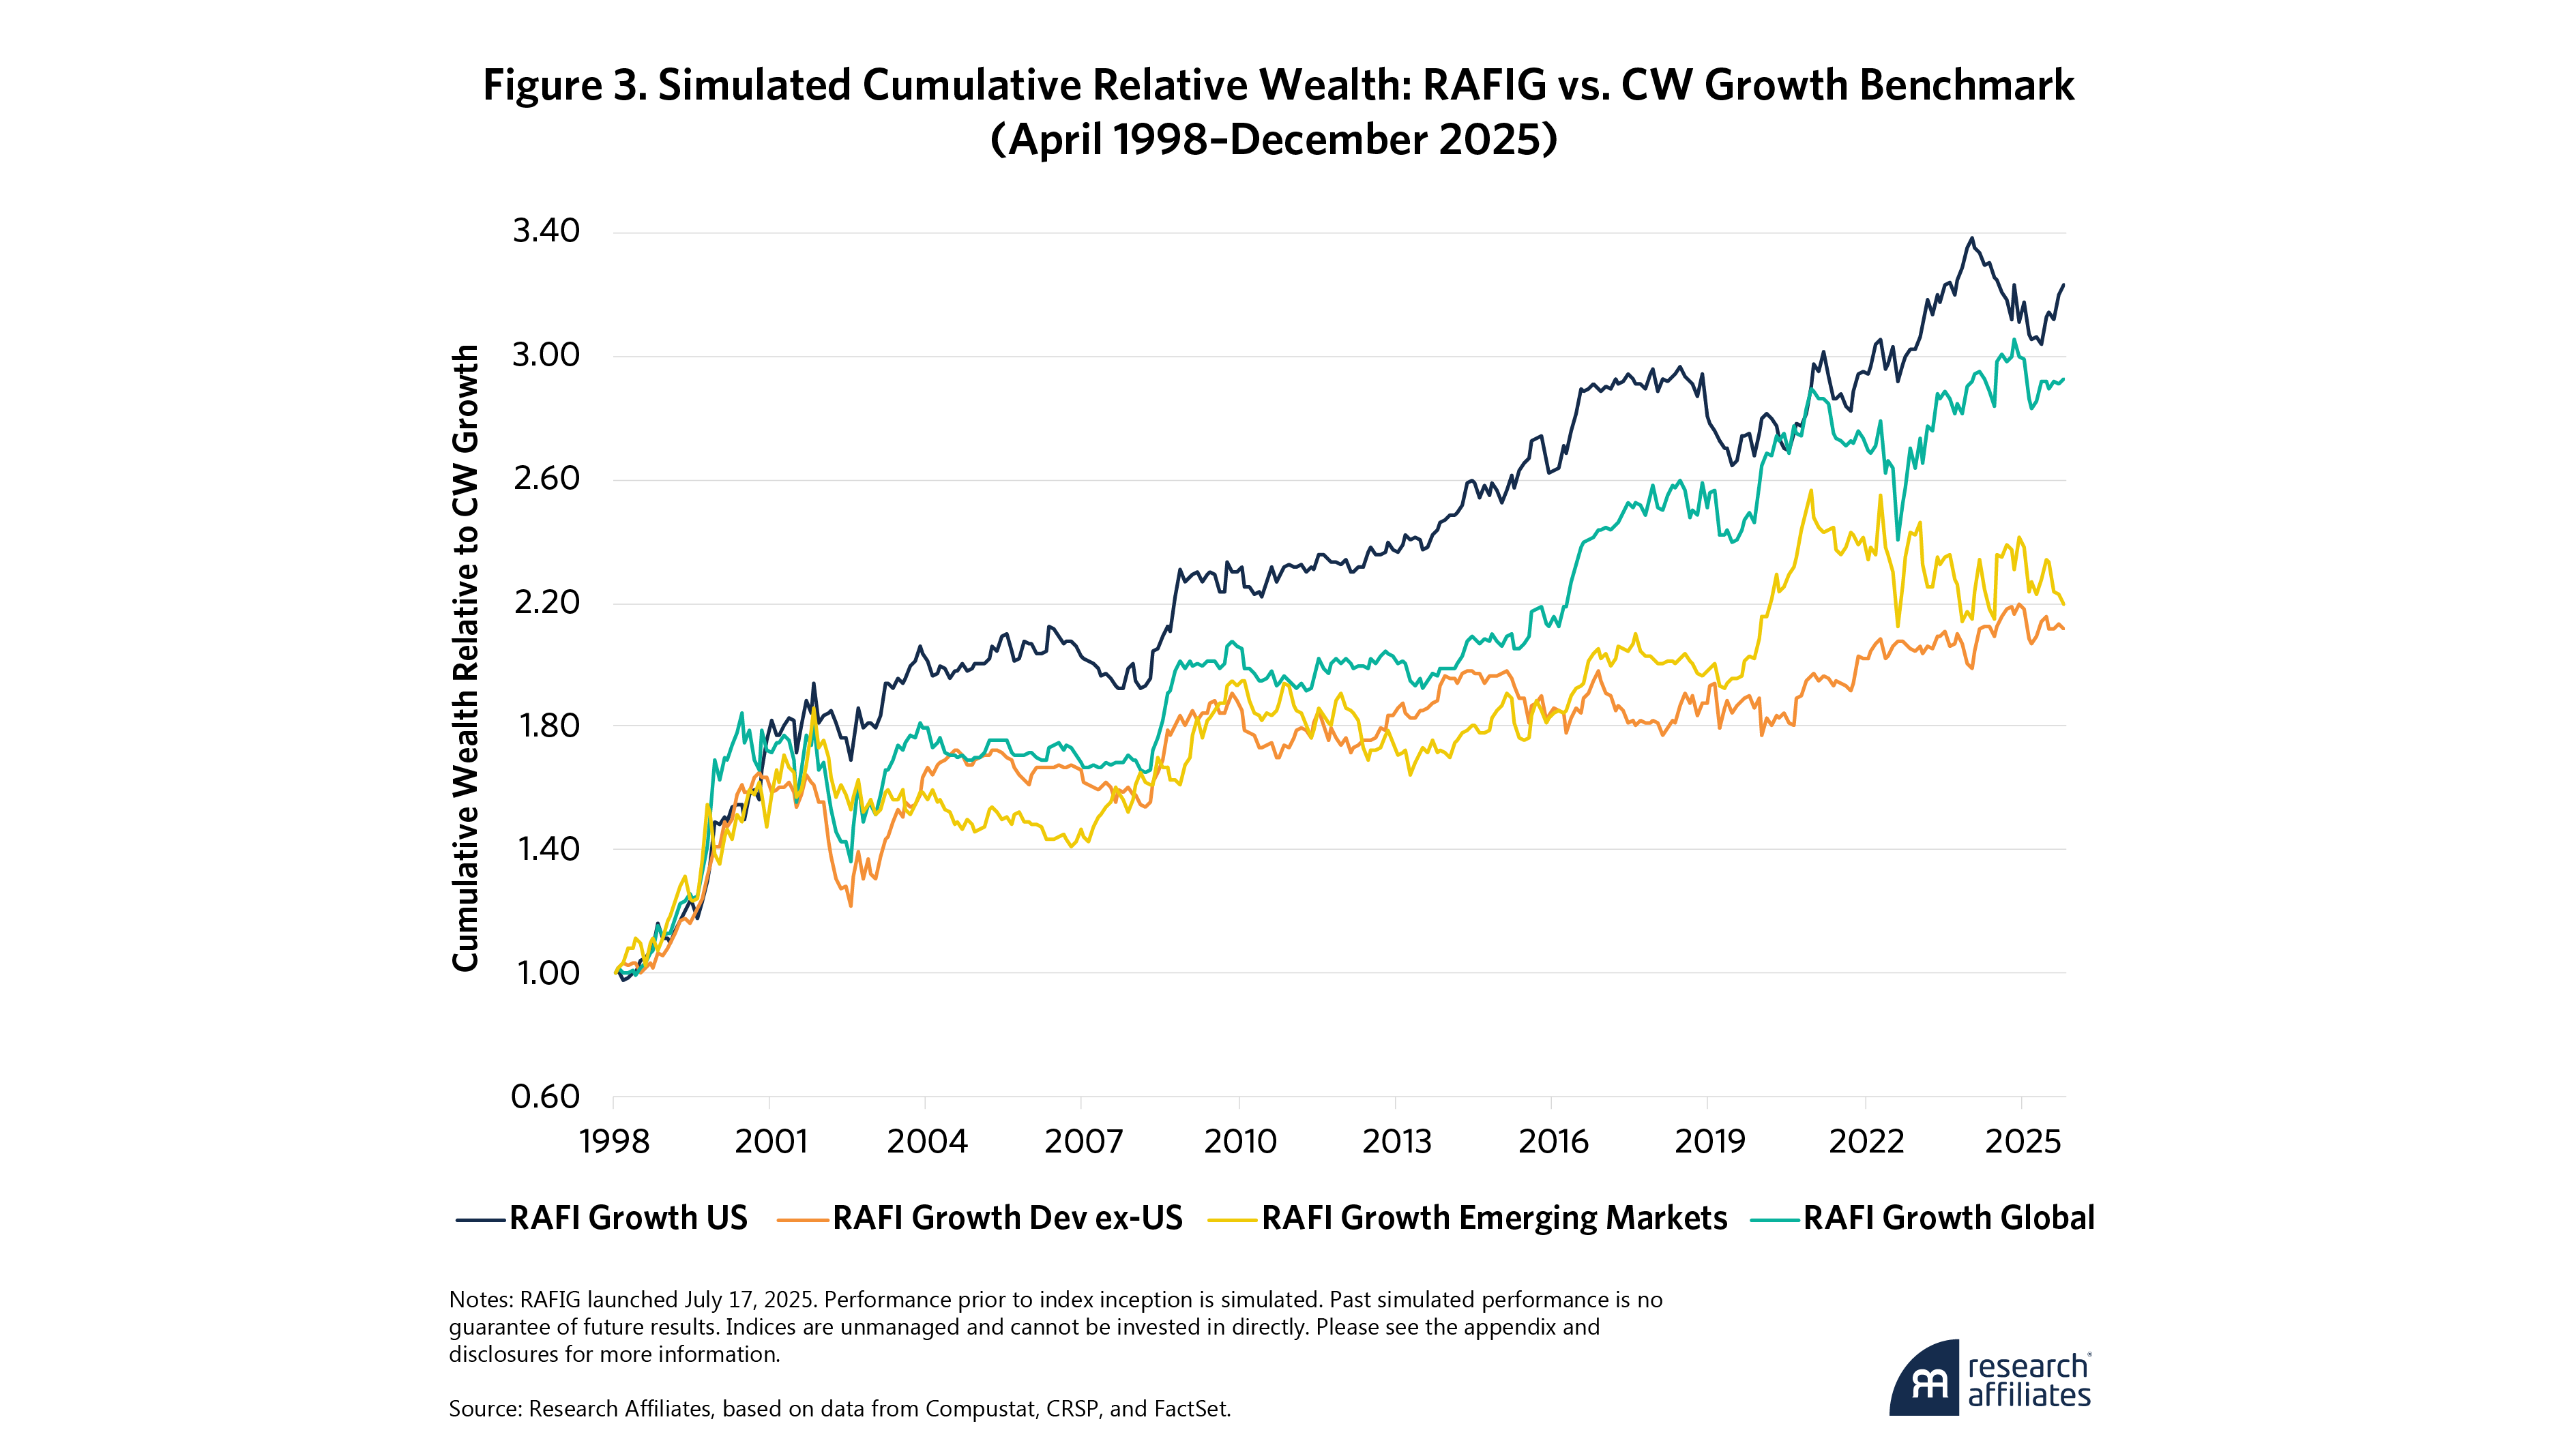
Taken together, Table 4 and Figure 3 demonstrate that redefining growth as an observable economic phenomenon – rather than a collection of expensive stocks – could lead to a comprehensively different and far more effective approach to growth investing. RAFIG seeks to capture growth when it actually occurs, which is often before the market fully recognizes or prices it.
Where Does the Alpha Come From?
Our fundamental selection and fundamental weighting methodology introduces three alphas:
- RAFI earns one alpha from its dynamic value tilt – its value exposure changes over time. To be sure, since 2007, value has had its longest and deepest span of underperformance in at least the past half-century. From its relative performance peak in early 2007 to its nadir in summer 2020, Russell 1000 Value lagged the Russell 1000 by 38%, or roughly 3.5% per annum compounded. That means Russell Growth beat Russell Value by 7% per year over these 13.5 years.17 RAFI’s value tilt tends to be lower when the relative valuation gap between value and growth stocks is narrower than usual and deeper when value stocks are abnormally cheap. When valuations mean revert, this dynamic tilt can help RAFI outperform traditional value indices.
- RAFI and RAFIG each have a rebalancing alpha, trimming stocks that have soared and topping up stocks that have tanked whenever the underlying fundamentals haven’t validated the price moves.
- Each of the three - RAFI, RACWI, and RAFIG - has a selection alpha. Legacy CW indices add stocks as they rise into the top tier of market capitalization and drop them as they fall off. This means that stocks are added as a direct consequence of soaring market valuation and are dropped in response to a plunge in share prices. As Arnott, Brightman, Kalesnik, and Wu detail,18 this has consequences. RAFI waits for the fundamentals to validate that soaring or crashing price. As such, it may be late to the next Nvidia or Tesla, but it is designed to entirely miss the Lucid-like free falls.
Summary Musings . . .
Much of the evidence presented in this paper is necessarily historical and backward-looking. But the results are not fragile curiosities produced by finely tuned parameters or clever modeling. The philosophy that informed RAFI’s creation two decades ago is not a niche, data-mined alternative to capitalization weighting or a better way to build a value index. It is a general framework for equity indexing.
Across value, core, and growth and among regions with very different market structures, the same organizing principle produces consistent and significant improvements. When index construction is a function of the scale and growth of real businesses rather than their market prices, portfolios behave differently. They add companies because their economic footprints have grown, not because their share prices have soared. They reduce exposure when fundamentals falter, not when prices collapse. Prices are inherently volatile and reflect changing sentiments, random asset flows unrelated to company fundamentals, and possible investor miscalculations. By refocusing the indexing process on fundamentals, we can systematically resist the buy-high, sell-low dynamics embedded in price-driven index reconstitutions.
By refocusing the indexing process on fundamentals, we can systematically resist the buy-high, sell-low dynamics embedded in price-driven index reconstitutions.
”What is striking is not only that this framework works, but that it also works in three distinct ways. In RAFI, it delivers a disciplined and dynamic approach to value investing. In RACWI, it refines cap-weighted indexing by improving stock selection while preserving market-like characteristics. In RAFIG, it redefines growth itself – away from valuation multiples and narratives and toward observable, realized business expansion. These three expressions are not separate ideas. This is the Research Affiliates “Trifecta”: a single insight expressed coherently across value, core, and growth.
These results do not depend on forecasting, factor timing, or increasingly elaborate models. They emerge from the deliberate choice to distinguish between prices, which reflect expectations, and fundamentals, which reflect economic reality. That distinction proves powerful across markets, across decades, and across investment styles.
As index investing continues to evolve, it does not have to be towards ever-expanding complexity. Sometimes progress comes from asking simpler questions and answering them consistently. One such answer is to anchor portfolio selection, weighting, or both to the real economy rather than to market prices. This simple principle appears to work far better and far more broadly than conventional wisdom would suggest.
Please read our disclosures concurrent with this publication: https://www.researchaffiliates.com/legal/disclosures#investment-adviser-disclosure-and-disclaimers.


Appendix. A Portrait of Three Leading Strategies
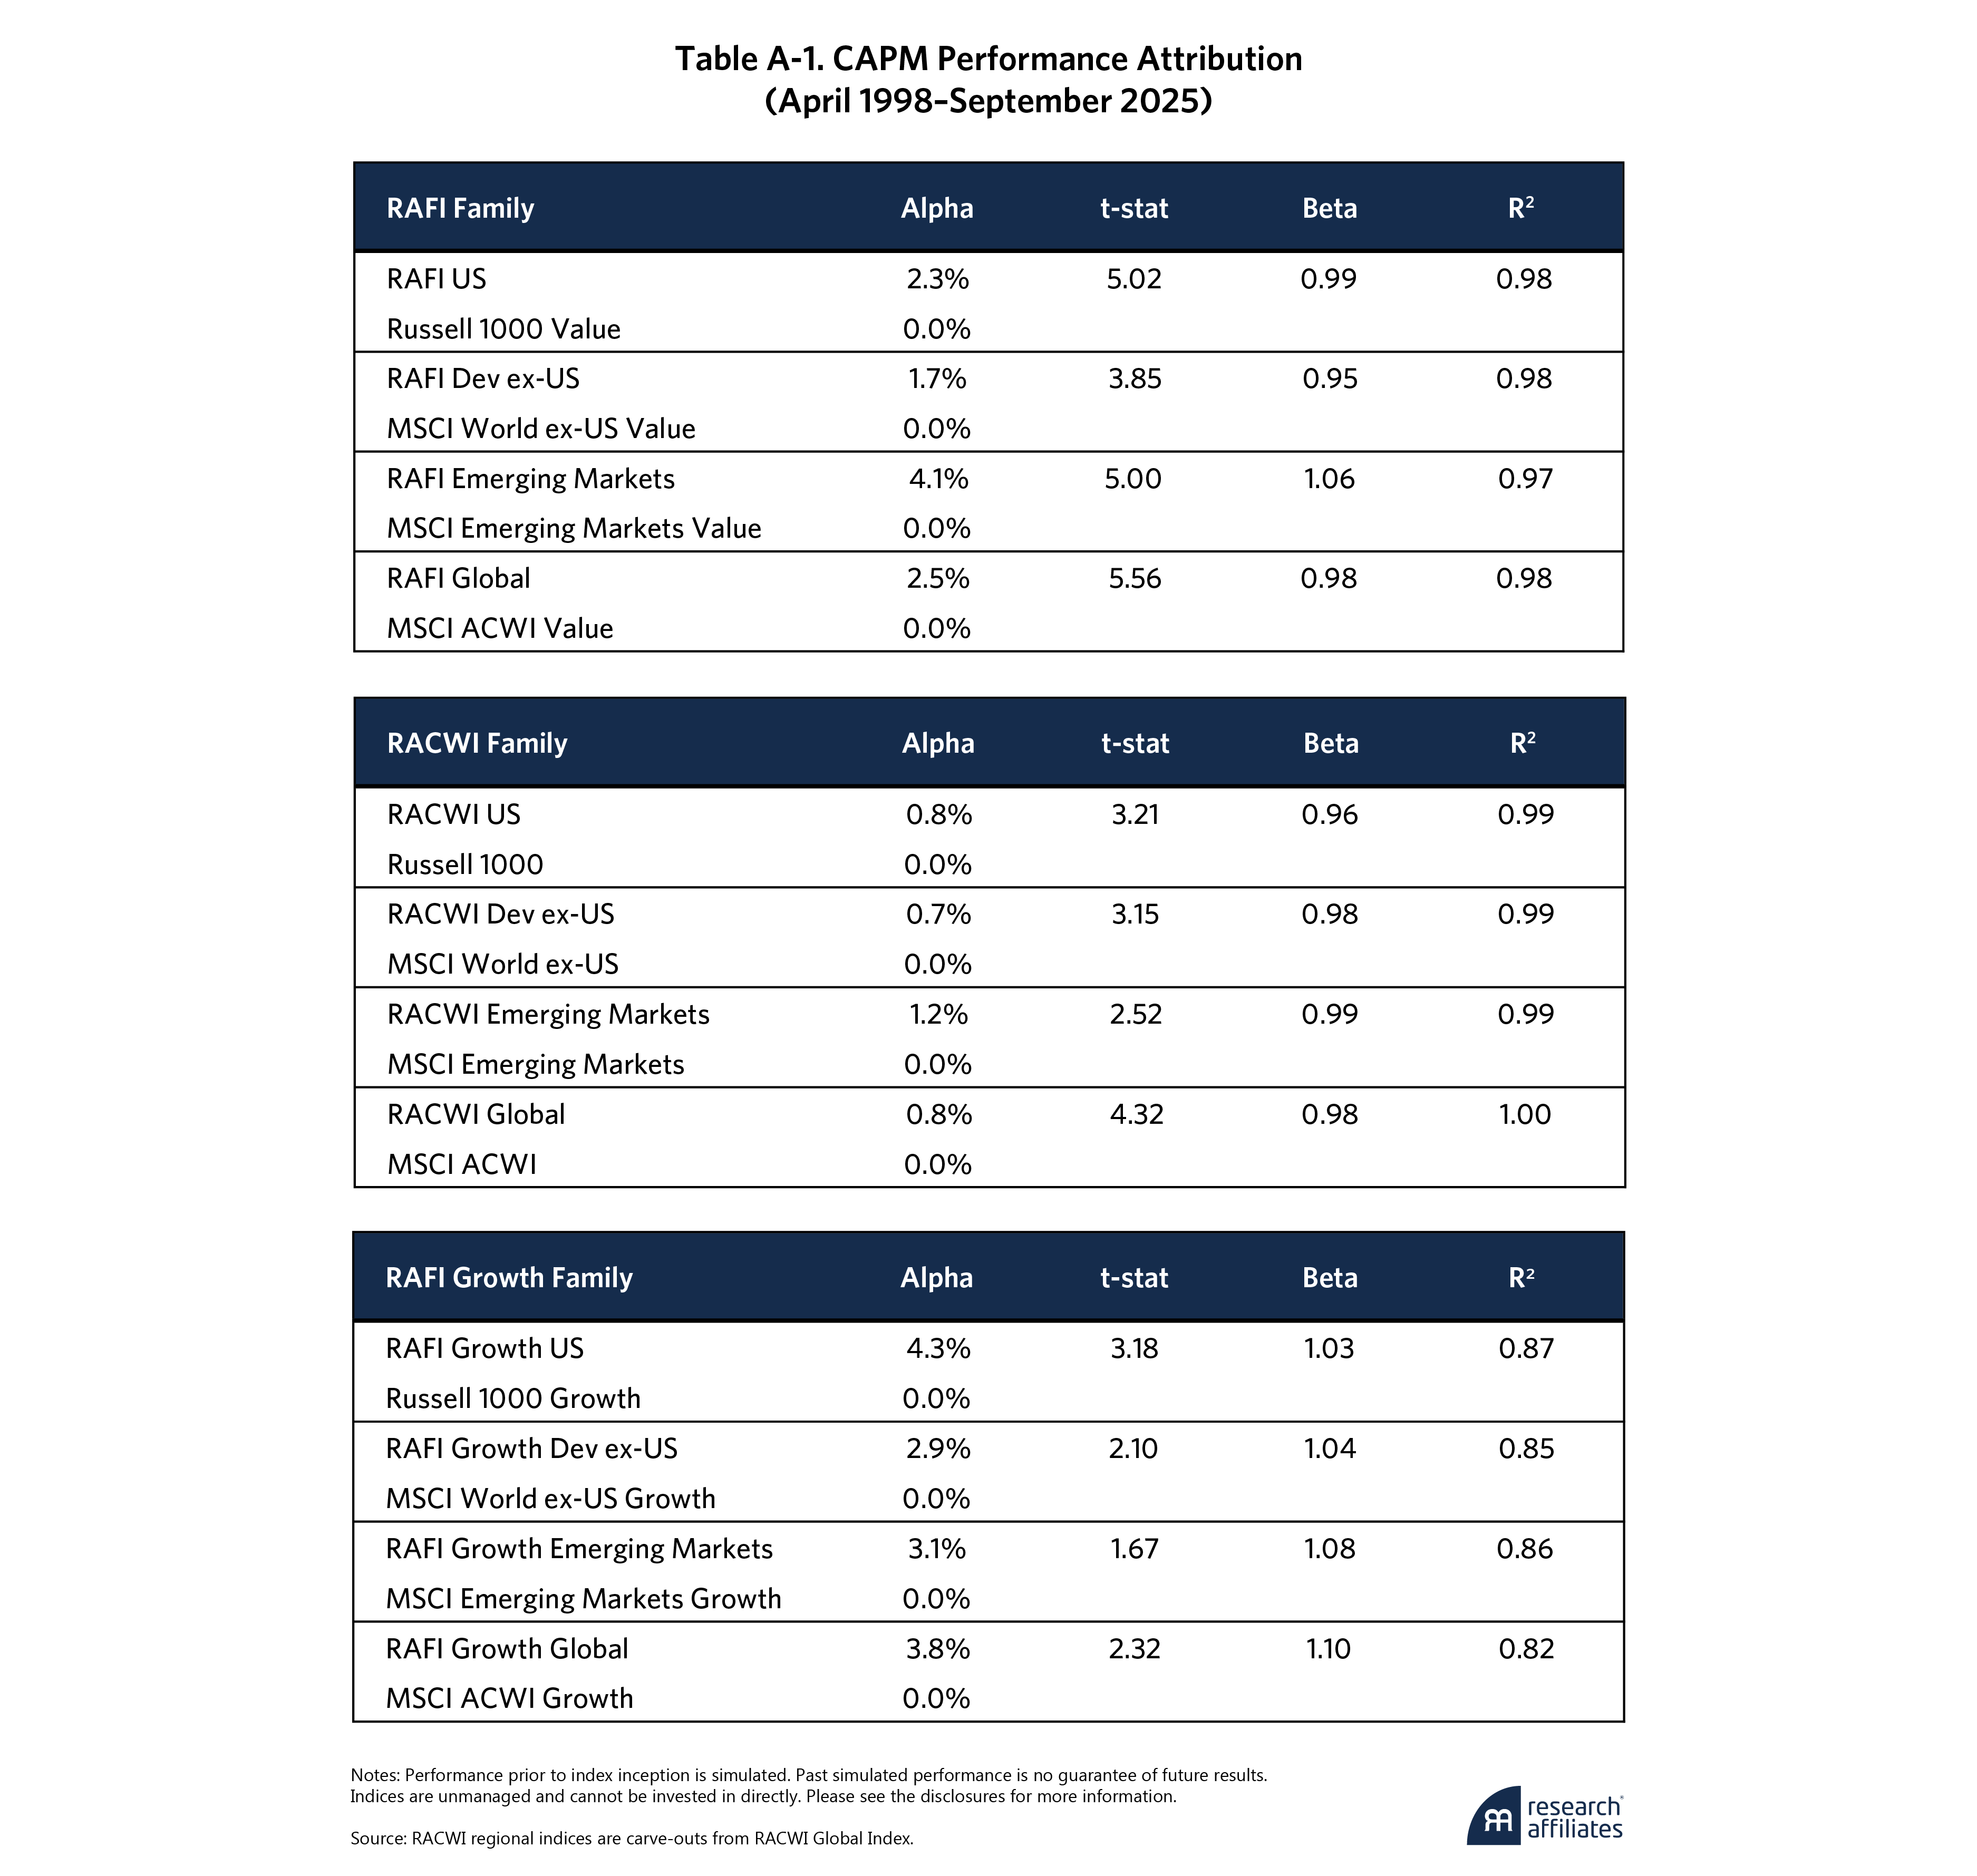
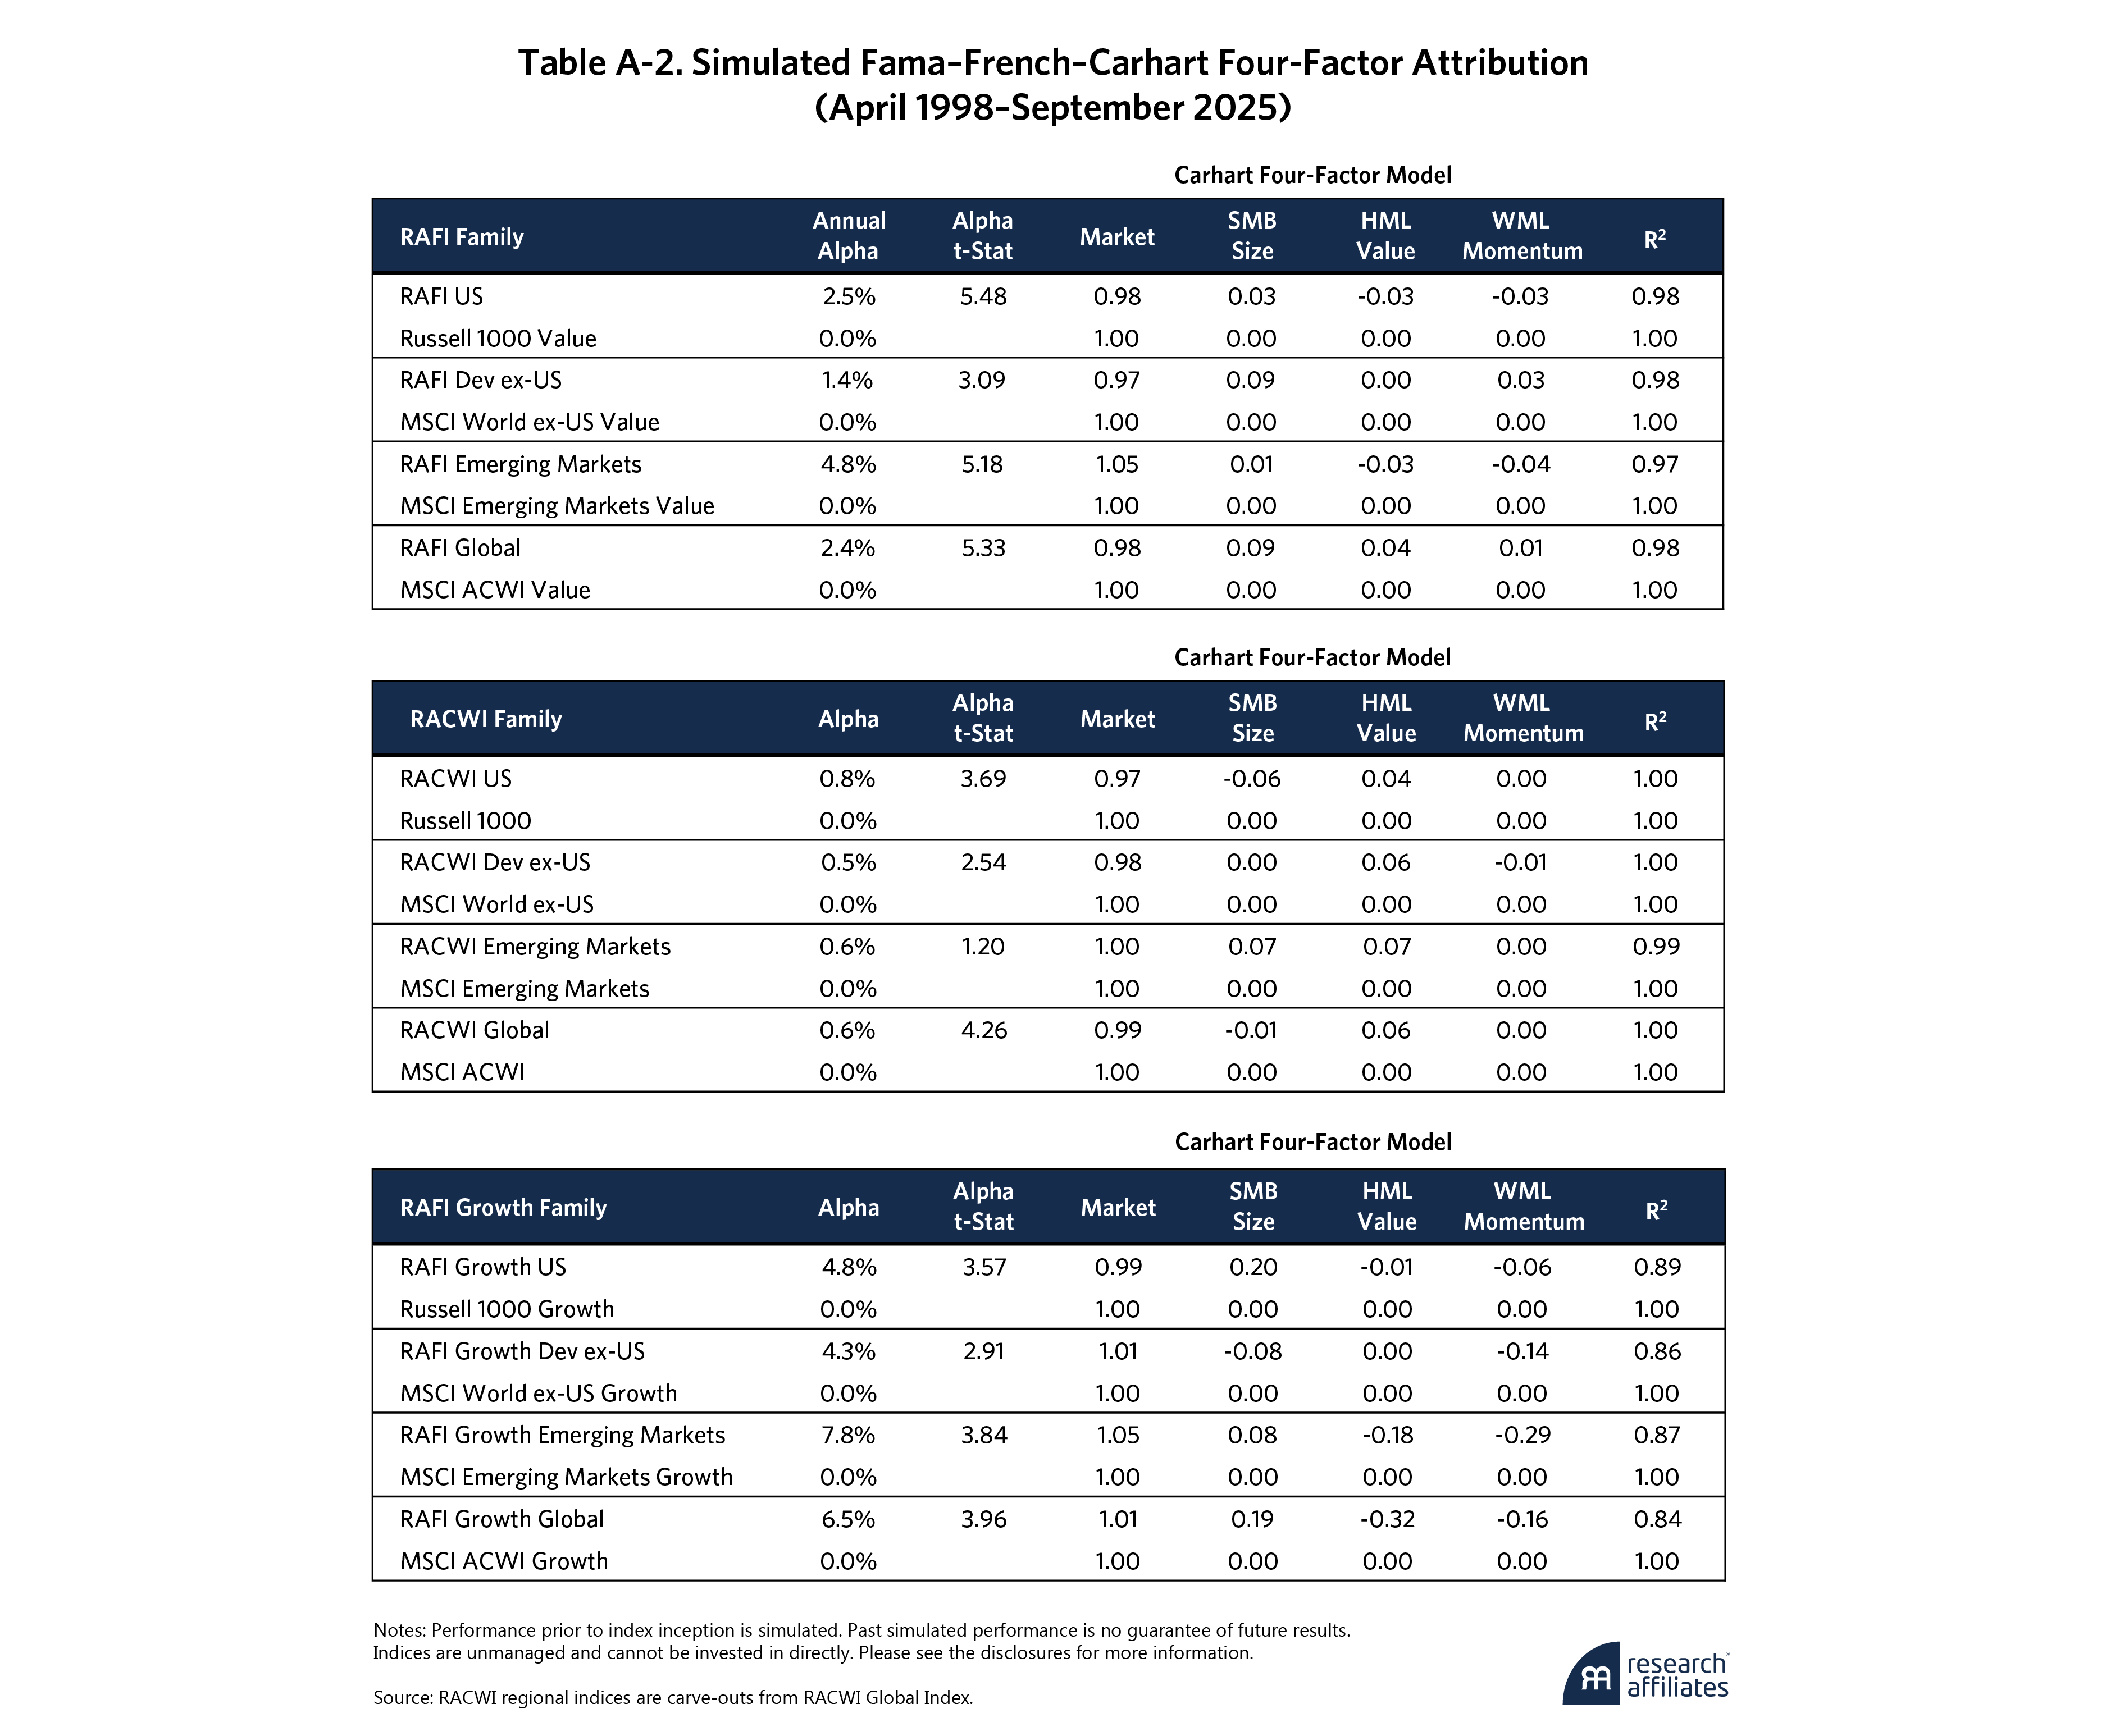
Table A-1 shows that each strategy (RAFI, RACWI, and RAFIG) in all four domains (US, Developed ex-US, EM, and Global) delivers an economically meaningful, statistically significant, and incremental return, with a relatively neutral beta. The only noteworthy outliers are RAFIG, with its slightly elevated beta. Stocks that are actually growing, rather than merely expensive, modestly amplify the volatility of a CW growth index.
As Table A-2 shows, all three strategies in all four domains are remarkably neutral.19 RAFIG has an anti-momentum tilt compared to CW growth indices and is again the one notable exception. It’s not because RAFIG is anti-momentum, but because CW growth doubles down on momentum: CW growth indices add stocks when performance elevates them into the top tier of valuation multiples and drops them when their valuation multiples falter. By not anchoring on price or valuation multiples, RAFIG exhibits less momentum chasing than CW growth indices, and so is anti-momentum relative to CW growth.
To be sure, each of these is not measuring beta or factor loadings relative to the market but relative to the selected benchmark for each strategy. So, RAFIG does not have an anti-momentum bias, selling whatever has gone up. Rather, it lacks the pro-momentum bias of CW growth indices that buy whatever has gone up. Reciprocally, RAFI’s value tilt isn’t anti-value. The –0.03 value factor beta merely means that RAFI US, when compared with the Russell 1000 Value, has a slightly milder value tilt, on average, than the index.
In general, the betas and factor tilts are surprisingly neutral on average over the past 27 years. For RAFI and RAFIG, the factor loadings – style tilts – can vary across a rather wide range. For example, in 2007, RAFI had a distinctly milder value tilt than the CW value index, while in 2025 it offered a much deeper value tilt than the CW Value benchmarks listed, reflecting how extraordinarily cheap value has become compared to growth.
End Notes
1. Polychronopoulos, Ari, Grant Kasser, and Thomas Verghese. “Active Dreams, RAFI Delivers: Active vs. RAFI Performance in Broadening and Narrowing Markets.” Research Affiliates, October 2025.
2. We note the existence of non-price indices, such as equal-weight strategies, before 2005.
3. Here and throughout this paper, unless we specifically indicate that results are from live published indices, they are simulations – backtests – of our principles of fundamental selection and fundamental weighting. For RAFI live results, we use FTSE-RAFI, Russell RAFI, and our own indices, which launched in November 2005, February 2011, and January 2017 respectively. We equally blend the available variants from the relevant launch dates. RACWI and RAFIG launched in September 2021 and July 2025, respectively. Live results may not be representative of performance across a full market cycle, and outcomes over longer horizons could differ materially as market conditions evolve. This is particularly notable for RACWI and RAFIG, which have relatively short live performance periods relative to the back-tested period.
4. For our book, “The Fundamental Index,” Charles Schwab himself was kind enough to opine on the book cover “Indexing is a powerful force in the investing industry, and I’m not a man to question success—but to my mind, the Fundamental Index© method represents too good of an improvement to ignore.” Davidow (2018) expands on this. [Davidow, Anthony B. 2018. “Better Together: Fundamental & Market-Cap Indices.” Schwab Center for Financial Research, Charles Schwab & Co., Inc.]
5. See Arnott, Robert D., Chris Brightman, Campbell R. Harvey, Que Nguyen, and Omid Shakernia. (2025). "Fundamental Growth." SSRN.
6. Importantly, the strong performance of the Trifecta strategies is not explained away by conventional factor exposures. As the appendix shows, Fama–French–Carhart four-factor regressions deliver positive alphas across all nine regional strategies we examine, with eight of the nine alphas achieving statistical significance. The exception, RACWI Emerging Markets, has positive estimated alpha, but it is not statistically distinguishable from zero. These outcomes support the argument that the return advantages arise from fundamental selection and weighting and reflect a distinct source of return. See the appendix for detailed attribution results.
7. We appreciate the contributions to our thinking from the efficient market hypothesis (EMH) and capital asset pricing model (CAPM). Along with Harry Markowitz’s modern portfolio theory, these are the critical foundations of modern finance. We only question the all-too-common temptation to treat these models as immutable laws rather than powerful and useful approximations of the real world. For a deeper discussion, see Arnott, Robert. “An Overwrought Orthodoxy.” Institutional Investor, December 2006, at https://www.researchaffiliates.com/content/dam/ra/publications/pdf/p-2006-dec-an-overwrought-orthodoxy.pdf
8. RAFI US Large refers to the Research Affiliates Fundamental Index® (RAFI®) US. Similarly, RAFI Developed ex-US and RAFI Emerging Markets refer to the Research Affiliates Fundamental Index® Developed ex-US and Research Affiliates Fundamental Index® Emerging Markets, respectively. These terms are used interchangeably throughout this article.
9. The first published RAFI indices were the FTSE RAFI US 1000 and FTSE RAFI Developed ex-US 1000, which debuted in December 2005. The FTSE-RAFI Emerging Markets launched in March 2007 and the FTSE RAFI All World 3000 in December 2007. In each case, live strategies launched several months before the published index.
10. Most deletions are non-discretionary. Basically, a stock ceases to exist, whether due to merger, acquisition, or bankruptcy.
11. Arnott, Rob, and Forrest Henslee. “Nixed: The Upside of Getting Dumped.” Research Affiliates, August 2024.
12. See Arnott, Robert D., Chris Brightman, Xi Liu, and Que Nguyen. 2023. “Reimagining Index Funds.” Journal of Investment Management 21 (4), 15-31.
13. RACWI US refers to the Research Affiliates Cap-Weighted Index® (RACWI®) US. Similarly, RACWI Developed ex-US and RACWI Emerging Markets refer to the Research Affiliates Cap-Weighted Index® Developed ex-US and Research Affiliates Cap-Weighted Index® Emerging Markets, respectively. These terms are used interchangeably throughout this article.
14. Research Affiliates, based on data from Compustat, CRSP, and FactSet.
15. RAFIG US refers to the Research Affiliates Fundamental Growth Index® (RAFIG®) US. Similarly, RAFIG Developed ex-US and RAFIG Emerging Markets refer to the Research Affiliates Fundamental Growth Index® Developed ex-US and Research Affiliates Fundamental Growth Index® Emerging Markets, respectively. These terms are used interchangeably throughout this article.
16. Consistent with these results, four-factor attribution tests reported in the appendix show that RAFIG delivered large and statistically significant positive alphas across regions, indicating that its excess returns are not explained by standard market, size, value, or momentum exposures.
17. See Arnott, Robert D., Campbell R. Harvey, Vitali Kalesnik, and Juhani T. Linnainmaa. 2021. “Reports of Value’s Death May Be Greatly Exaggerated.” Financial Analysts Journal 77 (1), 44–67. The entire shortfall was due to value stocks as a group becoming more expensive relative to growth stocks, which cannot continue indefinitely...
18. Arnott, Robert D., Christopher Brightman, Vitali Kalesnik, and Lillian Wu. 2023. “Earning Alpha by Avoiding the Index Rebalancing Crowd.” Financial Analysts Journal 79 (2), 76–97.
19. Factor attribution is conducted using the Fama–French–Carhart four-factor model. The size (SMB), value (HML), and momentum (UMD) factors are taken from the published Fama–French regional factor returns corresponding to each market. All regressions are estimated over the full sample period reported in the table. For each strategy, the market factor is defined as the excess return over the risk-free rate of the stated regional benchmark (e.g., Russell 1000 Value, Russell 1000, MSCI World ex-US, MSCI Emerging Markets, and MSCI AWCI), rather than the conventional Fama–French market portfolio. This is the reason that RAFI, for example, does not show a large HML value factor loading. This approach ensures that estimated alphas and factor tilts reflect performance relative to the appropriate investable benchmark.
Important Information
The material contained in this document is for informational purposes only and is not intended as an offer or solicitation for the purchase or sale of any security or financial instrument, nor is it advice or a recommendation to enter into any transaction. Research Affiliates LLC (“RA”) and RAFI Indices, LLC (“RI”), their affiliates, agents, and each of their respective officers, directors, employees, agents, representatives and licensors (collectively “Research Affiliates”) does not make any warranties, express or implied, to anyone regarding the information provided herein, including, without limitation, any warranties with respect to the timeliness, sequence, accuracy, completeness, currentness, merchantability, quality or fitness for a particular purpose or any warranties as to the results to be obtained by any third-party in connection with the use of the information. Nothing contained in this material is intended to constitute legal, tax, securities or investment advice, nor an opinion regarding the appropriateness of any investment, nor a solicitation of any type. The general information contained in this material should not be acted upon without obtaining specific legal, tax and investment advice from a registered professional. Investors should be aware of the risks associated with data sources and quantitative processes used to create the content contained herein or the investment management process. Errors may exist in data acquired from third party vendors, the construction or coding of indices or model portfolios, and the construction of the spreadsheets, results or information provided. Research Affiliates takes reasonable steps to eliminate or mitigate errors, and to identify data and process errors so as to minimize the potential impact of such errors, however Research Affiliates cannot guarantee that such errors will not occur. Use of this material is conditioned upon, and evidence of, the user’s full release of Research Affiliates from any liability or responsibility for any loss or damage, direct, indirect or consequential, arising from or related to (i) any inaccuracy or incompleteness in, errors or omissions in the information or (ii) any decision made or action taken by any third party in reliance upon this information. Research Affiliates shall not be liable to anyone for loss of business revenues, lost profits or any indirect, consequential, special or similar damages whatsoever, whether in contract, tort or otherwise, even if advised of the possibility of such damages.
Past performance is not indicative of future results. Certain performance information presented represents simulated performance or performance based on combined simulated index data (pre-index launch) and live index data (post-index launch). Past simulated performance is no guarantee of future performance and does not represent actual performance of an investment product based on an index. No allowance has been made for trading costs, management fees, or other costs associated with asset management, as the information provided relates only to the index itself. Performance data includes reinvestment of all dividends and income. Indices are unmanaged and cannot be invested in directly. Actual investment results will differ. The simulated data may have under- or over- compensated for the impact, if any, of certain market factors. Simulated returns may not reflect the impact that material economic and market factors might have had on an investor’s decision making. Simulated data is subject to the fact that it is designed with the benefit of hindsight. Simulated returns carry the risk that actual performance is not as depicted due to inaccurate predictive modeling. Simulated returns cannot predict how an investment strategy will perform in the future. Investors may experience loss of all or some of their investment.
The trademarks Fundamental Index™, RAFI™, Research Affiliates Equity™, RAE™ and the Research Affiliates™ trademark and corporate name and all related logos are the exclusive intellectual property of RA and in some cases are registered trademarks in the U.S. and other countries. Various features of the Fundamental Index methodology, including an accounting data-based non-capitalization data processing system and method for creating and weighting an index of securities, are protected by various patents of RA. (See applicable US Patents, Patent Publications and protected trademarks located at https://www.researchaffiliates.com/legal/disclosures#patent-trademarks-and-copyrights, which are fully incorporated herein.) Any use of these trademarks, logos or patented methodologies without the prior written permission of RA is expressly prohibited. RA reserves the right to take any and all necessary action to preserve all of its rights, title, and interest in and to these marks or patents.
RA is an investment adviser registered with the U.S. Securities and Exchange Commission (SEC) under the Investment Advisers Act of 1940. RA’s registration as an investment adviser does not imply a certain level of skill or training. RA does not offer or sell any securities, commodities or derivative instruments or products. Any such business may only be conducted through registered or licensed entities and individuals permitted to do so within the respective jurisdiction and only in conjunction with legally required disclosure documents and regulatory filings. RA is not a broker-dealer and does not effect transactions in securities.
All MSCI returns information provided under license through MSCI. Copyright MSCI. Without prior written permission of MSCI, this information and any other MSCI intellectual property may only be used for your internal use, may not be reproduced or re-disseminated in any form and may not be used to create any financial instruments or products or any indices. This information is provided on an “as is” basis, and the user of this information assumes the entire risk of any use made of this information. Neither MSCI nor any third party involved in or related to the computing or compiling of the data makes any express or implied warranties, representations or guarantees concerning the MSCI index-related data, and in no event will MSCI or any third party have any liability for any direct, indirect, special, punitive, consequential or any other damages (including lost profits) relating to any use of this information.
© 2026 Research Affiliates, LLC and RAFI Indices, LLC. All rights reserved. Duplication or dissemination prohibited without prior written permission.
