
The shift away from the low-rate, low-inflation environment of the past 25 years continued in 2025 amid the growing realization that a new regime of higher nominal growth, persistent inflation, and greater volatility has begun.
Developed markets face historically high debt levels and structural deficits, which reduces fiscal and monetary policy flexibility. The government’s ability to stimulate growth is increasingly constrained, while inflationary forces persist.
Starting valuations remain an important indicator of long-term future returns. With U.S. equities priced for perfection, less-expensive non-U.S. stocks, emerging market bonds, and alternative strategies are positioned for better long-term prospects.
Investors may want to prepare for a decade of higher nominal rates, fiscal fragility, and episodic volatility. Navigating this next market cycle might require global diversification, inflation-aware allocations, and a disciplined valuation-based approach.
Introduction
Ten years from now, we will look back on 2025 as a significant transition year. While there were no major market crises reminiscent of the Global Financial Crisis or even the COVID-19 pandemic, 2025 did feel like the tipping point for the next investment cycle. We moved away from anticipating the return of the ultra-low interest rates, low inflation, and ample central bank liquidity environment that defined the past quarter-century and toward accepting higher inflation, higher nominal rates, and increased volatility as the new normal. Nevertheless, investment cycles rarely start and stop at the same moment in time; they tend to overlap. After all, investment cycles are the sum of all individual actions, some of which are on the leading edge that this time is different and others are premised on past conditions resurfacing. So, while some circumstances evolve, indicating the opportunity for future change, some stay the same even as the old cycle dies off.
Create your free account or log in to keep reading.
Register or Log in
In this article, we look both back and forward, first at the 2025 capital markets to analyze not just what happened but also how it fits in the historical context and what we believe it means for 2026 and beyond. We then pivot to our return expectations for major asset classes in the next decade. These are anchored in current valuations and will serve as a compass for the road ahead.
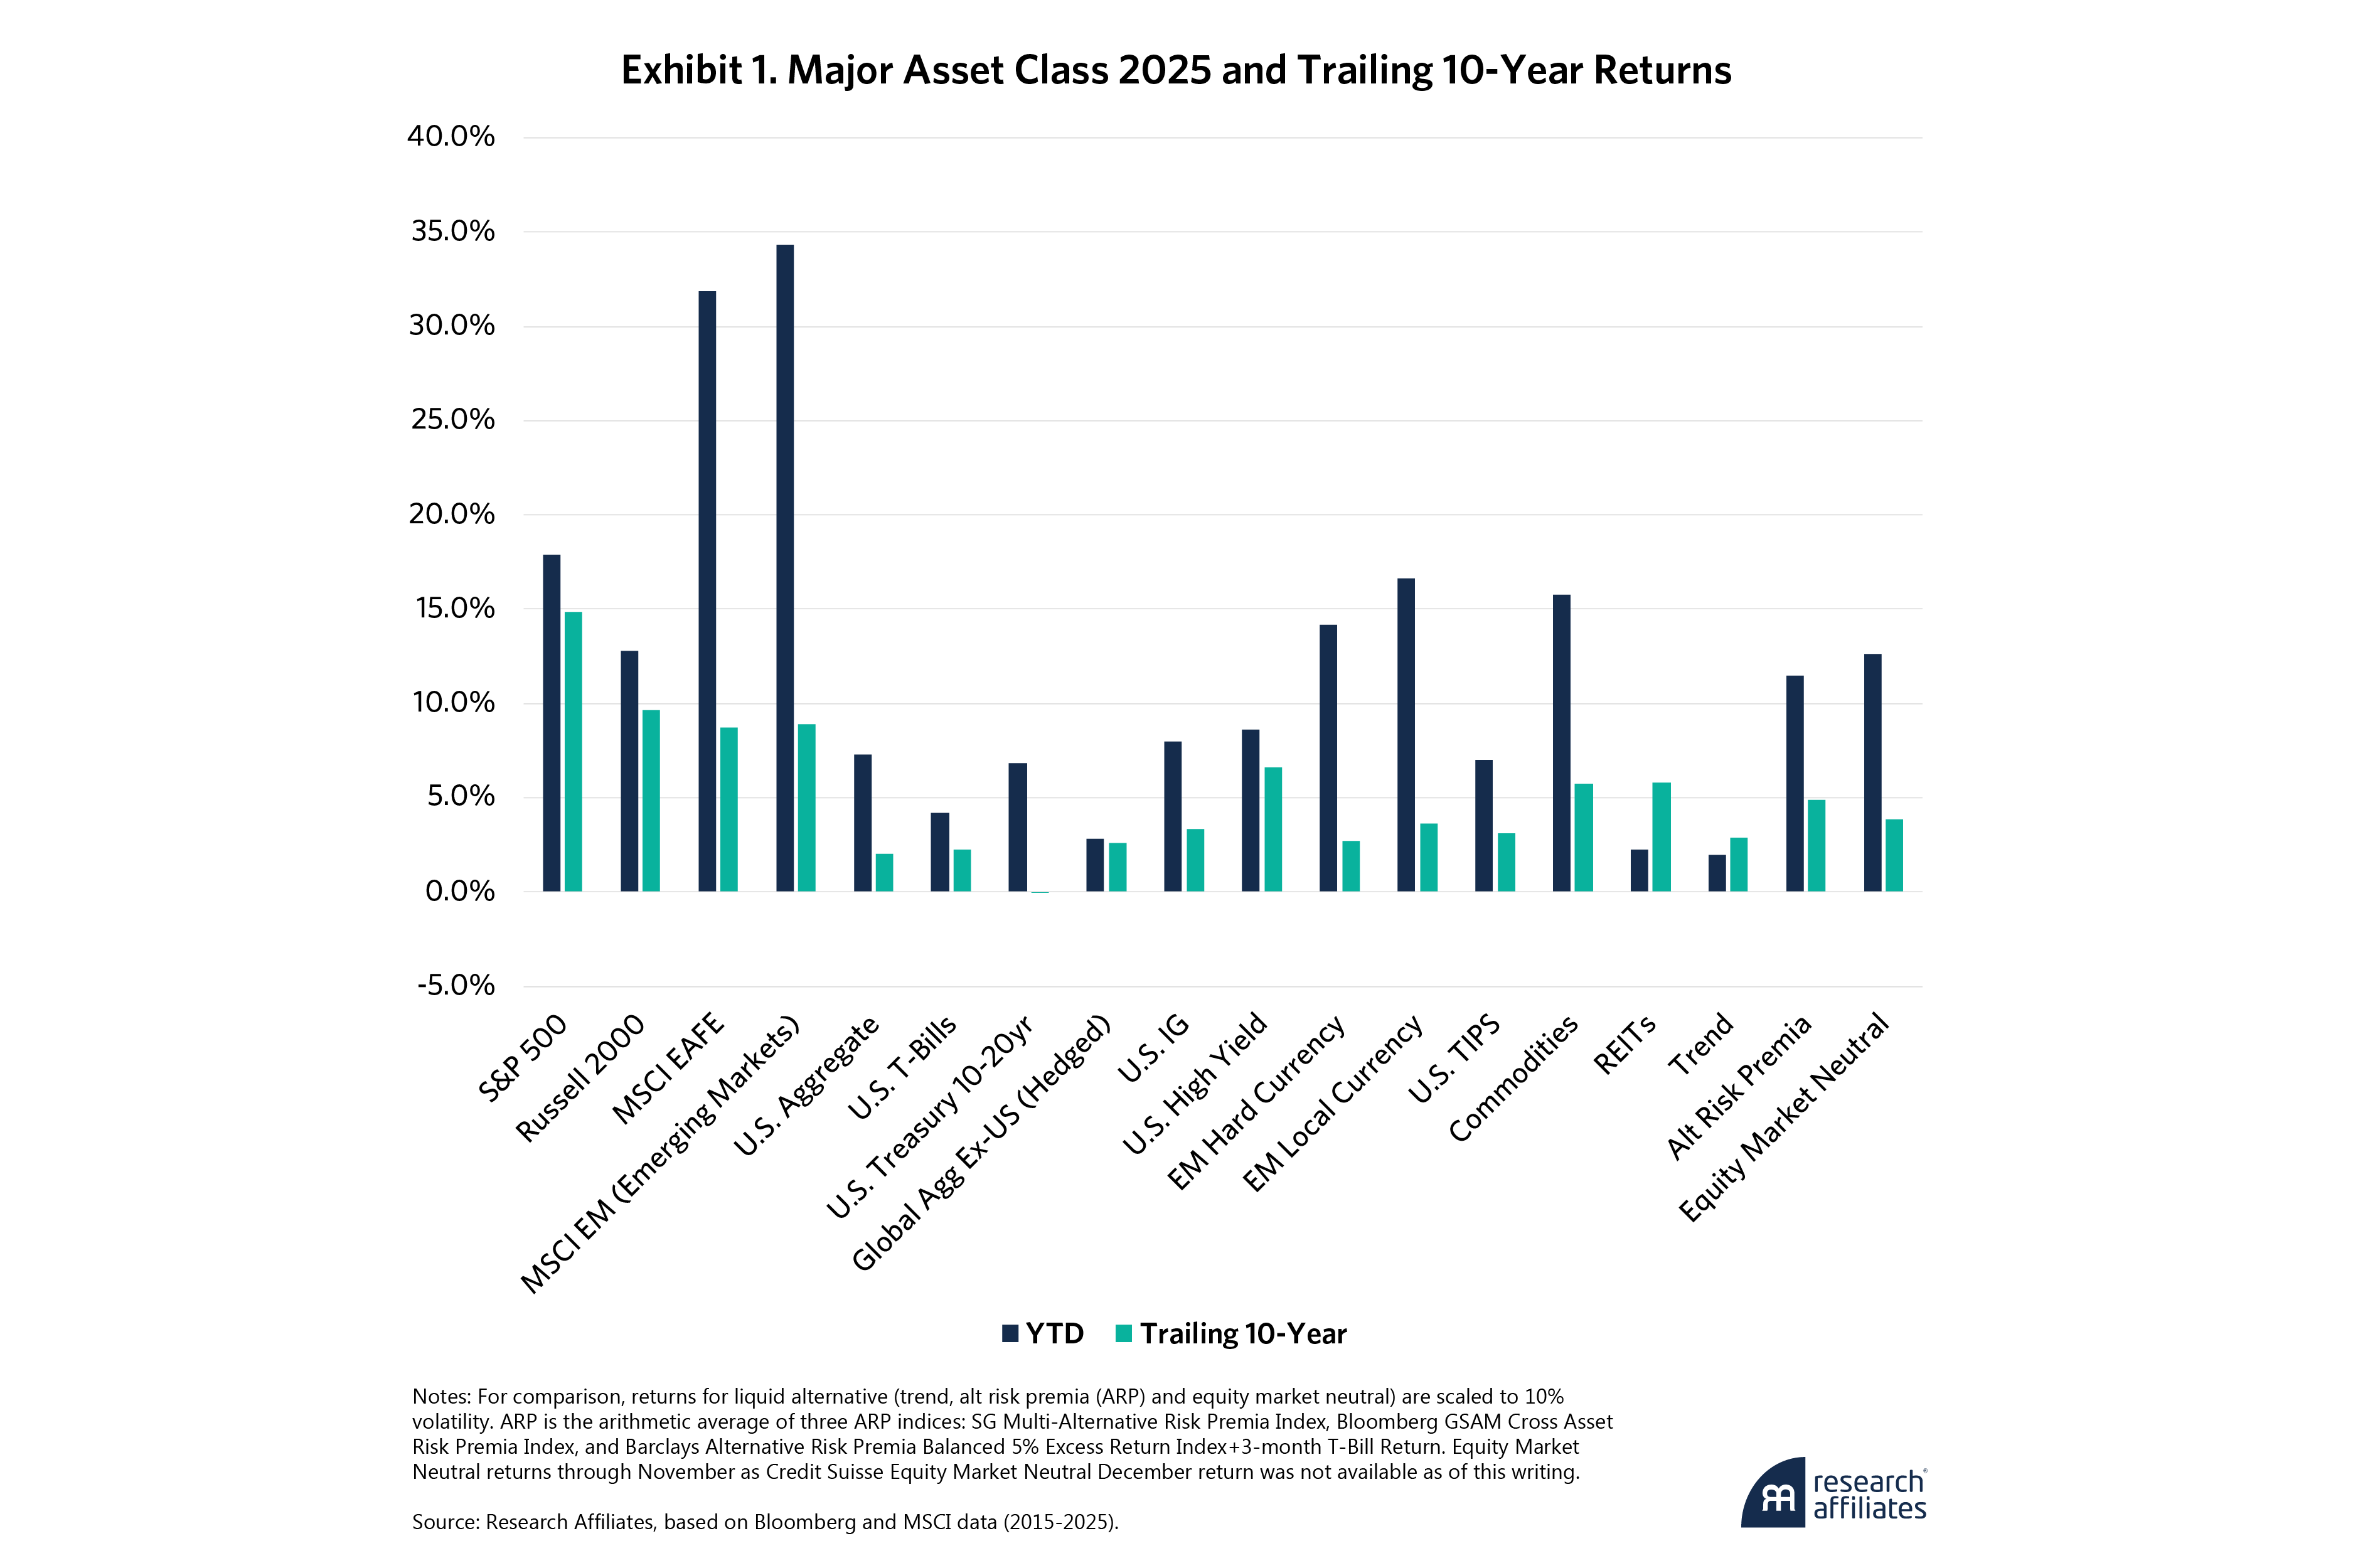
To kick off, Exhibit 1 shows major asset class returns in 2025 and their trailing 10-year averages. U.S. stocks had stellar, double-digit gains, as the S&P 500 capped off the decade with an impressive 15% year-over-year return, far outpacing all other major asset classes.1
While non-U.S. stocks underperformed the U.S. for much of the period, both developed and emerging market equities became the top stars of 2025. They benefited from cheap starting valuations and local currency appreciation versus the dollar, which turned from a perennial headwind into a tailwind. Though U.S. tariff and trade policy may have generated the most headlines, stocks on the other side of the trade policy sloughed them off and pushed higher. To investors’ benefit, this also coincided with a news cycle focused on investment in artificial intelligence (AI), the Magnificent 7, as well as gold and other precious metals. This suggests this trend is not late-cycle hot money chasing returns, and that developed and emerging market stocks still have room to run.
On the fixed-income front, in 2025 U.S. Treasuries experienced little price appreciation, with yields oscillating between 3.75% and 4.75%, as they have since summer 2023. However, while current long bond holders were able to clip nice coupons, for the decade the total return was close to nil.
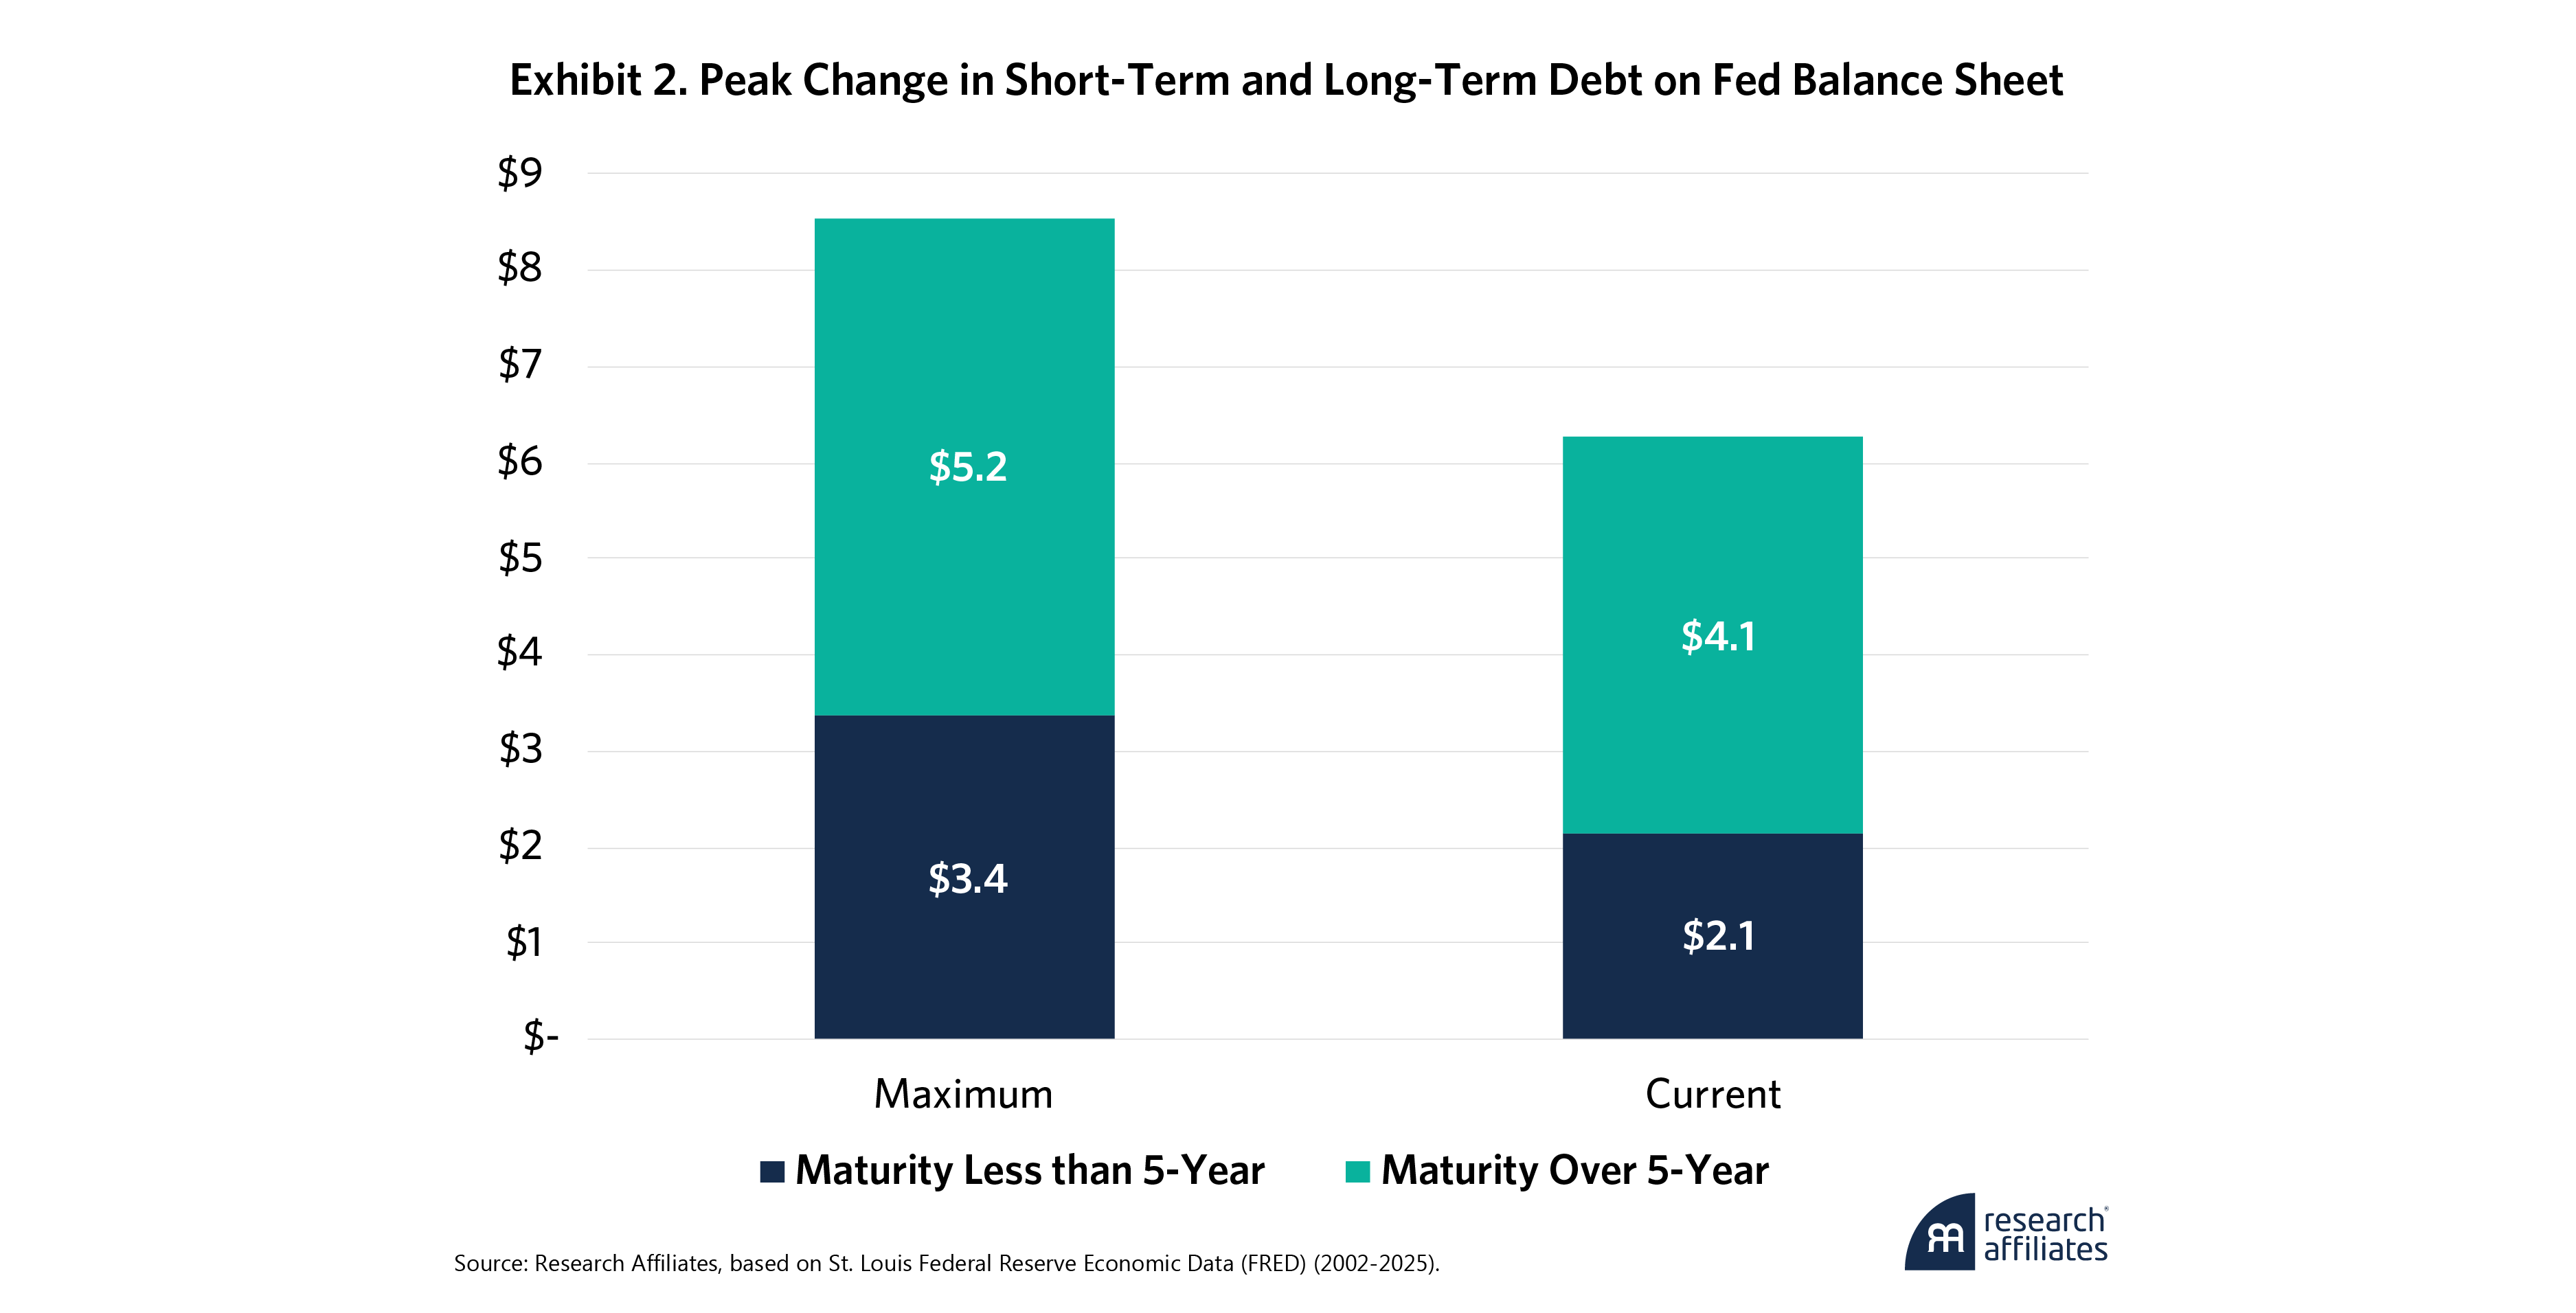
Ownership by the U.S. Federal Reserve and the U.S. Treasury also has an impact on treasury bond yields. Currently the Fed has about $6.6 trillion on its balance sheet, down from $8.9 trillion in 2022. As Exhibit 2 shows, however, more than $4 trillion in these bonds have durations longer than five years, thus artificially depressing rates even amid quantitative tightening. While full-scale liquidation would send rates higher, the Fed’s current level of holdings feels more like the rule than the exception. In fact, Governor Christopher Waller explained why the Fed should target a balance of about $5.8 trillion, within spitting distance of where it is today (Waller, 2025).
The U.S. Treasury also continues a program to replace long-duration debt with short-term debt, thus putting downward pressure on long-term yields.
Due to ongoing spread tightening, U.S. credit bonds remained ahead of U.S. Treasuries as well as their own 10-year average. A partial cause was supply reduction as in 2024, high-yield issuance fell 45% from its 2021 peak and is now back close to pre-pandemic levels (Roberti, Greene, and Zhou, 2025).
Powered by strong fundamentals and renewed investor interest, emerging market bonds, like their equity counterparts, generated robust 2025 returns. Local currency outpaced hard currency debt because of local currency appreciation versus the dollar; however, even hard currency returns were robust.
Among liquid alternatives, trend-following strategies disappointed as markets whipsawed between large drawdowns and sharp rebounds faster than trend managers could spot them. However, long-short strategies of both the multi-asset alternative risk premia (ARP) and equity market neutral varieties did much better, with double-digit returns.
Real return assets like commodities, Treasury Inflation-Protected Securities (TIPS) and real estate investment trusts (REITs) were all positive in the year, but with quite varied performance. Commodities led the way, largely due to a phenomenal year in precious metals, followed by TIPS and finally REITs which continued their trend during what turned out to be a lackluster decade compared to other equity sectors.
Future Context: The Years Ahead
Over the next five years, we believe the global economy will face macroeconomic risks distinct from those of the past half-decade when unprecedented fiscal stimulus, ultra-loose monetary policy, and quick post-selloff recoveries supported rising asset prices and dampened volatility.
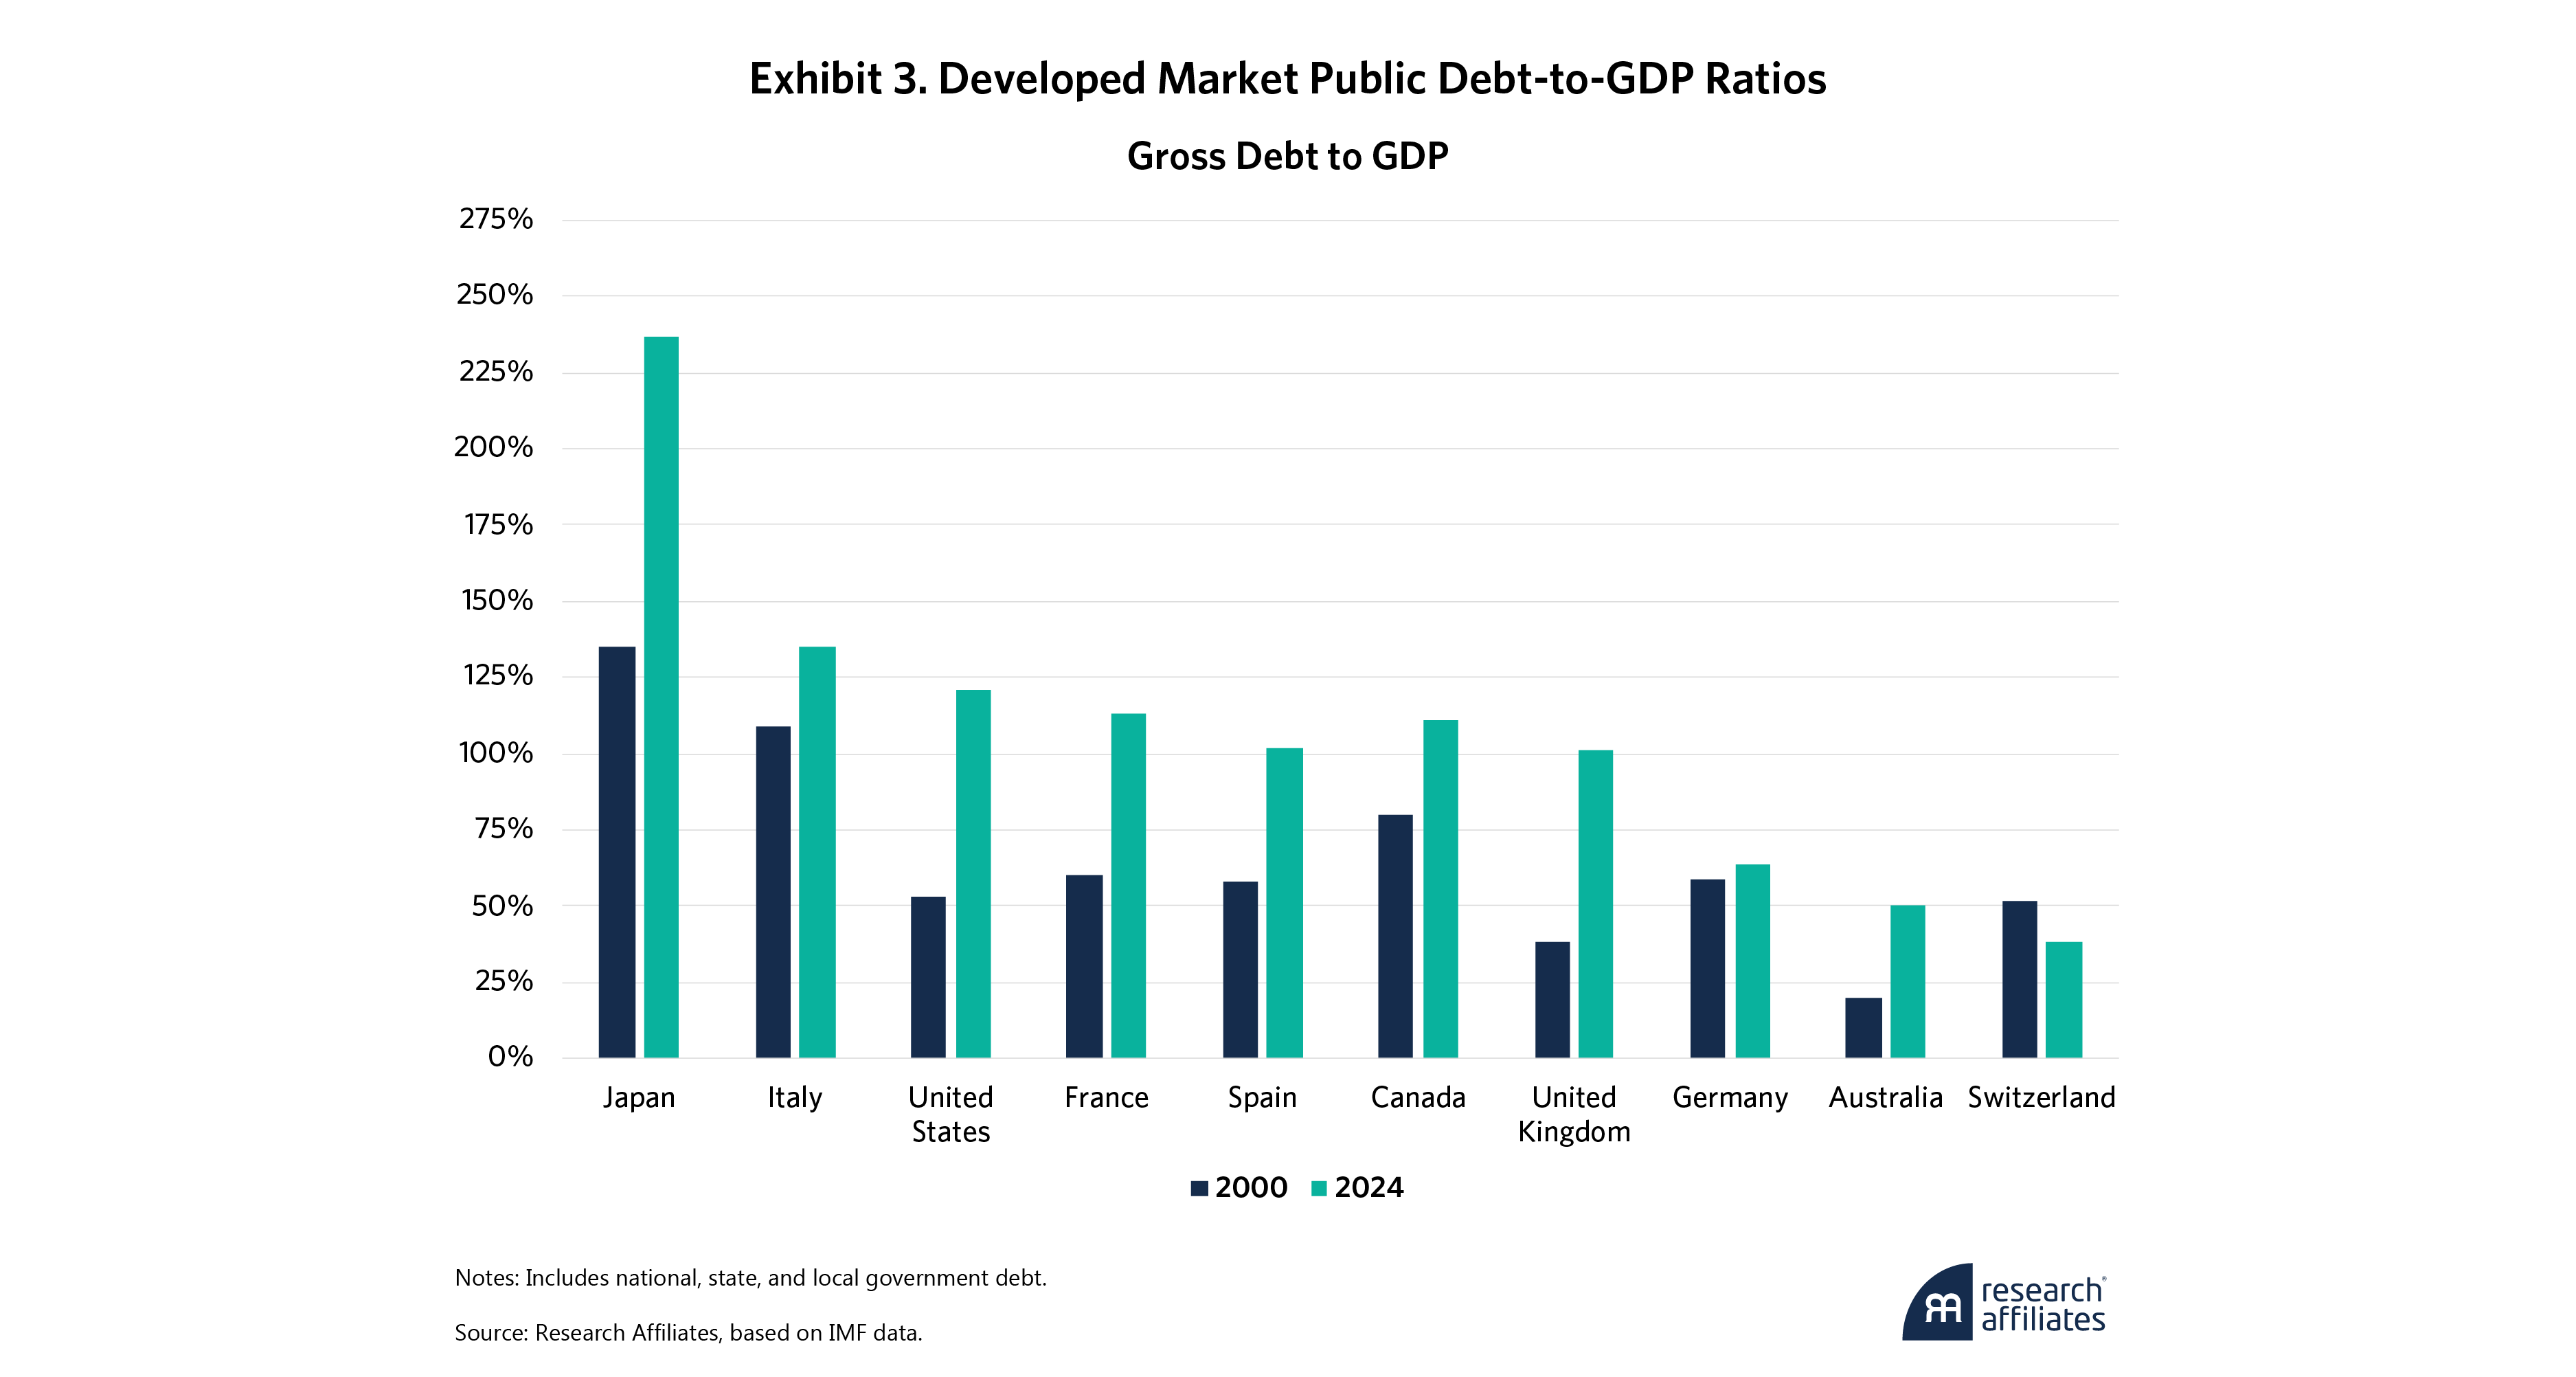
Governments now carry historically high debt-to-GDP ratios and have less fiscal room to respond to shocks. Gross U.S. federal debt exceeds 120% of GDP. Europe and Japan are similarly in the red. Higher interest rates make servicing these debts more challenging. As such, fiscal policy could contribute to, rather than counteract, instability and volatility amid a rapidly changing labor force due to automation, aging demographics and immigration reduction.
Gross U.S. federal debt exceeds 120% of GDP. Europe and Japan are similarly in the red. Higher interest rates make servicing these debts more challenging.
”Additionally, geopolitical fragmentation and supply-chain realignment could affect global trade and further impede growth. This will all make it harder for governments and indebted corporations to grow out of their debt burdens, raising default and credit-spread risks and putting downward pressure on equity valuations.
While AI and other technological advancements promote greater efficiency and reduce costs, large swaths of capital allocated to unprofitable projects as well as energy constraints may rein them in. Companies may not be able to meet the growth trajectories currently baked into their stock prices. Furthermore, the societal impacts of AI will most likely eventually call for government intervention to address its impacts and that could slow its progress.
Perhaps most significantly, inflation volatility as well as inflation levels are expected to remain elevated. Given energy transition costs, reshoring supply chains, and tight labor markets, among other drivers, inflation is expected to stay above central bank targets for longer, even if cyclical pressures occasionally ease. This will erode real returns for traditional bonds, increase the potential for further policy tightening, and weigh on equity multiples.
In 2026, we expect central banks will continue to "run it hot" and add fuel to the fire, lowering rates to spur growth and buoy equities while tolerating higher inflation. Yield curves will steepen, and while the 10-year Treasury will most likely be supported by some combination of the Treasury and Fed, extremely tight credit spreads can widen as will mortgage rates that are less supported by the Fed. In this environment, such inflation-protection instruments as TIPS, commodities, and real assets, as well as trend following, ARP, and market neutral equity, among other liquid alternatives, can offer protection.
Further depreciation of the dollar can continue to support non-dollar denominated assets, particularly emerging market stocks and bonds. In equity markets, increased tax returns from items in the One Big Beautiful Bill (OBBB) provide a temporary tailwind to discretionary spending if consumers follow the typical path of spend over save, while demographics support healthcare and AI growth supports energy.
In equity markets, increased tax returns from the OBBB provide a temporary tailwind to discretionary spending if consumers follow the typical path of spend over save, while demographics support healthcare and AI growth supports energy.
”Before exploring each major asset class in detail, we first look at the underlying macroeconomy for the year that was, with a specific focus on global sovereign debt and deficits and the U.S. labor market, inflation, and GDP growth.
Debt and Deficits
Why lead with debt and deficits? Because of the elevated nature of both, they are having an outsized influence not only on the decision making of treasury departments and central banks but also government in general, whether local, state, or national.
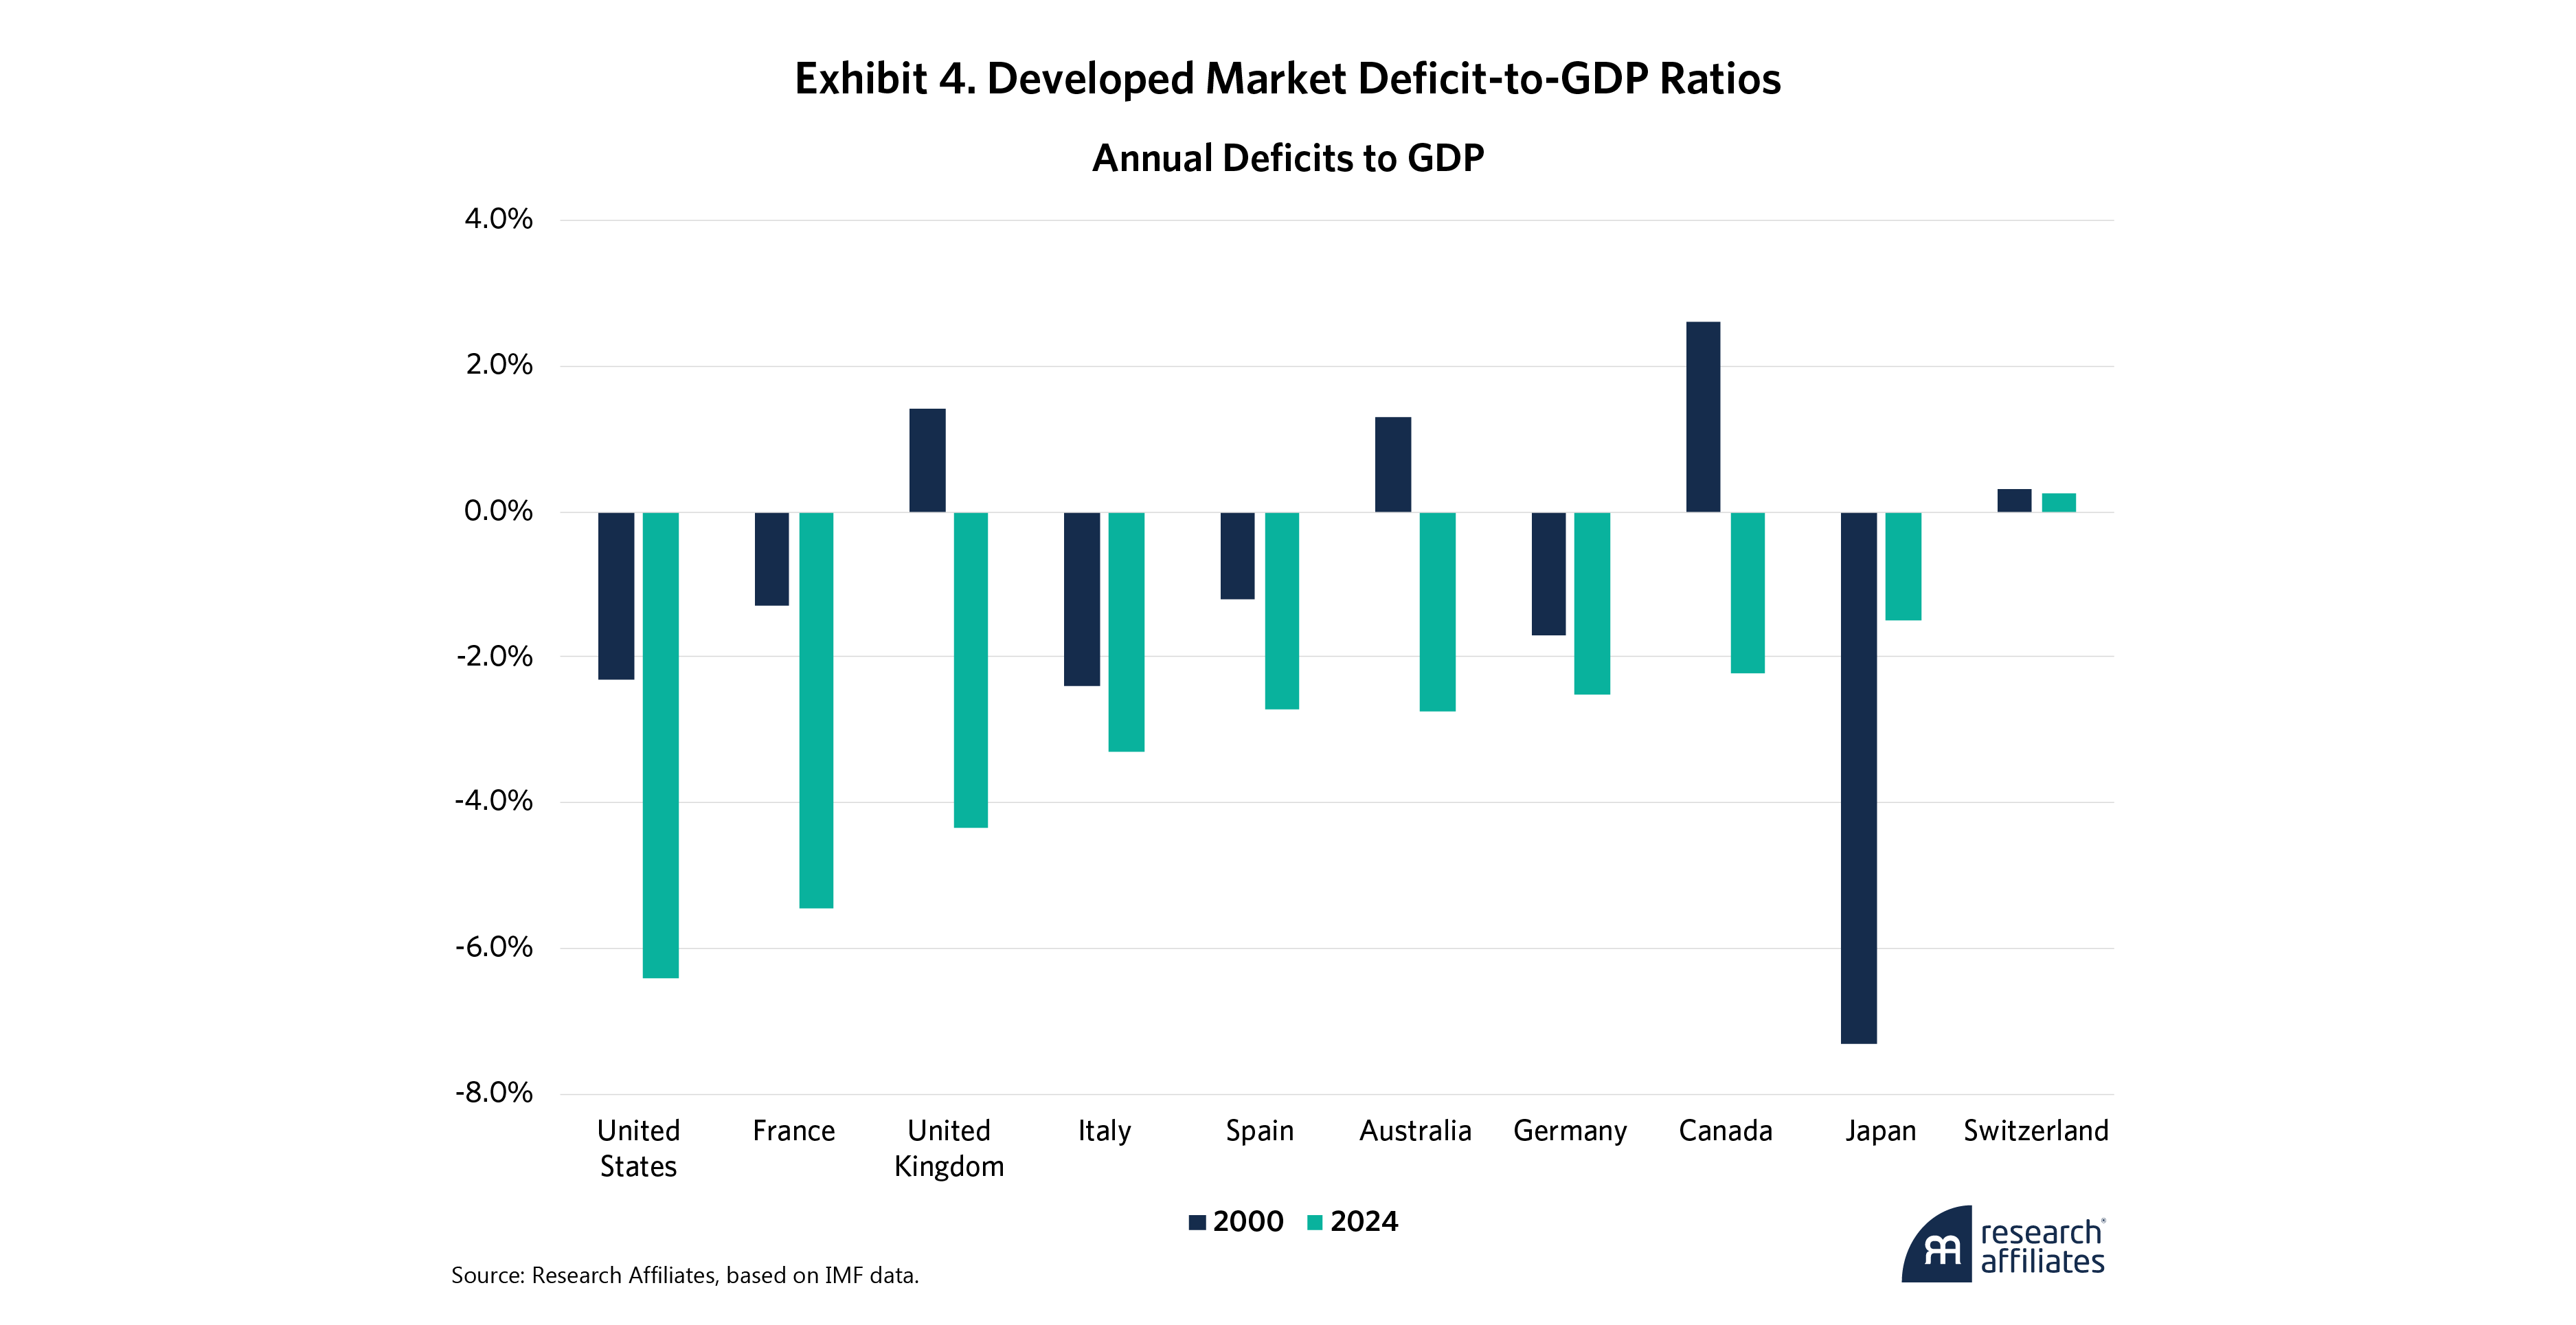
Rising debt-to-GDP ratios and extreme non-recessionary deficit spending are endemic across the developed world. As Exhibit 3 and Exhibit 4 show, gross public debt-to-GDP ratios rose 42% on average in most recent global 2024 IMF data and now exceed 100% in seven of 10 developed markets. Deficit spending as a share of GDP averaged 3.3% during the same period, up from 1.1% in 2000. In the U.S., in 2025 it was 5.9% with no relief in sight.
Fiscal dominance continues to become a greater risk in developed economies, Japan’s in particular. Fiscal dominance occurs when government debt becomes so large that monetary policy is flipped on its head. Rather than reining in inflation, higher interest rates increase it by raising government debt service payments. Lower interest rates, in turn, exacerbate inflation and reduce confidence in central bank independence. No developed market has run off the rails just yet, but slowing the train and addressing the deficit situation will not be easy.
Unfortunately, raising taxes and cutting spending, the most straightforward solutions, are not politically palatable. A global “debt jubilee” in which various countries forgive a portion of their debt to one another is also a nonstarter if for no other reason than its operational complexity. Default is also not on the table, lest it risk a hot war with creditors and a severe depression.
That leaves financial repression, artificially keeping real rates low to inflate the debt away and boost nominal growth, as the last remaining option. Explicit yield curve controls (Masturzo, 2021) may soon become reality, although probably not in 2026.
The U.S. Labor Market
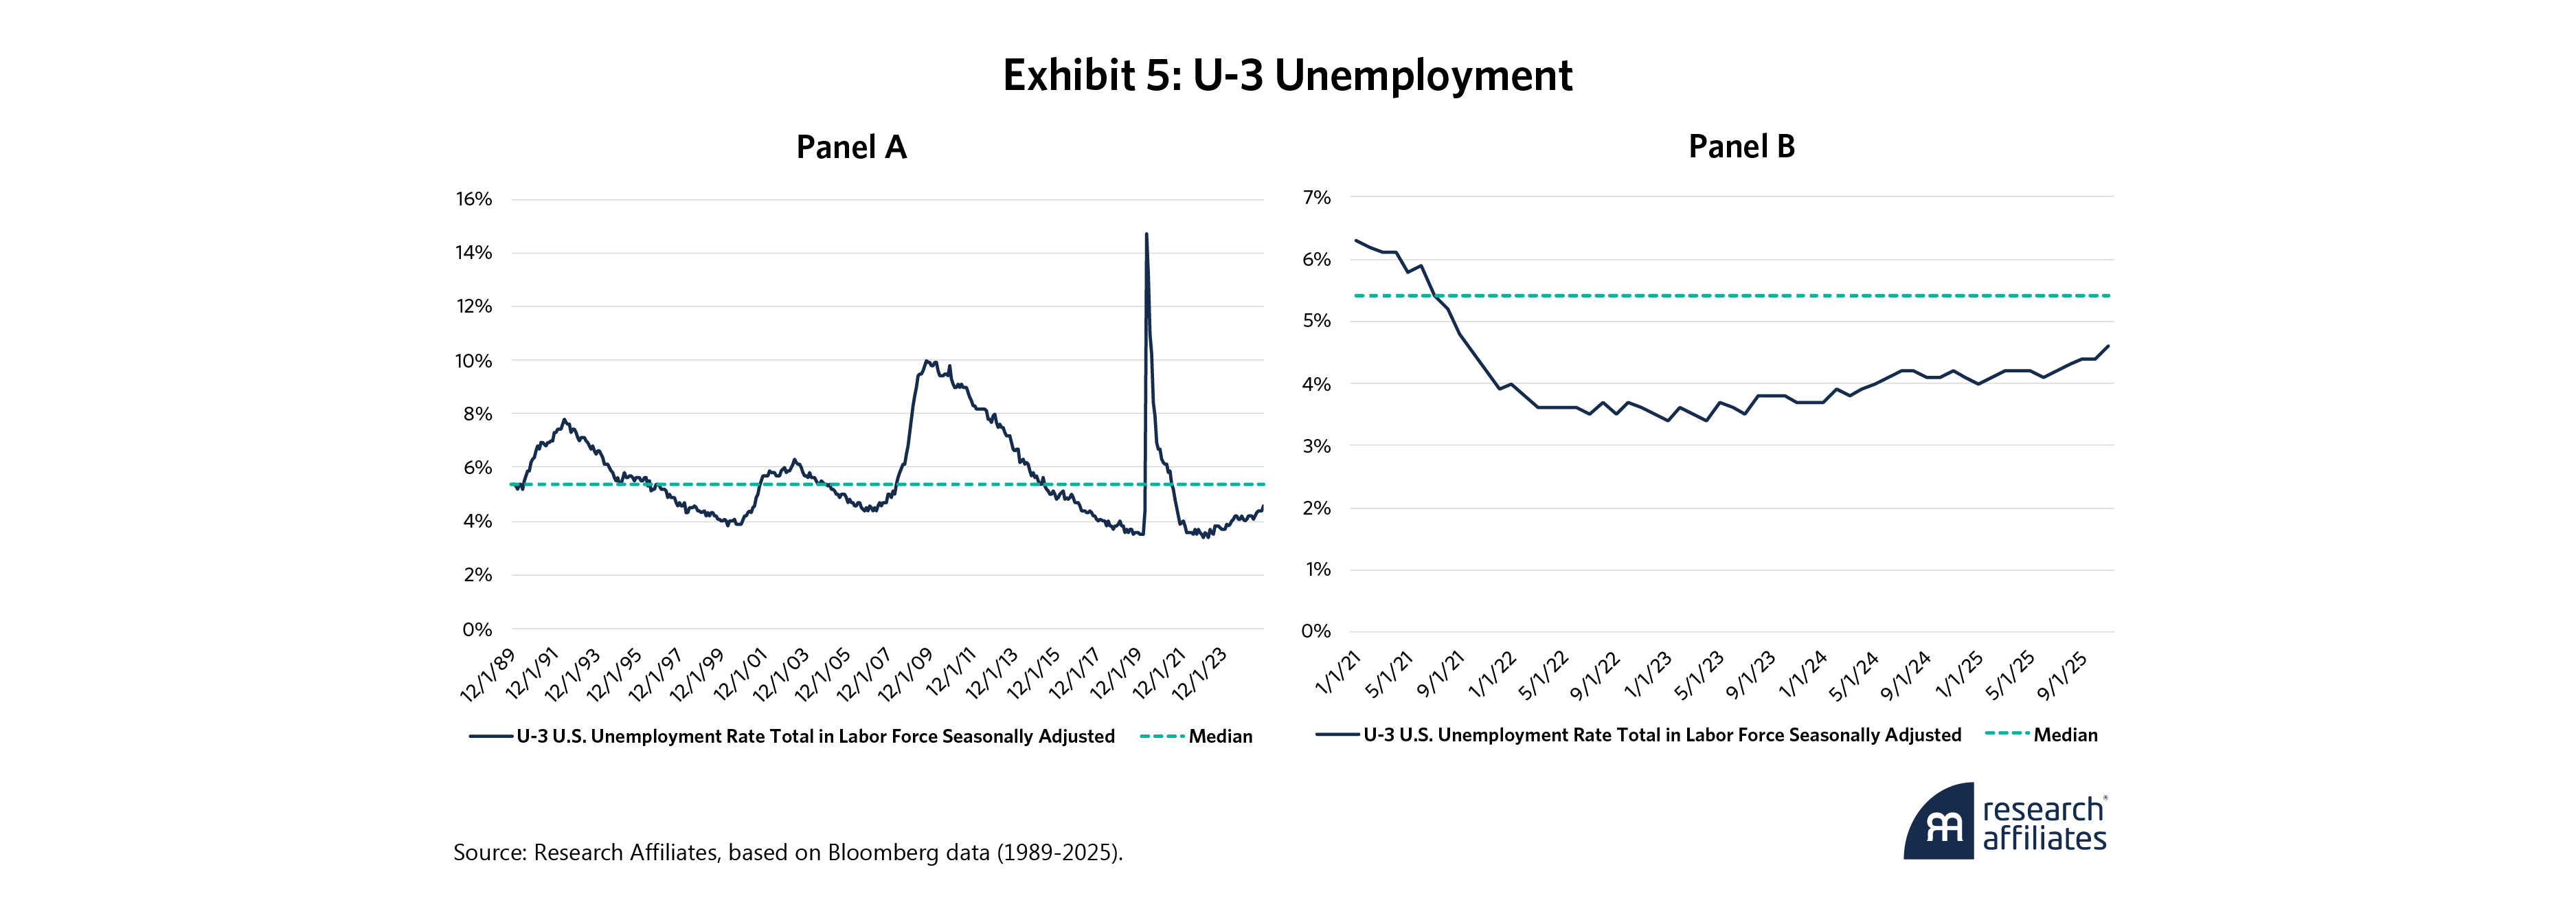
While the labor market has been strong, substantive cracks are beginning to show. Current unemployment is 4.6%, below the 35-year median of 5.4% but up from 3.5% in early 2023, as Exhibit 5, Panel A and Panel B, show. These readings are likely overly optimistic. The annual revision to last year’s net jobs report ending March 2025, for example, revealed an overcount of 911,000 jobs.
In the second half of 2025, Amazon (Benzinger, 2025), ConocoPhillips (Nostrant, 2025), Intel (Vaziri, 2025), Meta (Capoot and Vanian, 2025), and UPS (DiPalma, 2025), among other global firms, announced significant staff reductions. There are also nearly 100 so-called zombie companies, the most since early 2022, with interest coverage ratios (ICRs) below 1 (Graf and Ma, 2025). These firms are not earning enough to pay debt interest and will be looking to cut personnel, which will present another labor headwind in 2026. Anecdotally, while some companies have initiated specific workforce reductions, many others are taking the subtler route of employee attrition and hiring freezes.
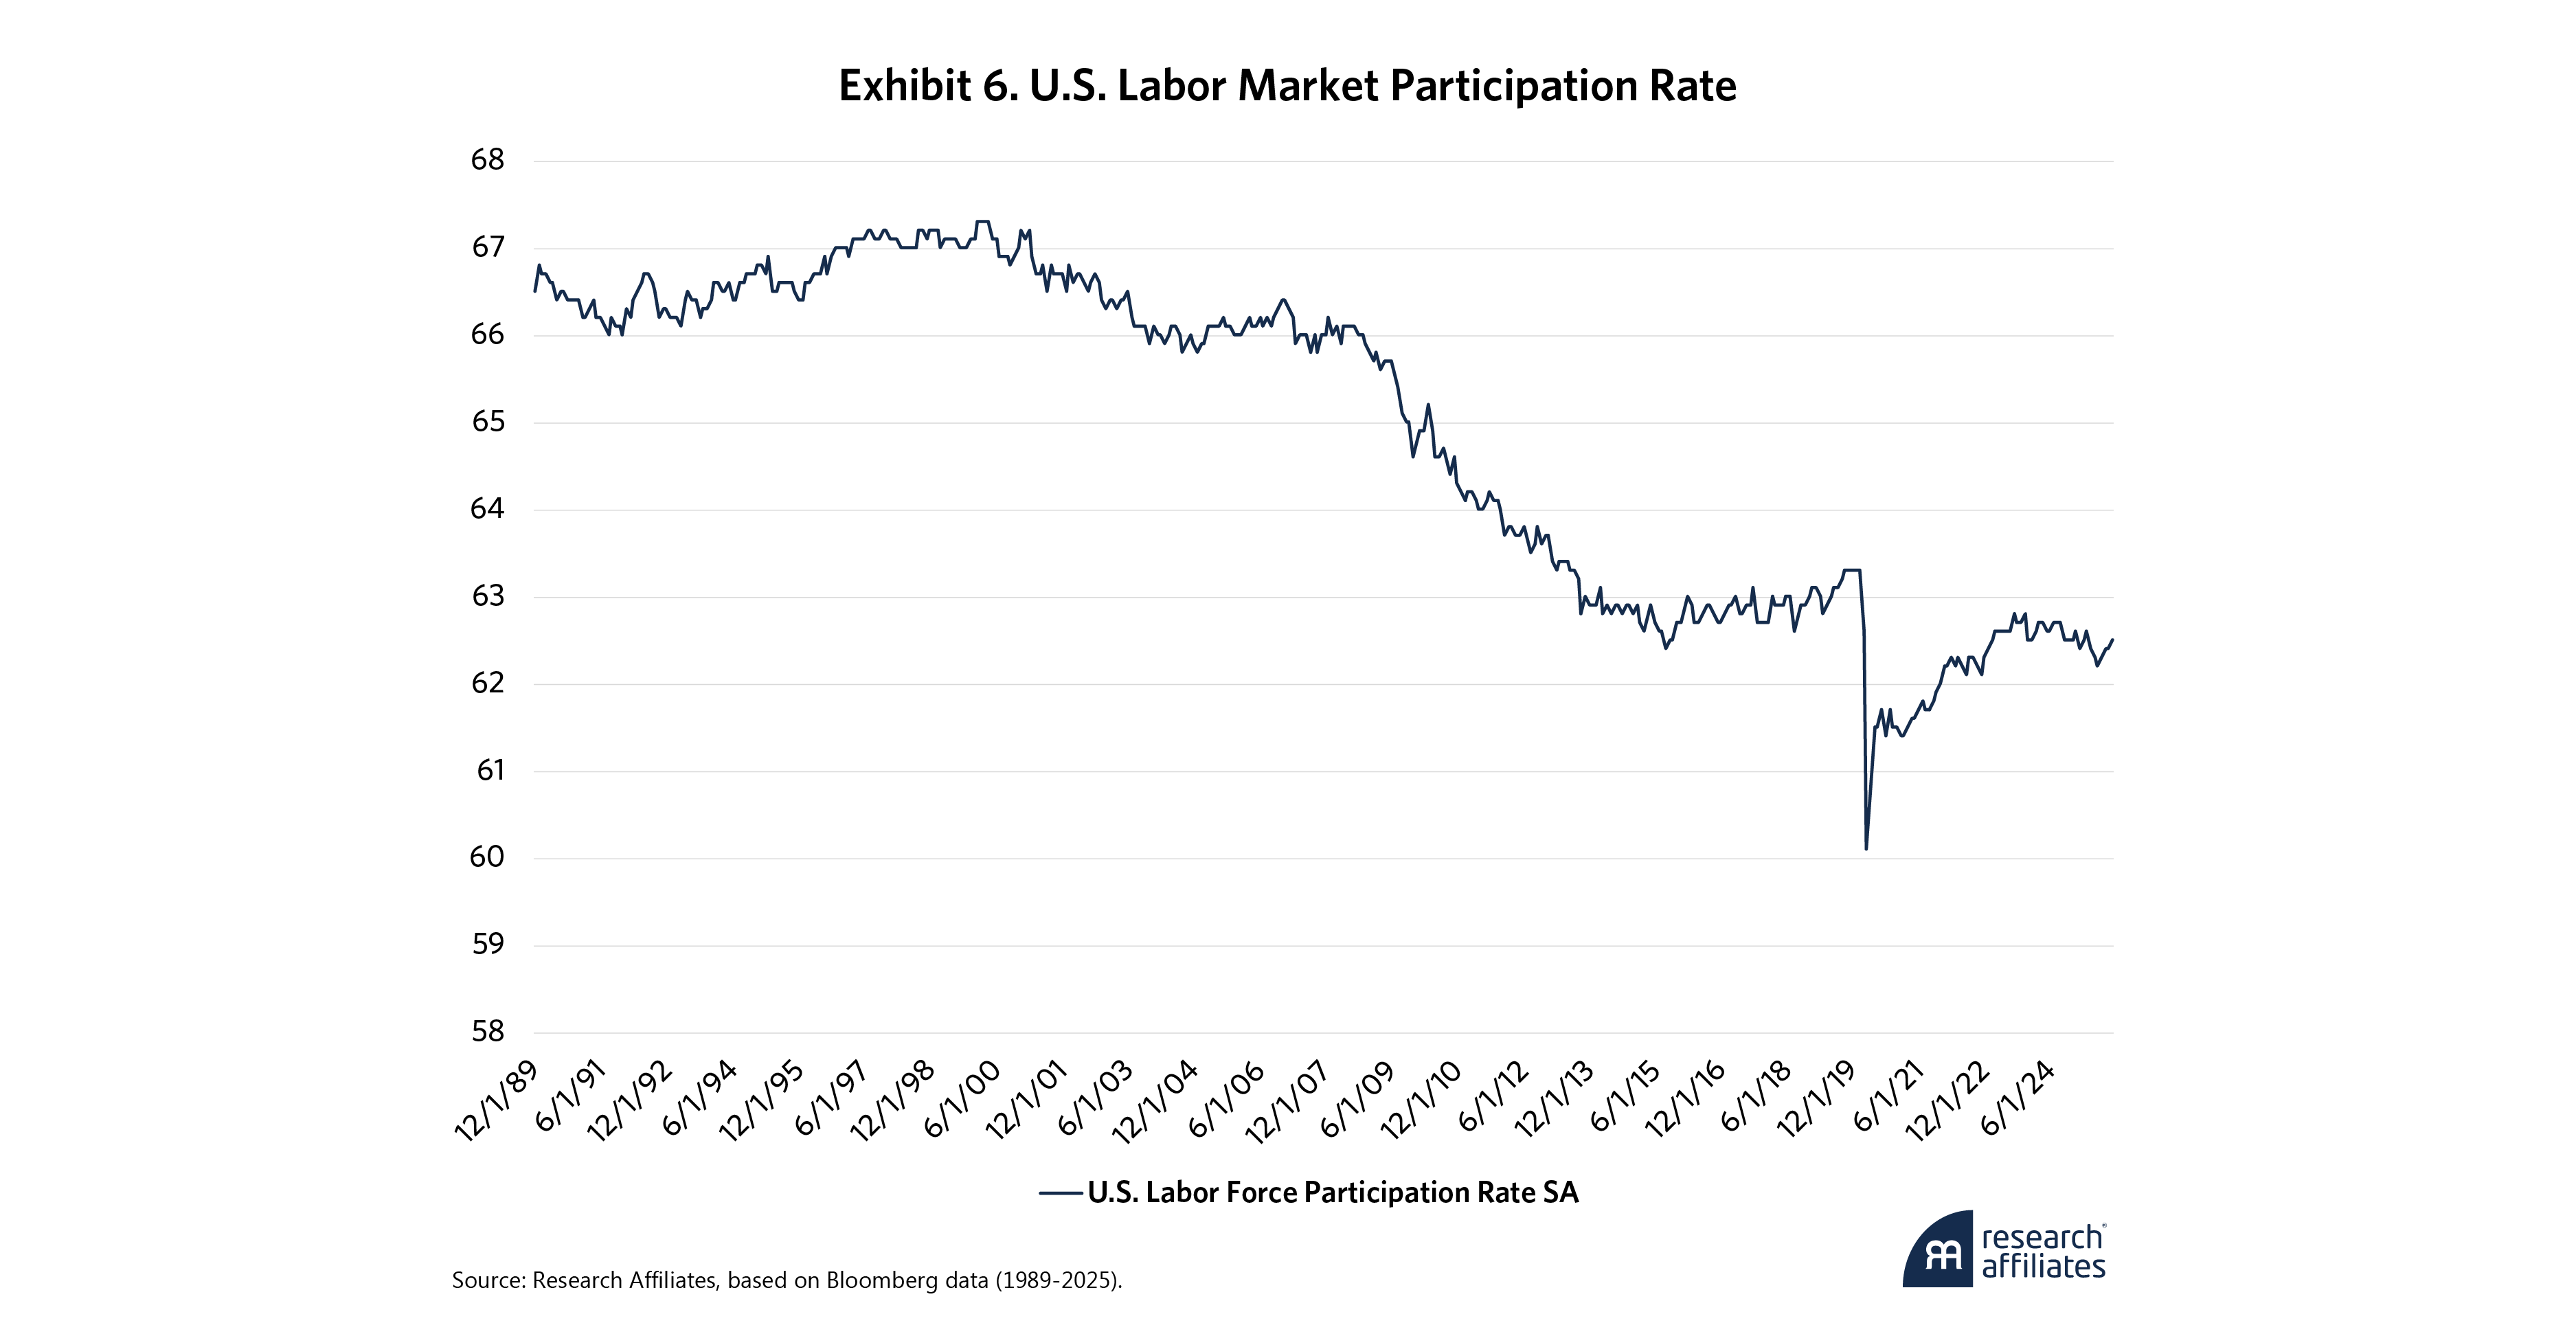
After right-sizing following pandemic lockdowns, labor market participation rates have started to fall again, as Exhibit 6 shows. Workers are aging or opting out of the labor force, often due to wages not offsetting the rising costs of both child and elder care. A problem that needs to be addressed to unlock the full potential of the U.S. workforce.
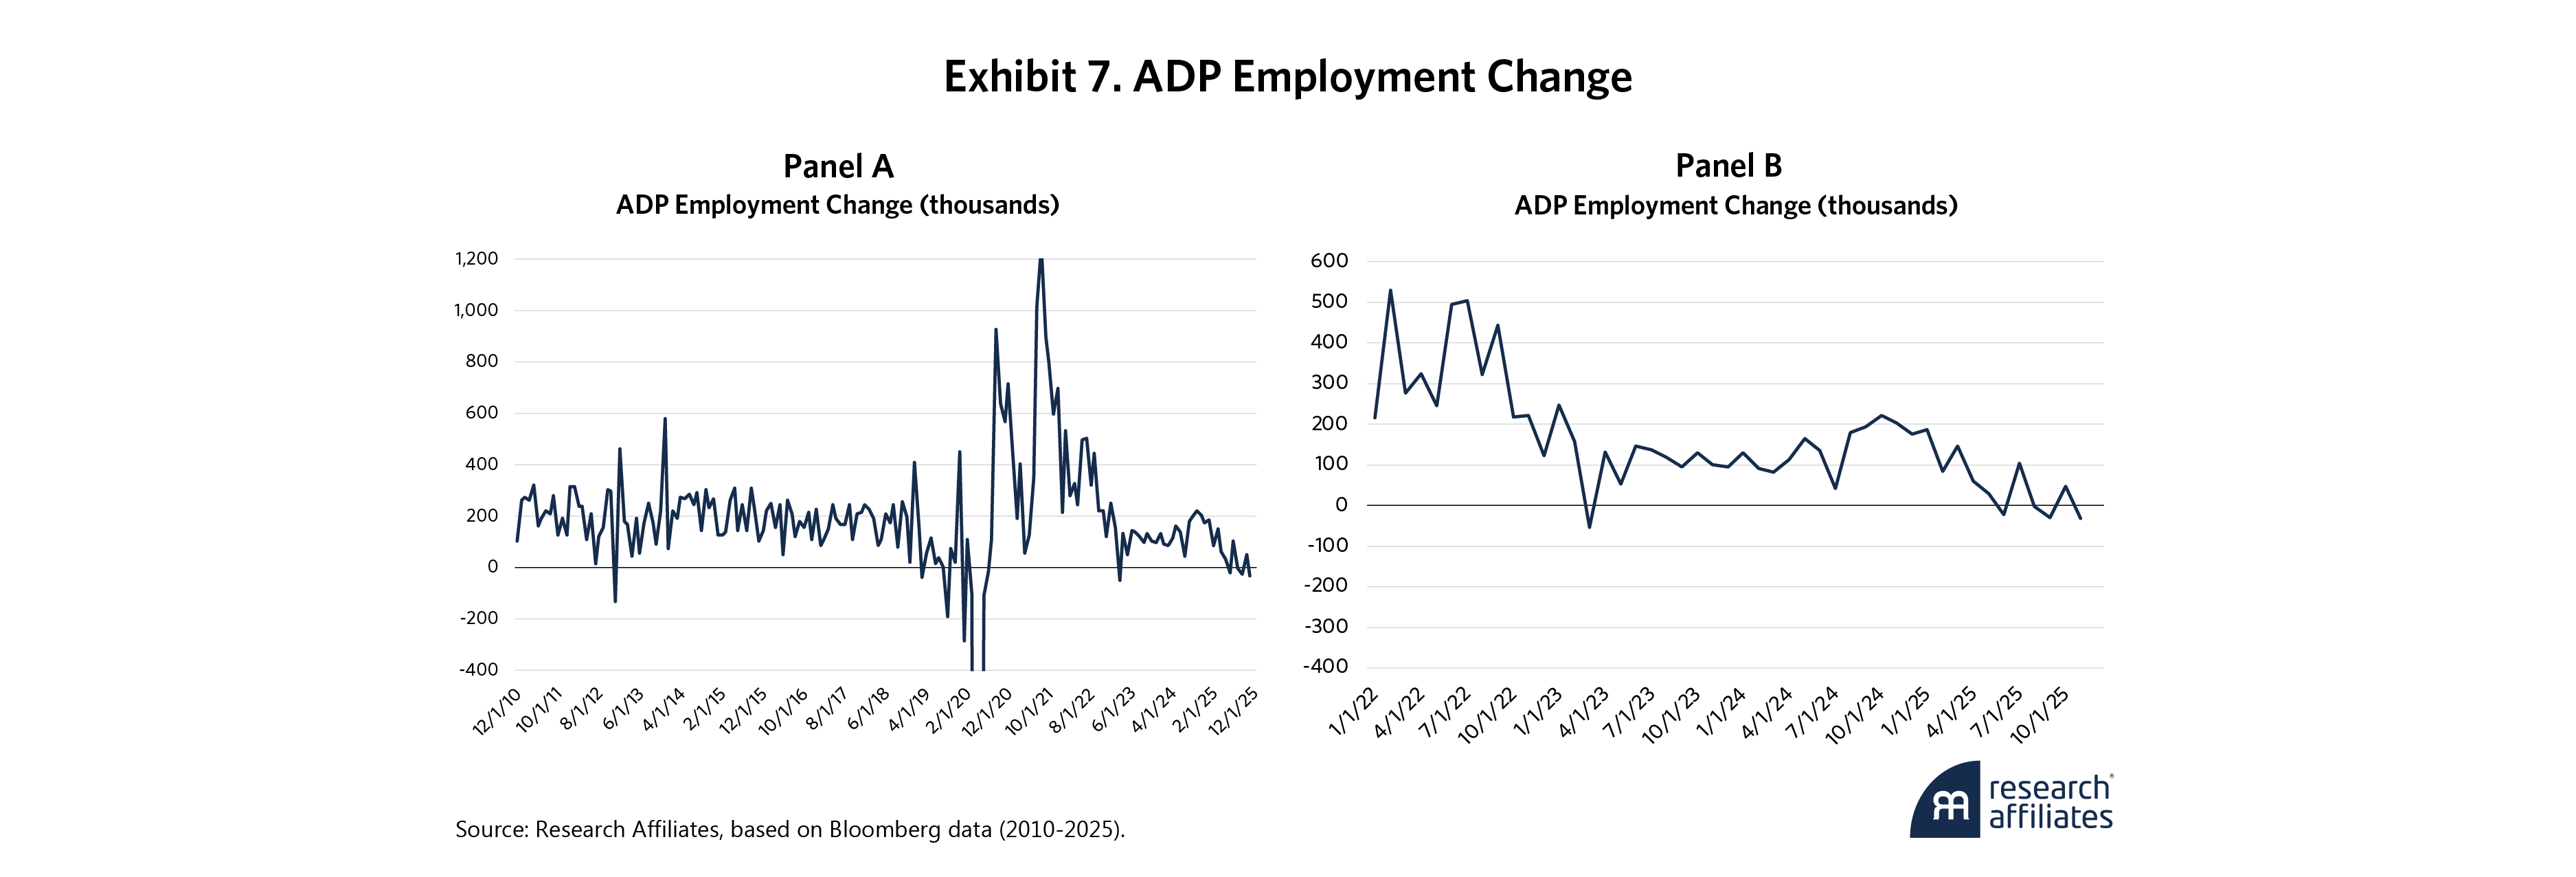
The shutdown of the U.S. federal government during much of the fourth quarter increased reliance on the ADP jobs report. Exhibit 7 shows U.S. private-sector employment fell by about 32,000 jobs in November 2025, below consensus expectations. The decline spanned both goods- and service-producing sectors. The service side, which includes professional and business services, along with information services, was the hardest hit.
U.S. Inflation
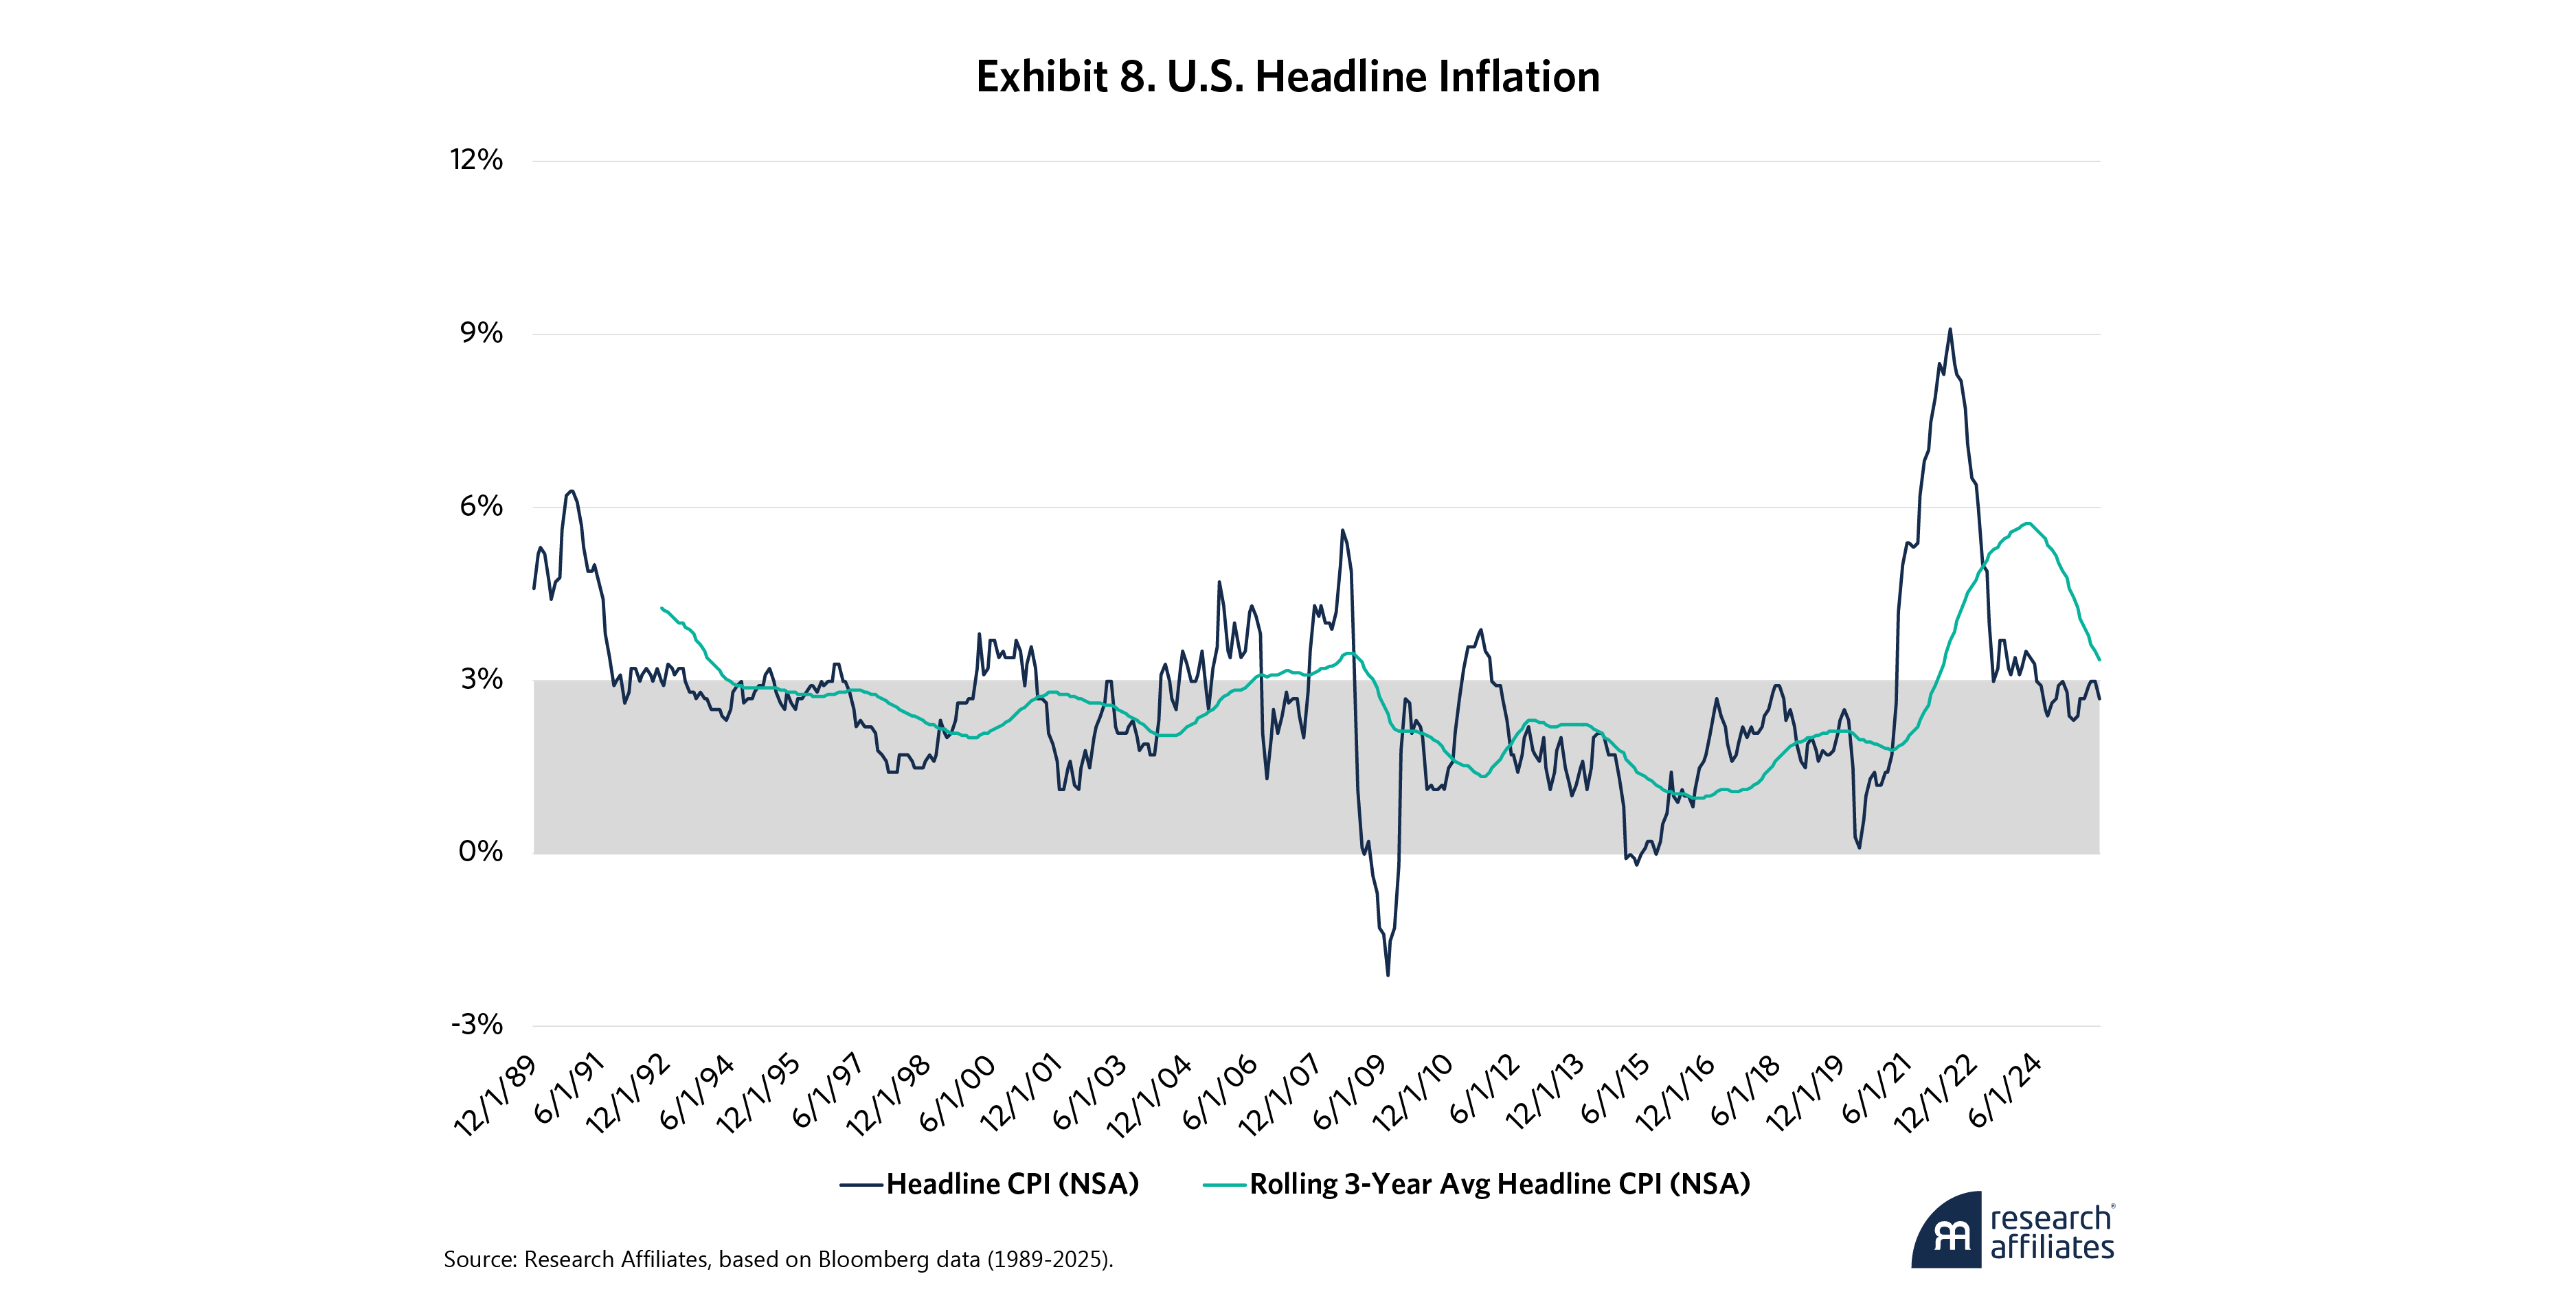
Early in the year, the market perceived 3% inflation prints as problematic but now seems to accept 3% as the norm. For example, the market rallied in October when the September headline inflation print came in below forecasts at 3%, which was not enough to discourage expectations for a Fed rate cut. Exhibit 8 shows headline inflation relative to 3% and that rolling three-year inflation has rarely exceeded 3% over the last 35 years. By 2035, that trend may no longer hold.
While a single tariffs-induced inflation spike has not developed, the tariff effect may be playing out more slowly, in dribs and drabs, as the initial “eating of the tariffs” by importers and producers is gradually transferred to the consumer.
The oil and housing markets also flashed important inflation signals. While headline inflation remains sticky, oil stayed weak throughout the year. Exhibit 9 shows supply has outweighed demand, putting downward pressure on prices. OPEC+ countries have ramped up their production targets to gain market share from the U.S. shale patch, which has higher production costs. Recent OPEC+ statements have reduced 2026 supply expectations, adding yet another potential tailwind to 2026 inflation (El Wardany, et al., 2025) as producers look to push prices out of the fifties.
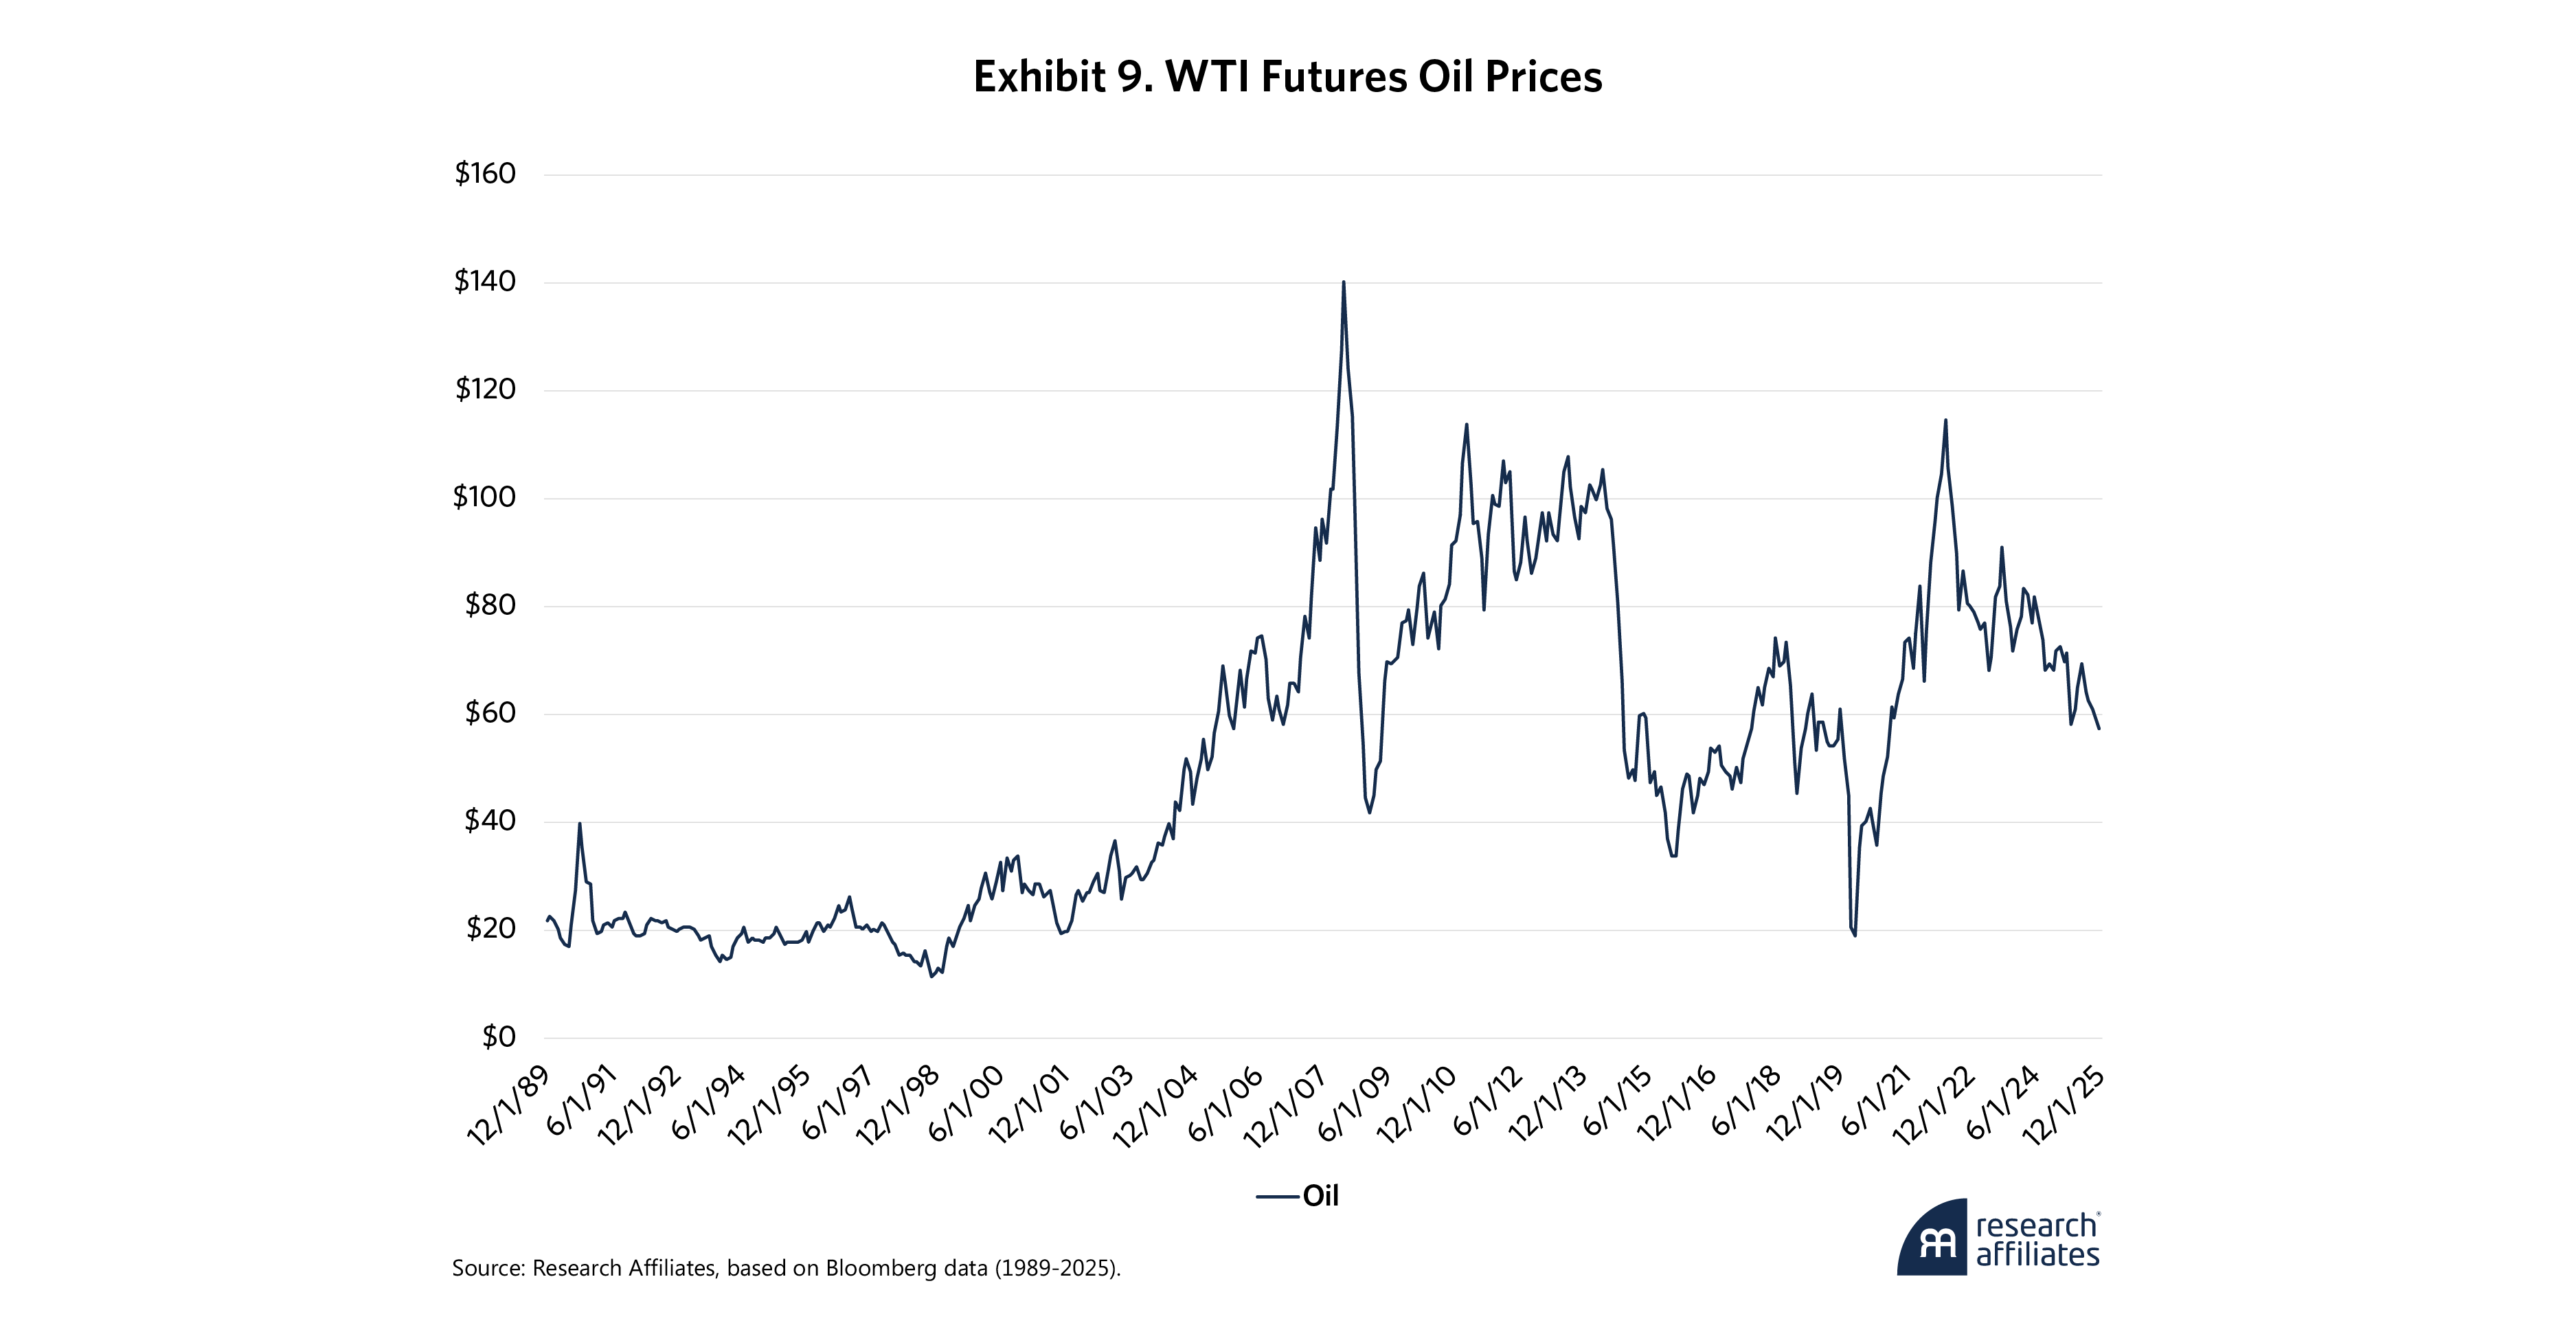
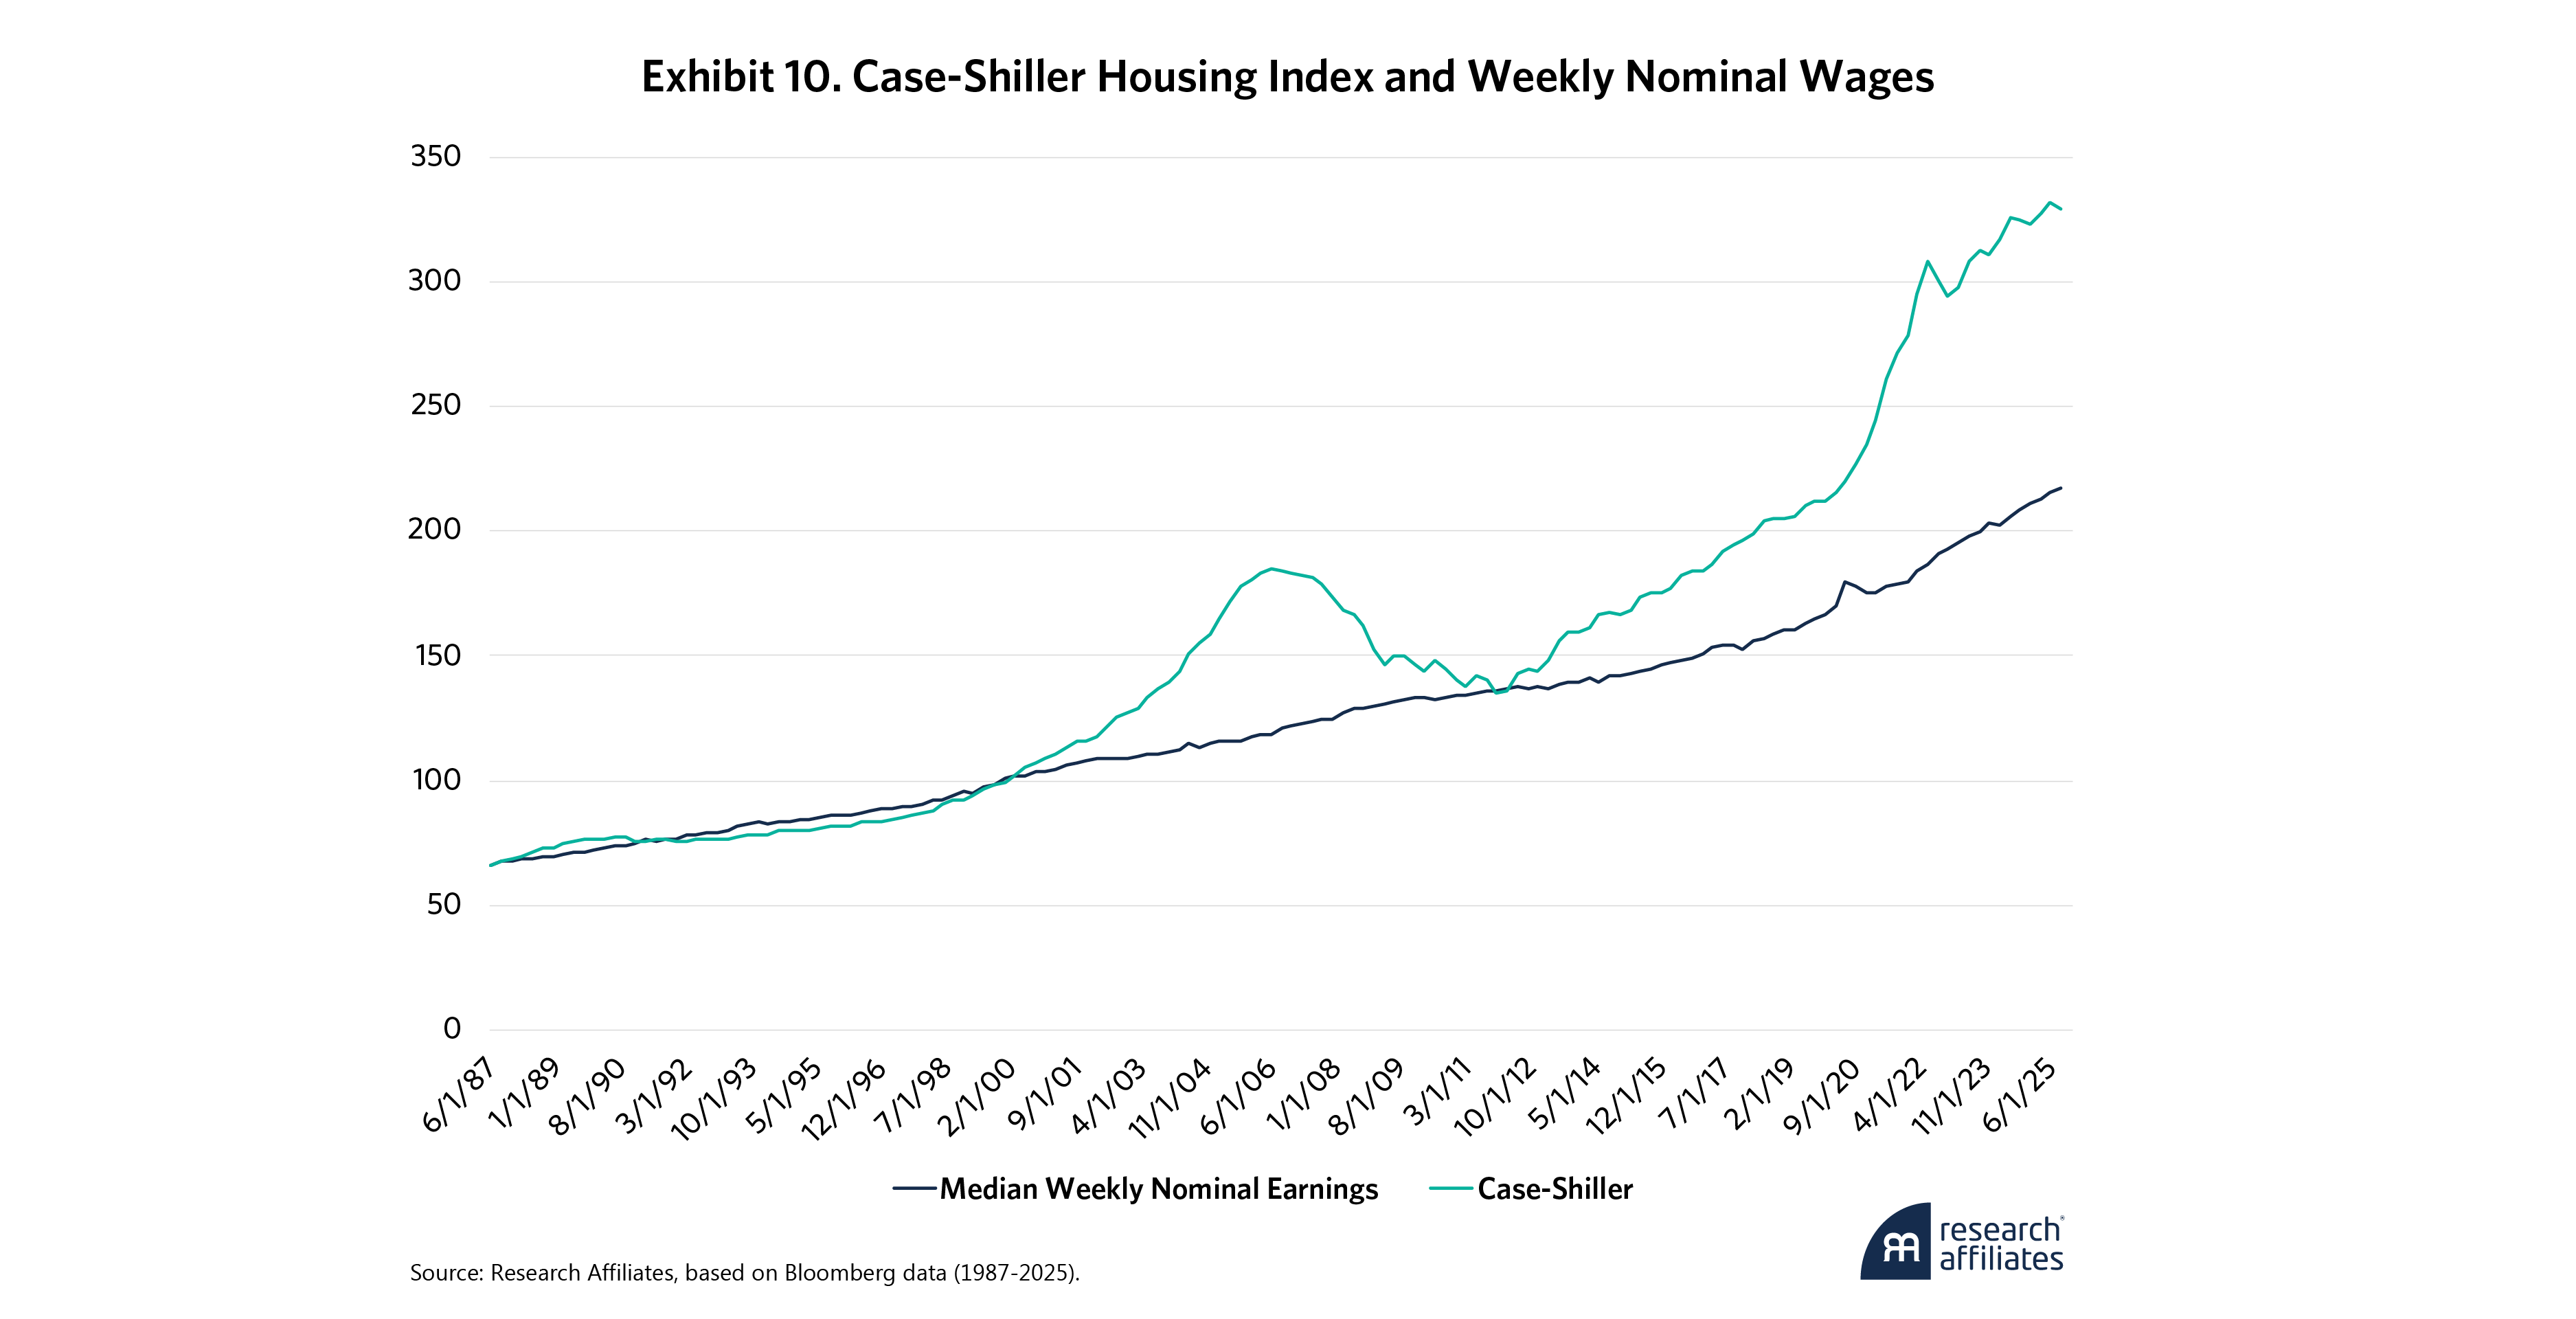
Exhibit 10 shows trends in residential housing, as represented by the Case-Shiller index, and nominal wage growth over the past 40 years. These indicators moved roughly in parallel until about 2000, when housing growth accelerated. After briefly reverting, housing growth took off again in the 2010s and really started to soar in 2020. The gap between housing and nominal wages is now 1.5 to 1, equivalent to the disparity in 2007. Demographic challenges and the pricing out of younger buyers are the sector’s main sources of risk. Mortgage rates are also expected to stay higher for longer. The Fed cut short rates by 175 bps in the last six quarters, but mortgage rates have moved only modestly as lenders have little appetite for risk.
U.S. Growth
Real GDP growth had a tough first quarter in 2025, going negative on a quarter-over-quarter basis amid a surge of imports seeking to get in before tariffs took effect. Real GDP expanded at a 3.8% rate in the second quarter, with near 4% forecast for the rest of the year.
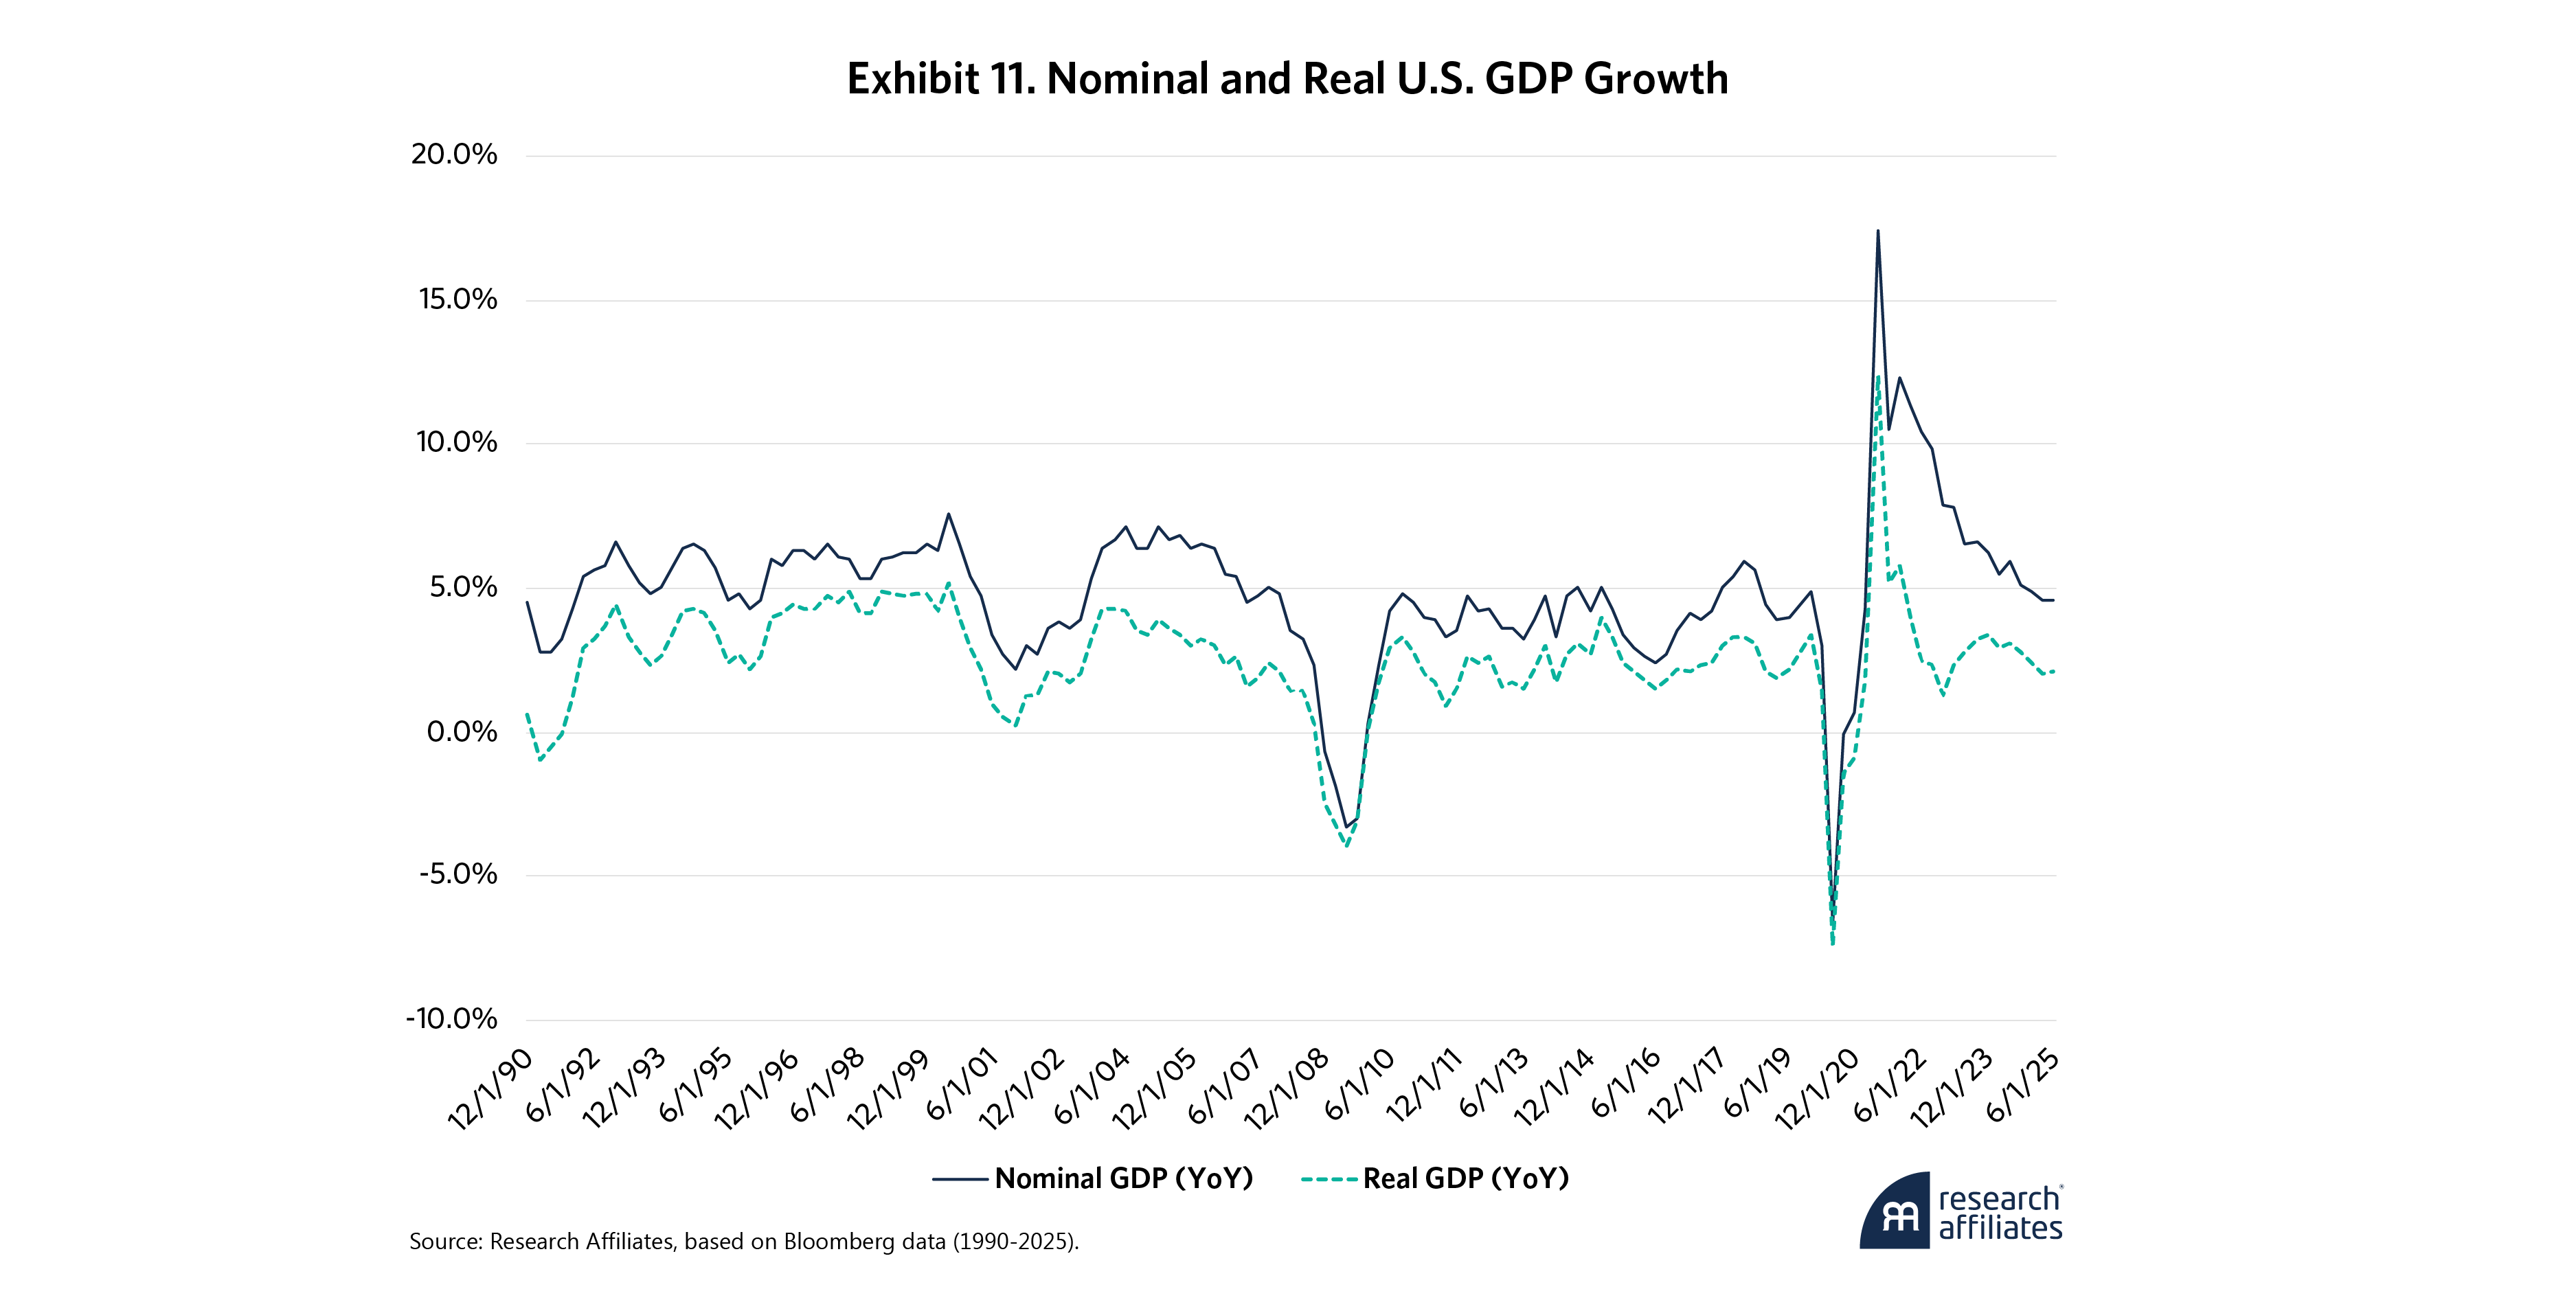
Exhibit 11 shows that while real growth averaged a little more than 3% per year for many decades after World War II, from 2015 to 2024, it fell to the low 2% range. The COVID-19 pandemic led to a deep decline in 2020 and a strong rebound in 2021 before settling back toward pre-pandemic norms.
U.S. nominal economic growth has fallen since 2022 as inflation has declined. Current nominal growth is 5.4%, or 100 bps higher than the 20-year median of 4.4%. Real growth has also retreated over the last three years, from a 12% high to close to its 20-year median of 2.3%.
Economic Risks
Labor market signals and inflation indicators may not be flashing red right now, but they are moving from green to at least yellow. This makes the Fed’s dual mandate, a unique feature (or bug), more difficult to maneuver. What if continued deterioration in the labor market is also accompanied by higher inflation and low growth? That could mean a return to an era of stagflation like that of the late 1970s and early 1980s. While not the base case scenario, tail events are always worth considering.
Regulation is a related concern. Unhappy with disparities in generational wealth, particularly in housing, younger cohorts are voting their feelings. While investors focus on inflation, consumers focus on price levels which ultimately drive affordability. Anger, displeasure and outright hostility will eventually lead to government intervention, particularly in areas of consumer focus.
Global Capital Markets
The year began amid a backdrop of large deficits, stable employment, stubborn inflation, relatively cheap oil, and moderate real but strong nominal GDP growth. In this section, we now dive deeper into the fundamentals and returns across asset classes.
Global Currencies
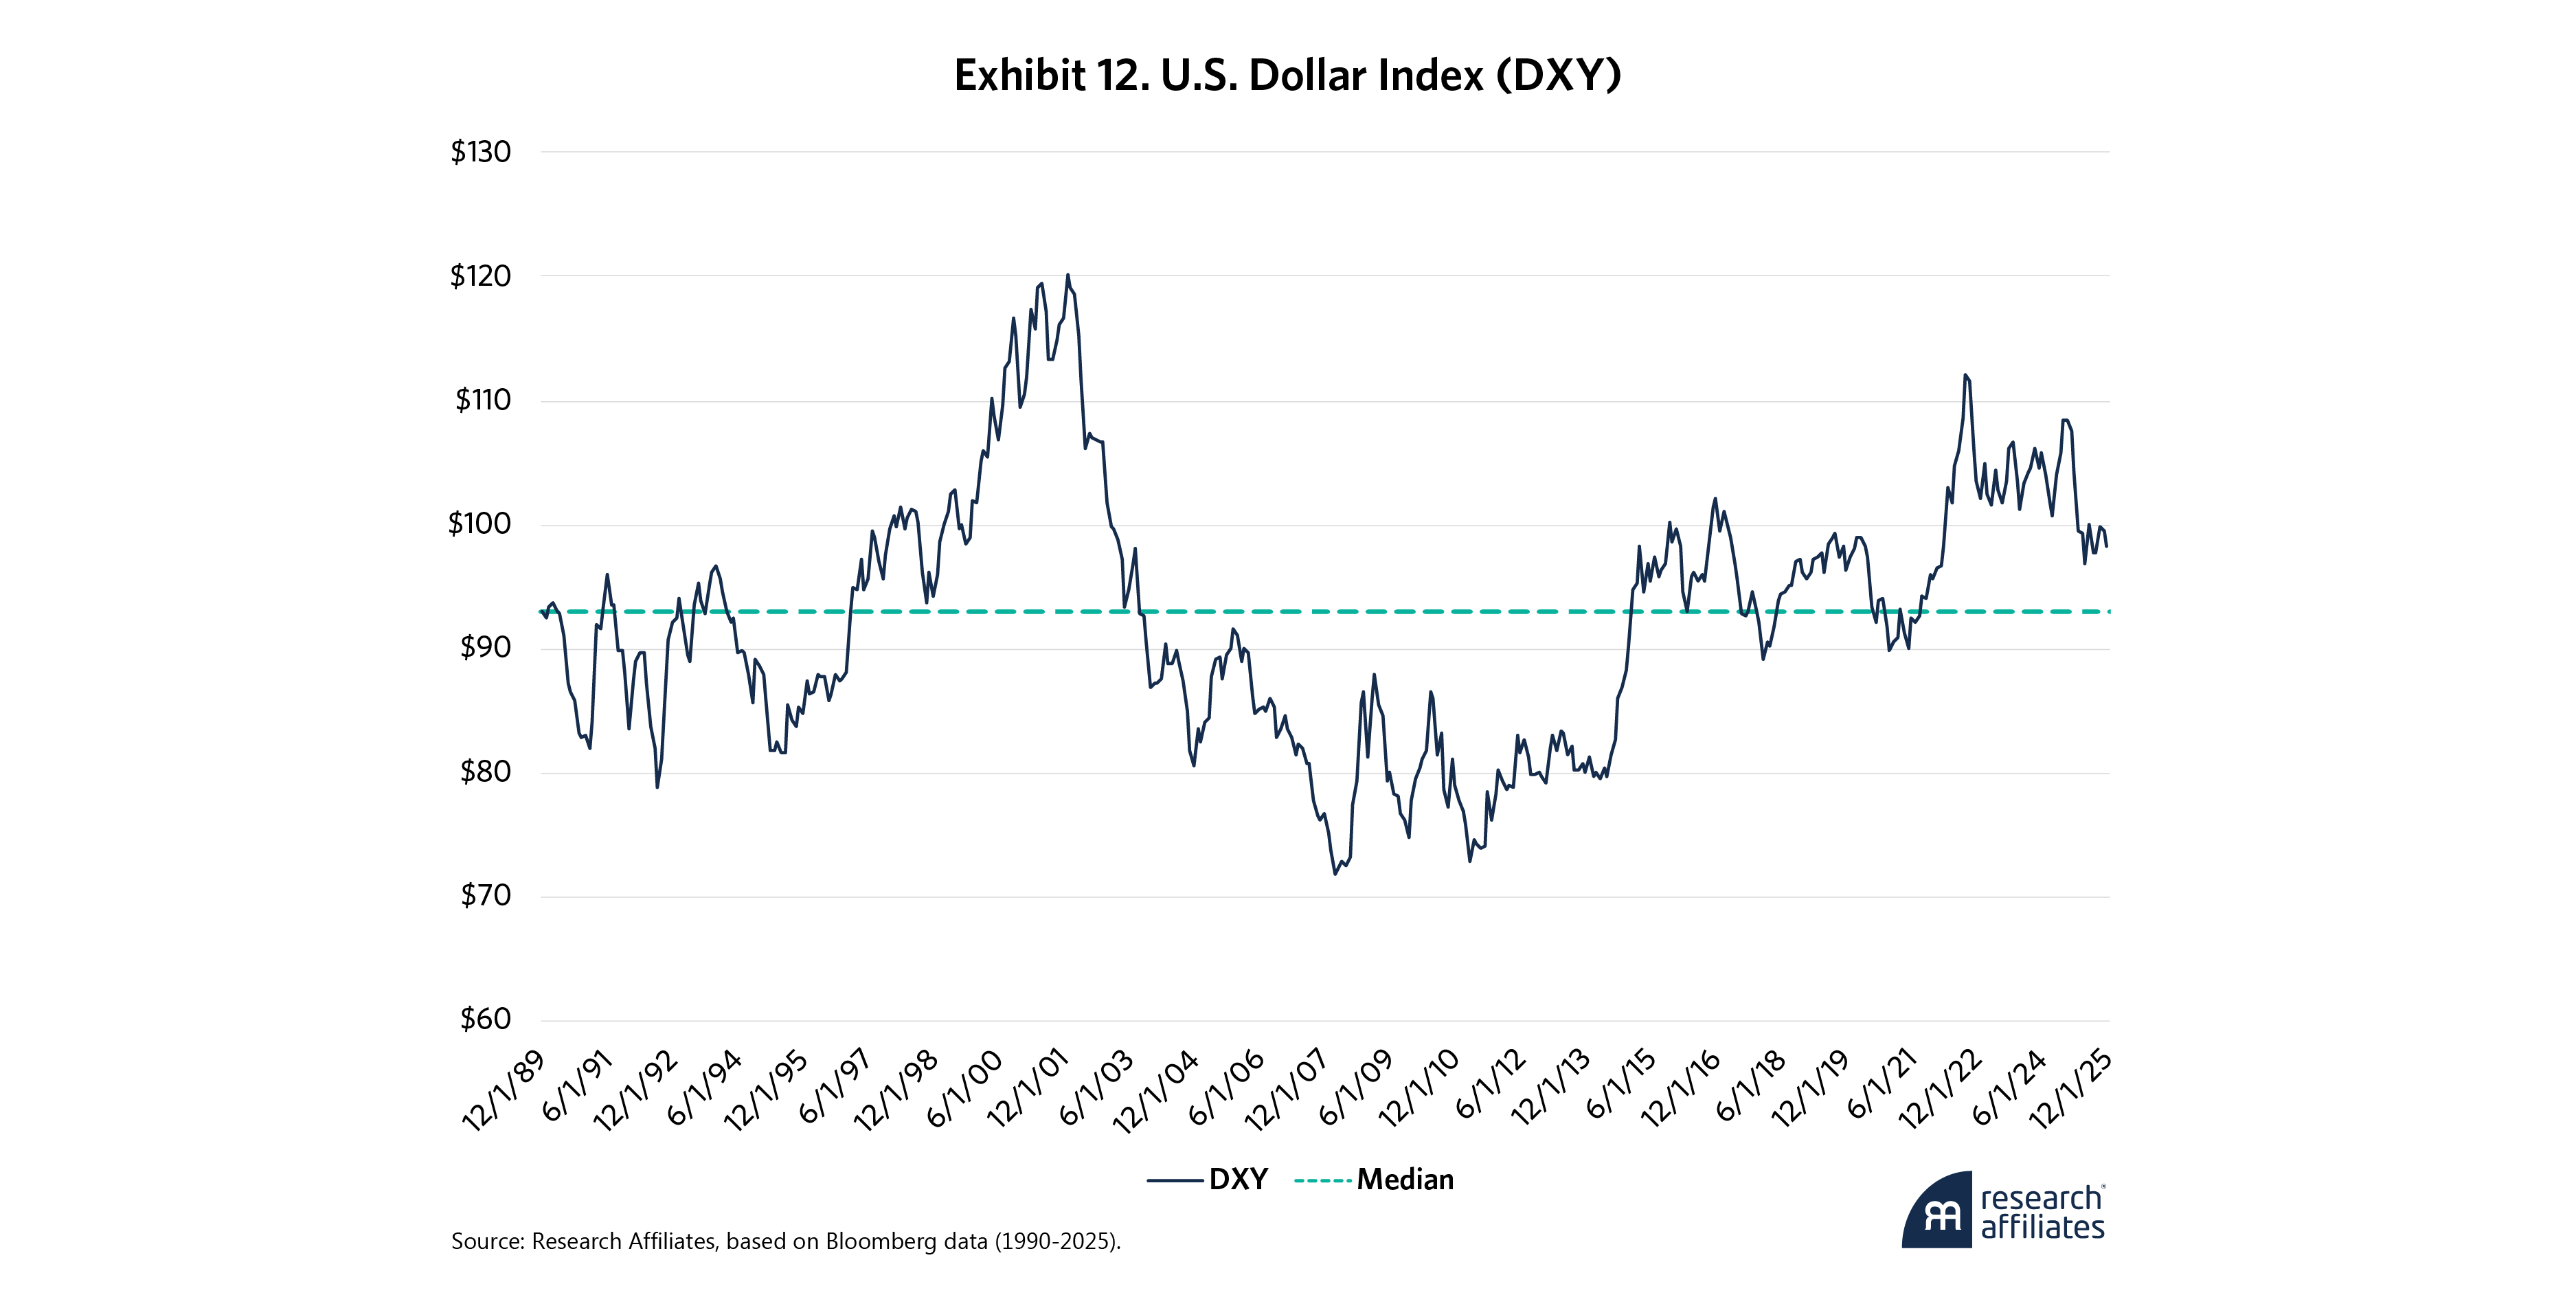
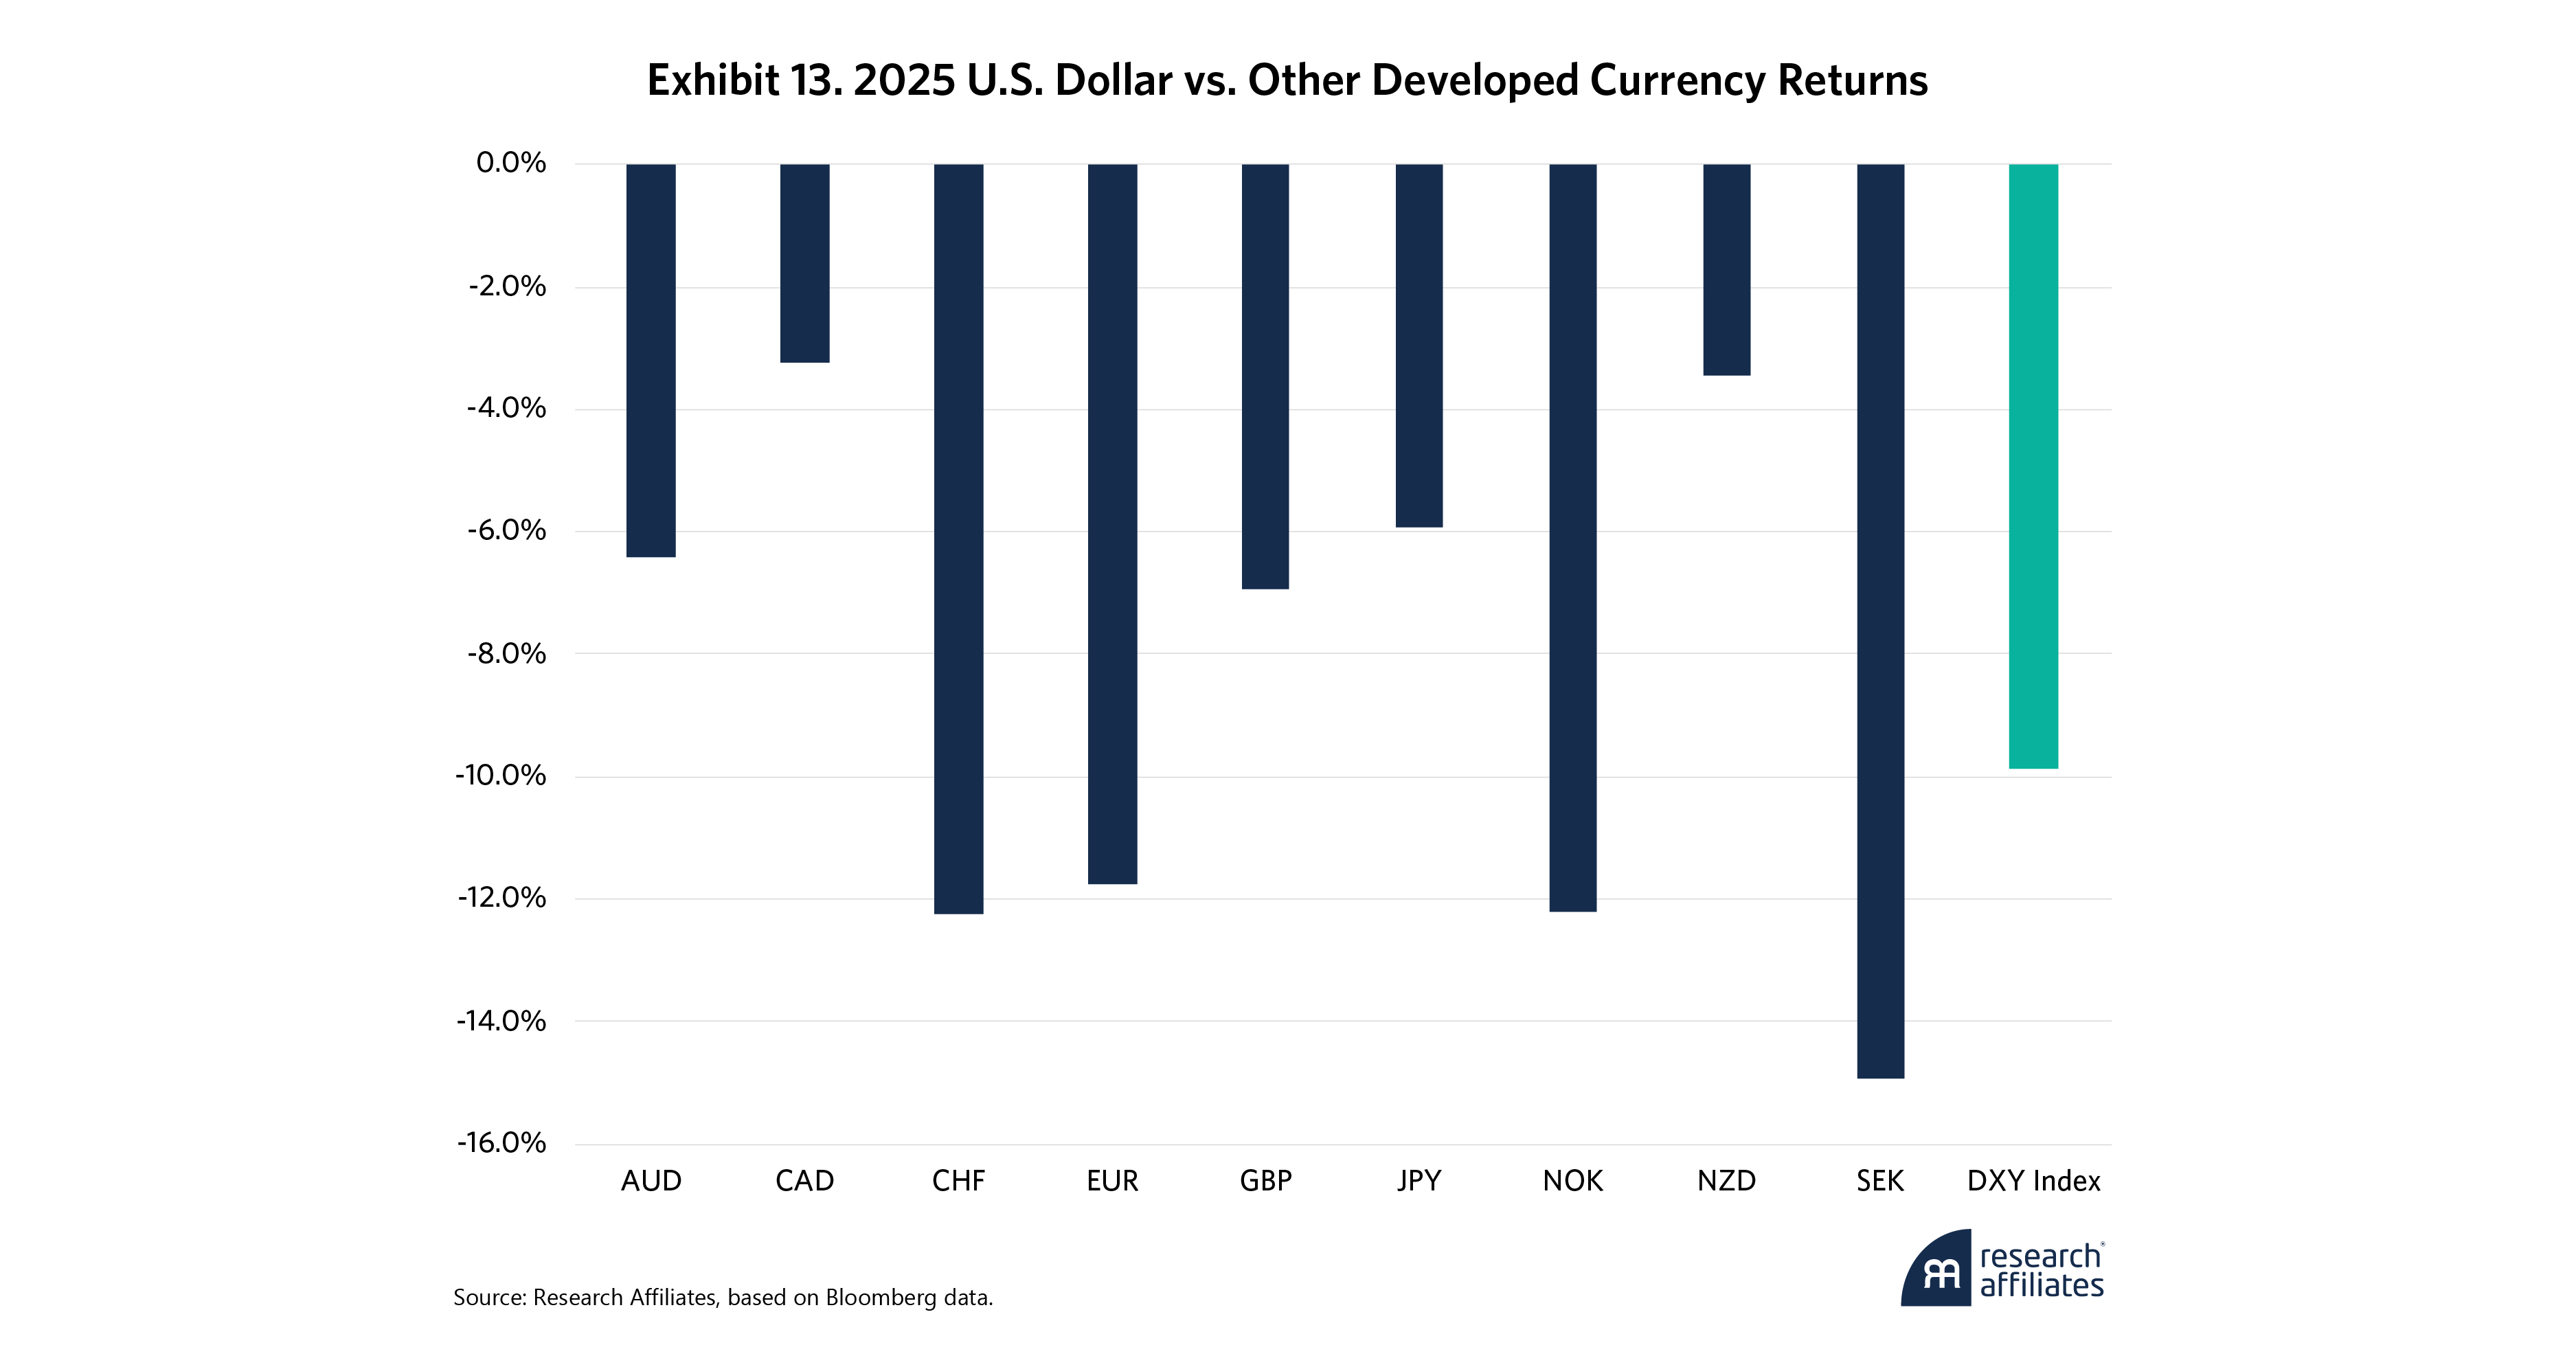
Between the U.S. election in early November 2024 and January 1, 2025, the tariff narrative took center stage. Reduced U.S. imports would strengthen the U.S. dollar due to altered supply-and-demand dynamics. That didn’t play out. The dollar weakened almost from the outset, as Exhibit 12 shows. That process actually began in late 2022, a time when our models indicated significant overvaluation (Masturzo, 2023), but paused until last year.
The U.S. dollar’s 9.4% pullback reflects an across-the-board depreciation. As Exhibit 13 shows, all currencies except the Canadian (CAD) and New Zealand (NZD) dollars appreciated by 5% or more relative to the greenback. Today, our models anticipate ongoing depreciation, although the picture will be more mixed. For example, the Swiss franc (CHF) has appreciated because of its alternative “safe currency” status but is now at a 25-year high relative to the dollar, making significant further appreciation unlikely.
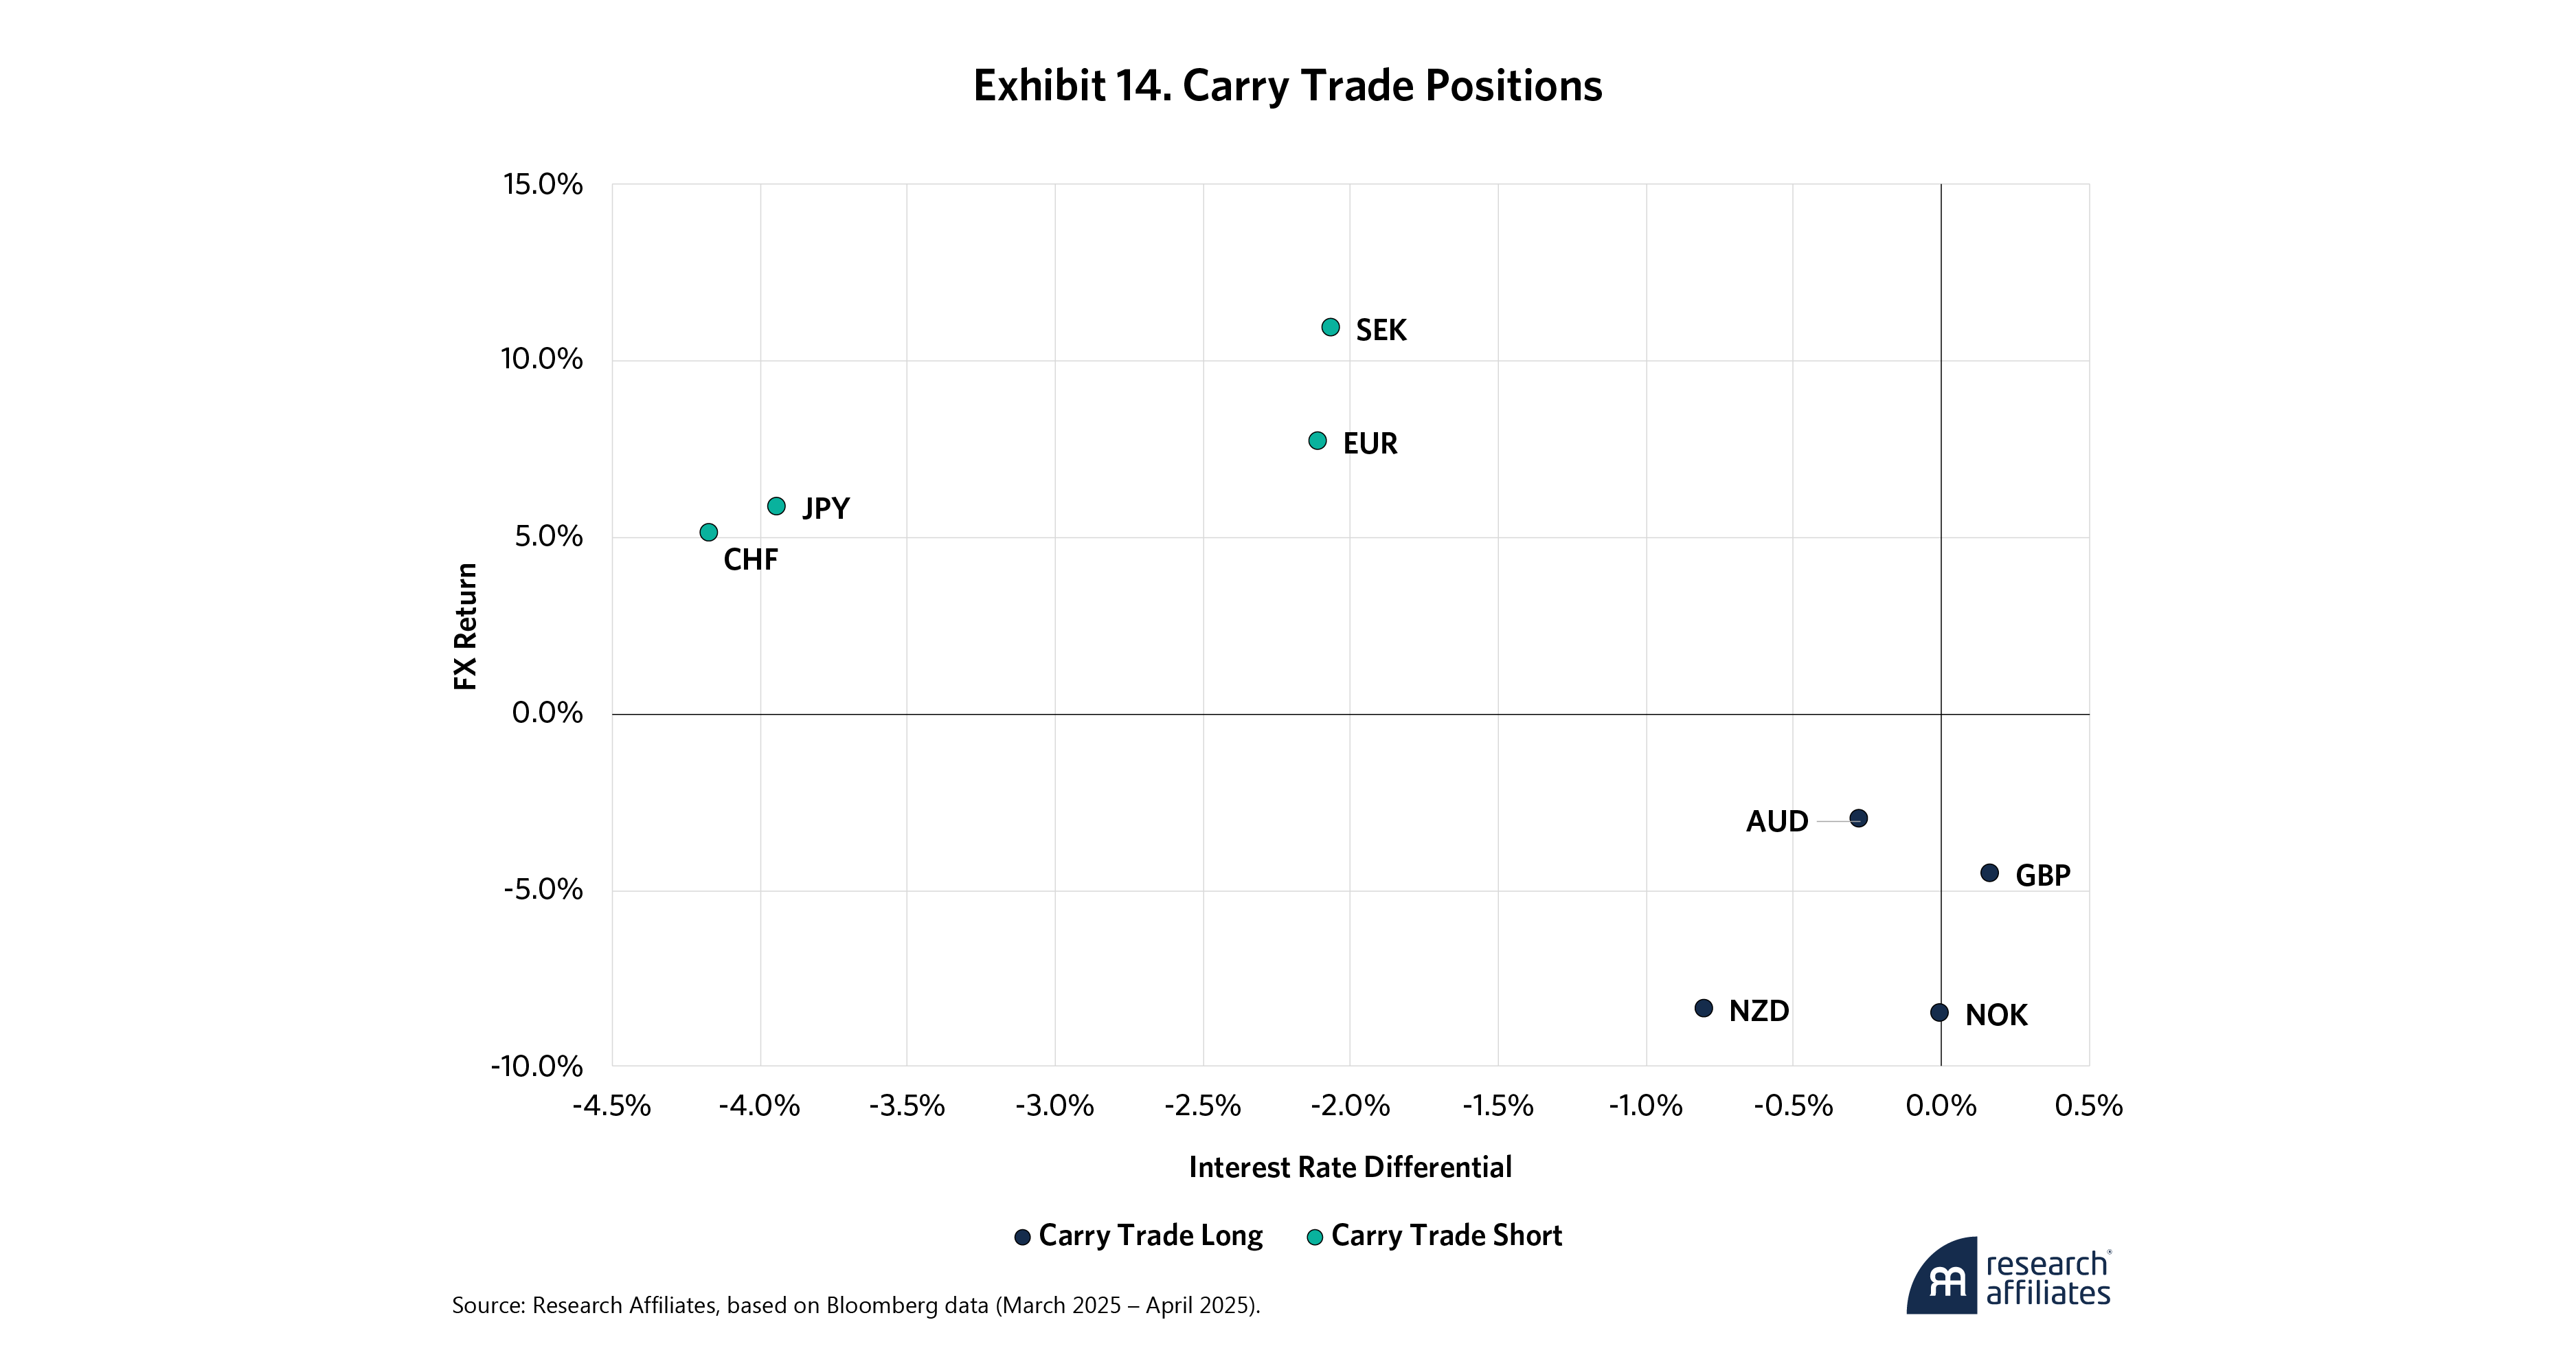
The unwinding of the global carry trade was among the more important currency trends in 2025. In the carry trade, investors go long in currencies of countries with higher interest rates and short in currencies of countries with lower rates, effectively borrowing in low-interest-rate countries to earn higher interest rates elsewhere. As long as the FX rates stay steady, carry trade investors earn the spread.
But this year, FX rates moved materially in the opposite direction of the carry trade. Lower-interest-rate countries saw FX appreciation against their higher-interest-rate peers. Carry traders went from years of picking up a wealth of pennies in front of the proverbial steamroller to meeting the steamroller. As an example of the losses, Exhibit 14 shows each country’s interest rate differential to the U.S. on the x-axis and each currency’s subsequent FX return along the y-axis during the excessively turbulent months of March and April. Countries with short carry positions are represented by teal dots; positive returns in their currencies add up to losses for carry investors. Countries with long carry positions are indicated by blue dots, and their currencies’ relationship to the carry trade are the opposite of their teal counterparts, that is, positive returns in these currencies translate into gains on the carry trade. In this case both sides of the trade lost, with unlevered carry trade losses of 5% to 10% over the period, but these were often much higher since carry trades are usually meaningfully levered.
Liquid Alternatives
Liquid alternatives come in many varieties. Long-short derivative strategies with strong risk-adjusted returns that incorporate leverage to achieve the desired return with the commensurate level of risk. The focus here is common indices that represent three liquid alternative categories: trend following, ARP, and market neutral equity. Unlike asset class indices, these are comprised of actual, net-of-fees returns from a set of portfolio managers.
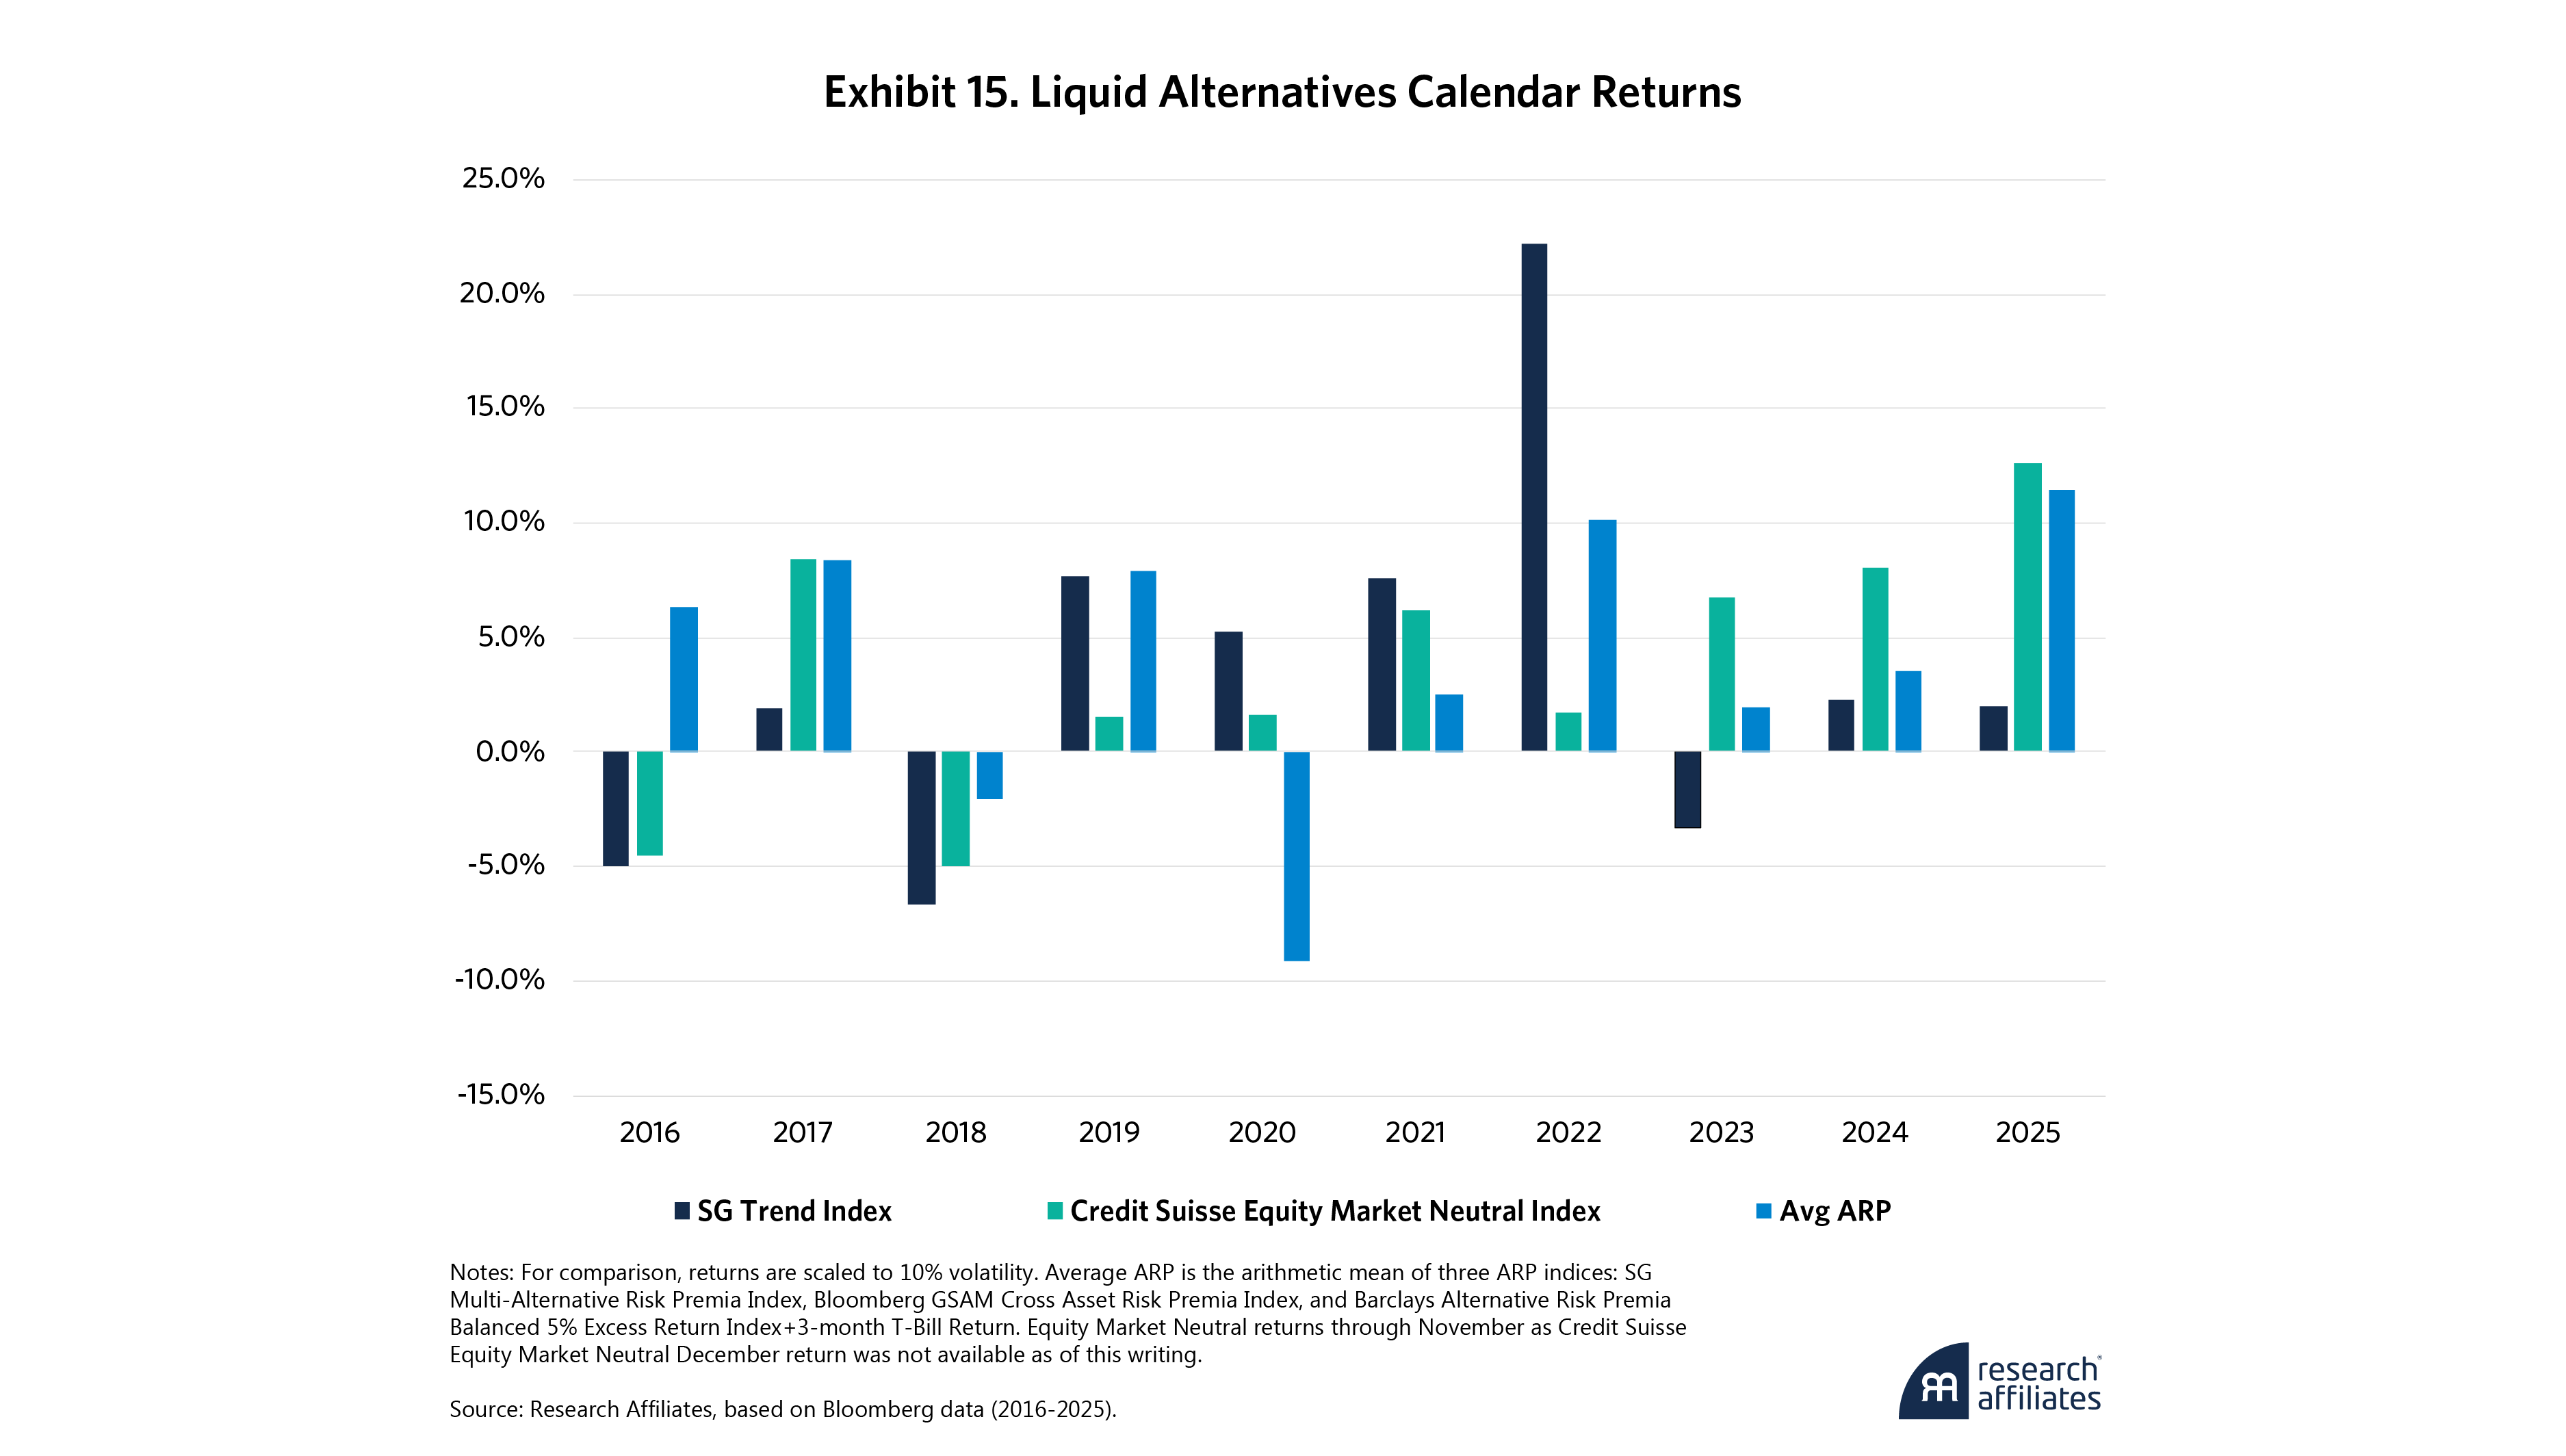
All three were positive in 2025, as Exhibit 15 shows, but their 2021 and 2022 performance, amid peaking inflation and double-digit drawdowns in global stocks and bonds, is probably a more critical consideration. In that tumultuous period, these strategies did their job and provided diversification, a quality that may be even more important if inflation stays hot, and inflation volatility rises.
Global Equities
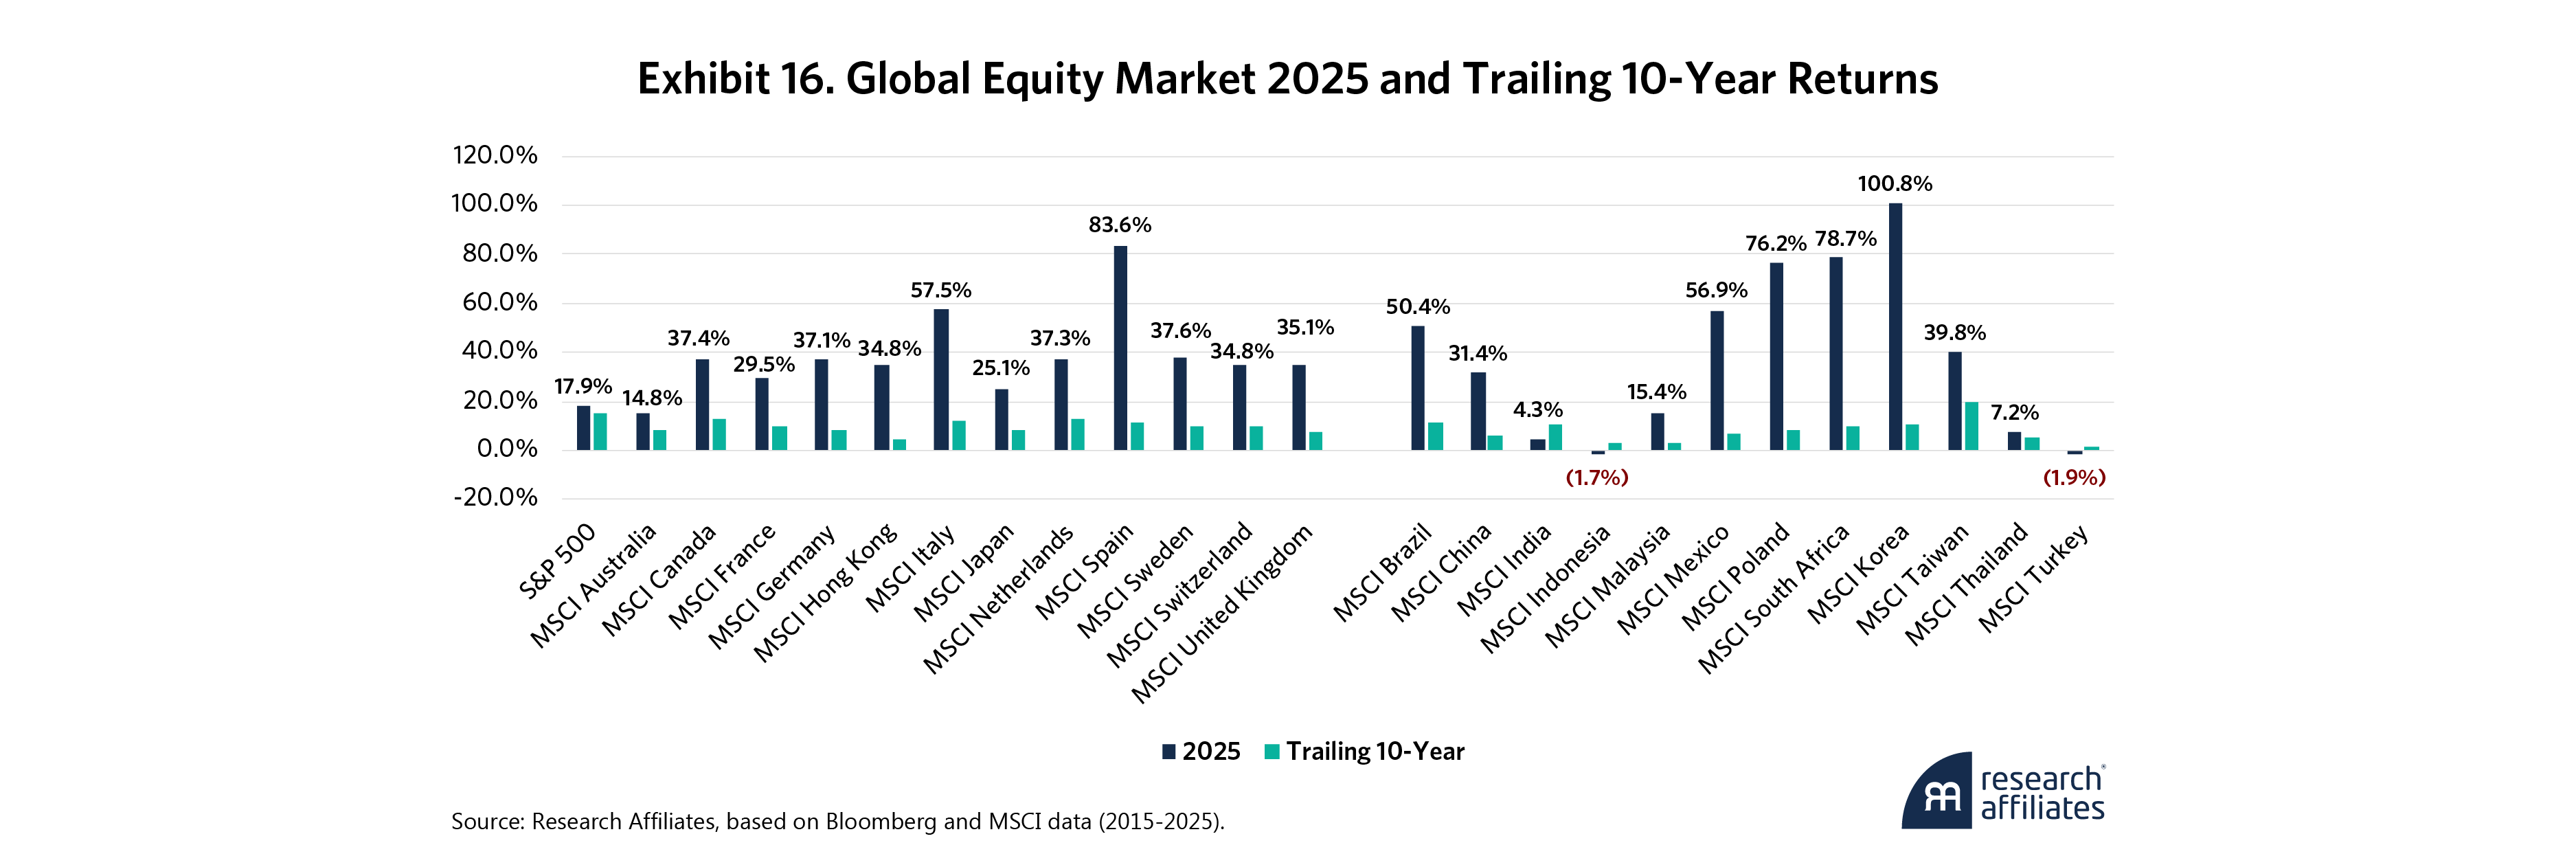
Equities everywhere had a fantastic year in 2025. This was particularly true in U.S. dollar terms as the currency’s depreciation aided U.S. investors in foreign equity. Not only were double-digit gains the norm in most markets, but as Exhibit 16 shows, they closed out an exceptionally bullish decade, with the S&P 500’s 15% total return per annum coming in second, behind only the Taiwanese market and its “Magnificent One,” TSMC.
To many, the big surprise amid this year’s equity surge is that developed and emerging markets led the charge. We’ve long recognized these opportunities, and last year noted the particular opportunity in Eastern Europe (Research Affiliates, 2024). Our call proved prescient as Polish equity returns exceeded 75% in 2025.
Elsewhere, Spain’s resistance to increased defense spending relative to other NATO members has not hindered its equity market or its surging banking sector. India, Indonesia and Turkey were the main laggards. The disappointing performance of the former is no surprise to us since India’s cyclically-adjusted price-to-earnings multiple, currently still at 36, is well above our fair value estimate of 26.
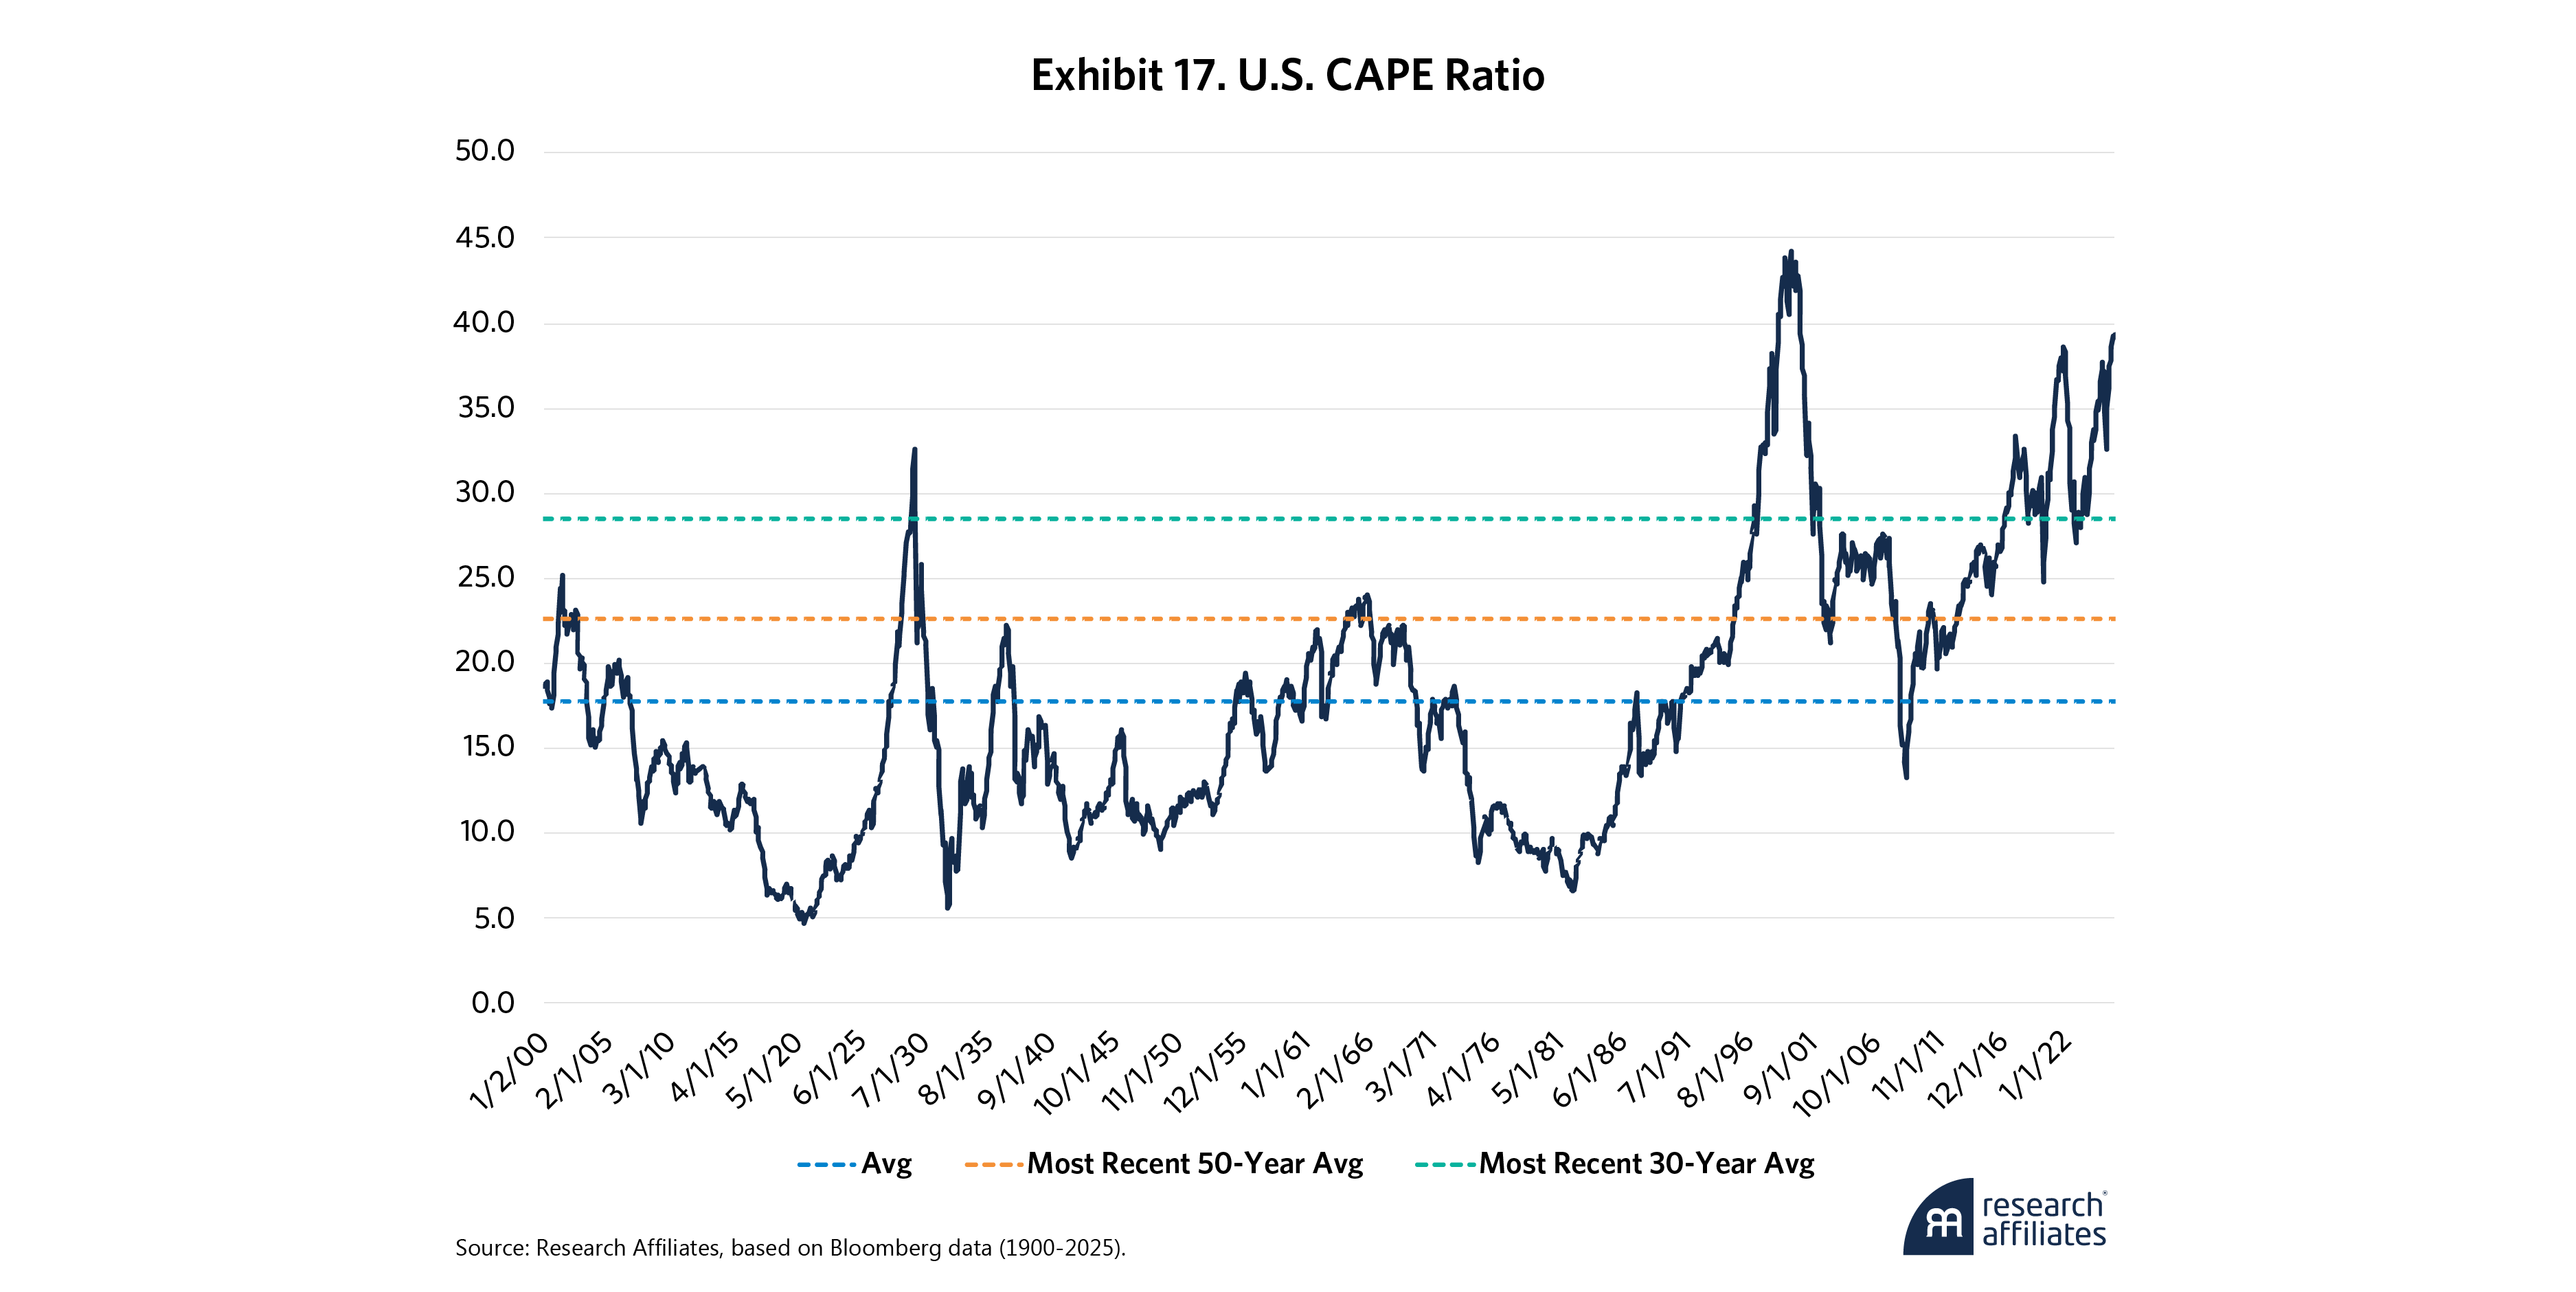
Price appreciation in global equity markets and the U.S. especially did not come with equivalent earnings-per-share (EPS) growth, leading to expensive P/E multiples. The U.S. CAPE is now 40, near its all-time tech bubble high of 44. For comparison, Exhibit 17 shows that the average CAPE since the start of the 20th century and the average 50-year CAPE are about 18 and 22.5, respectively, implying a current overvaluation from those levels of between 43% and 55%. A more conservative 30-year approach that begins in 1995, at the onset of internet commercialization, delivers a fair value of 28. Even that implies a 28% overvaluation. Even if EPS growth corrects for half of that difference, it still leaves a 14% gap for price reductions.
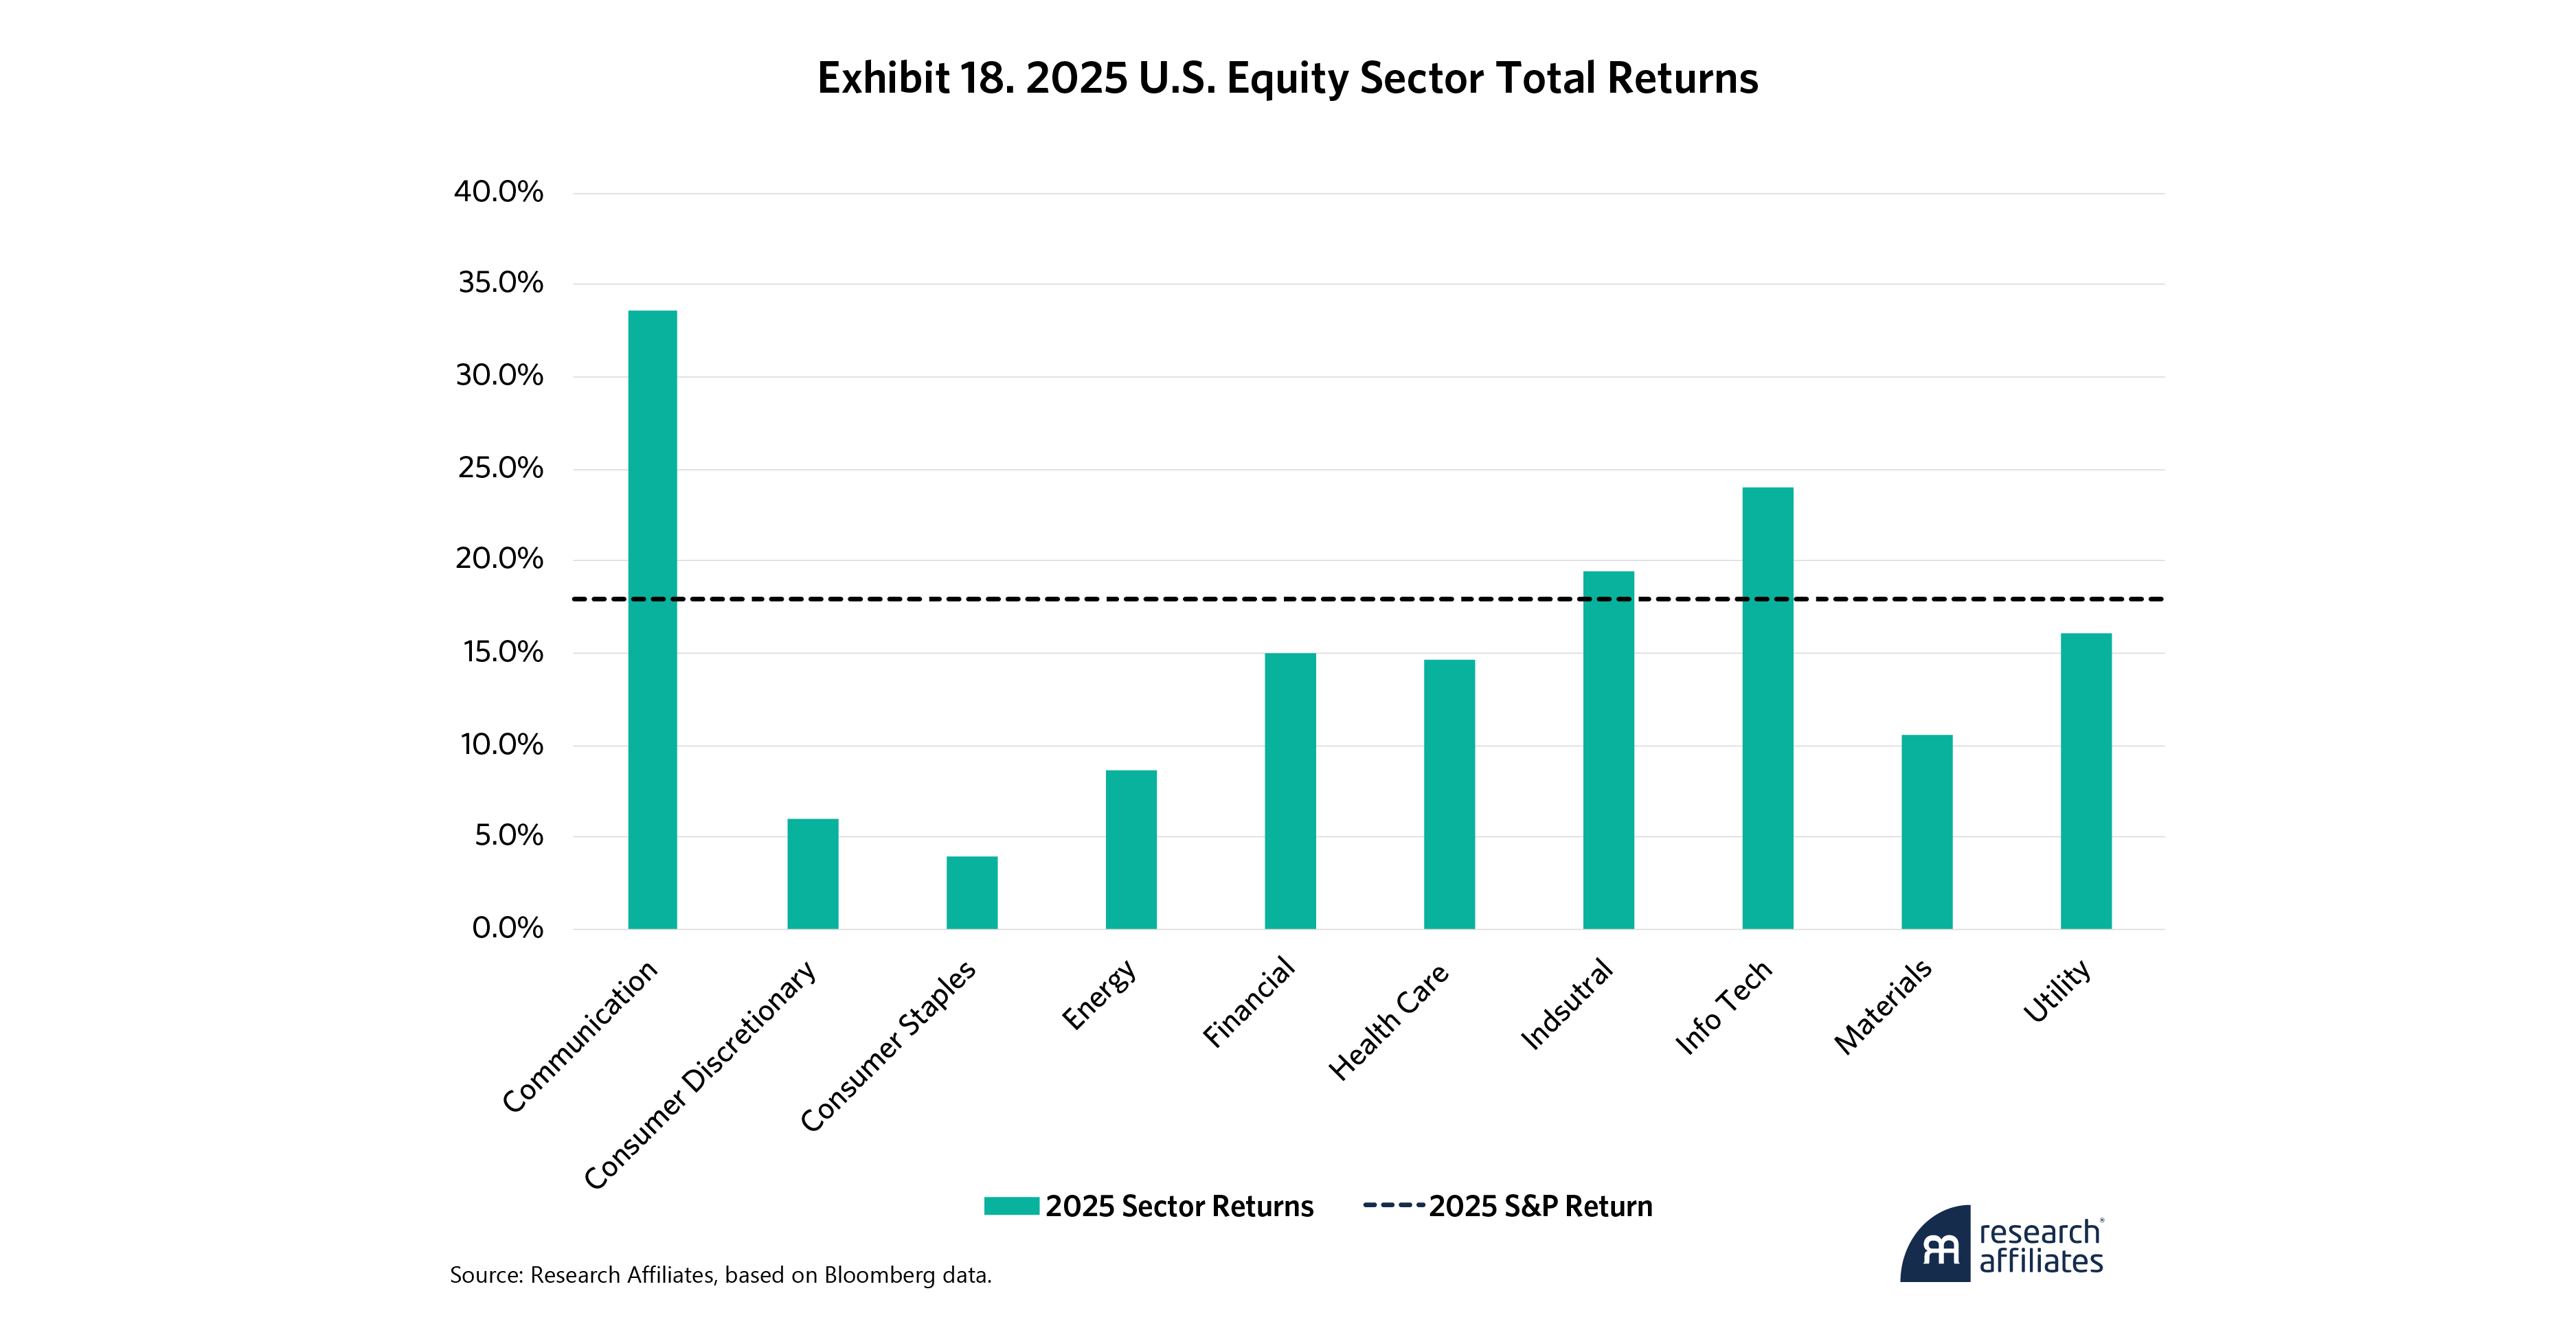
Drilling down into U.S. equity sectors, advanced technology companies were the top performers, led by communications and IT, which returned more than 20%. AI innovation boosted utilities amid greater energy demand. On the other end of the spectrum, consumer sectors and energy brought up the rear despite positive returns. Going forward, we’ve already discussed the outperformance opportunities for discretionary, healthcare and energy.
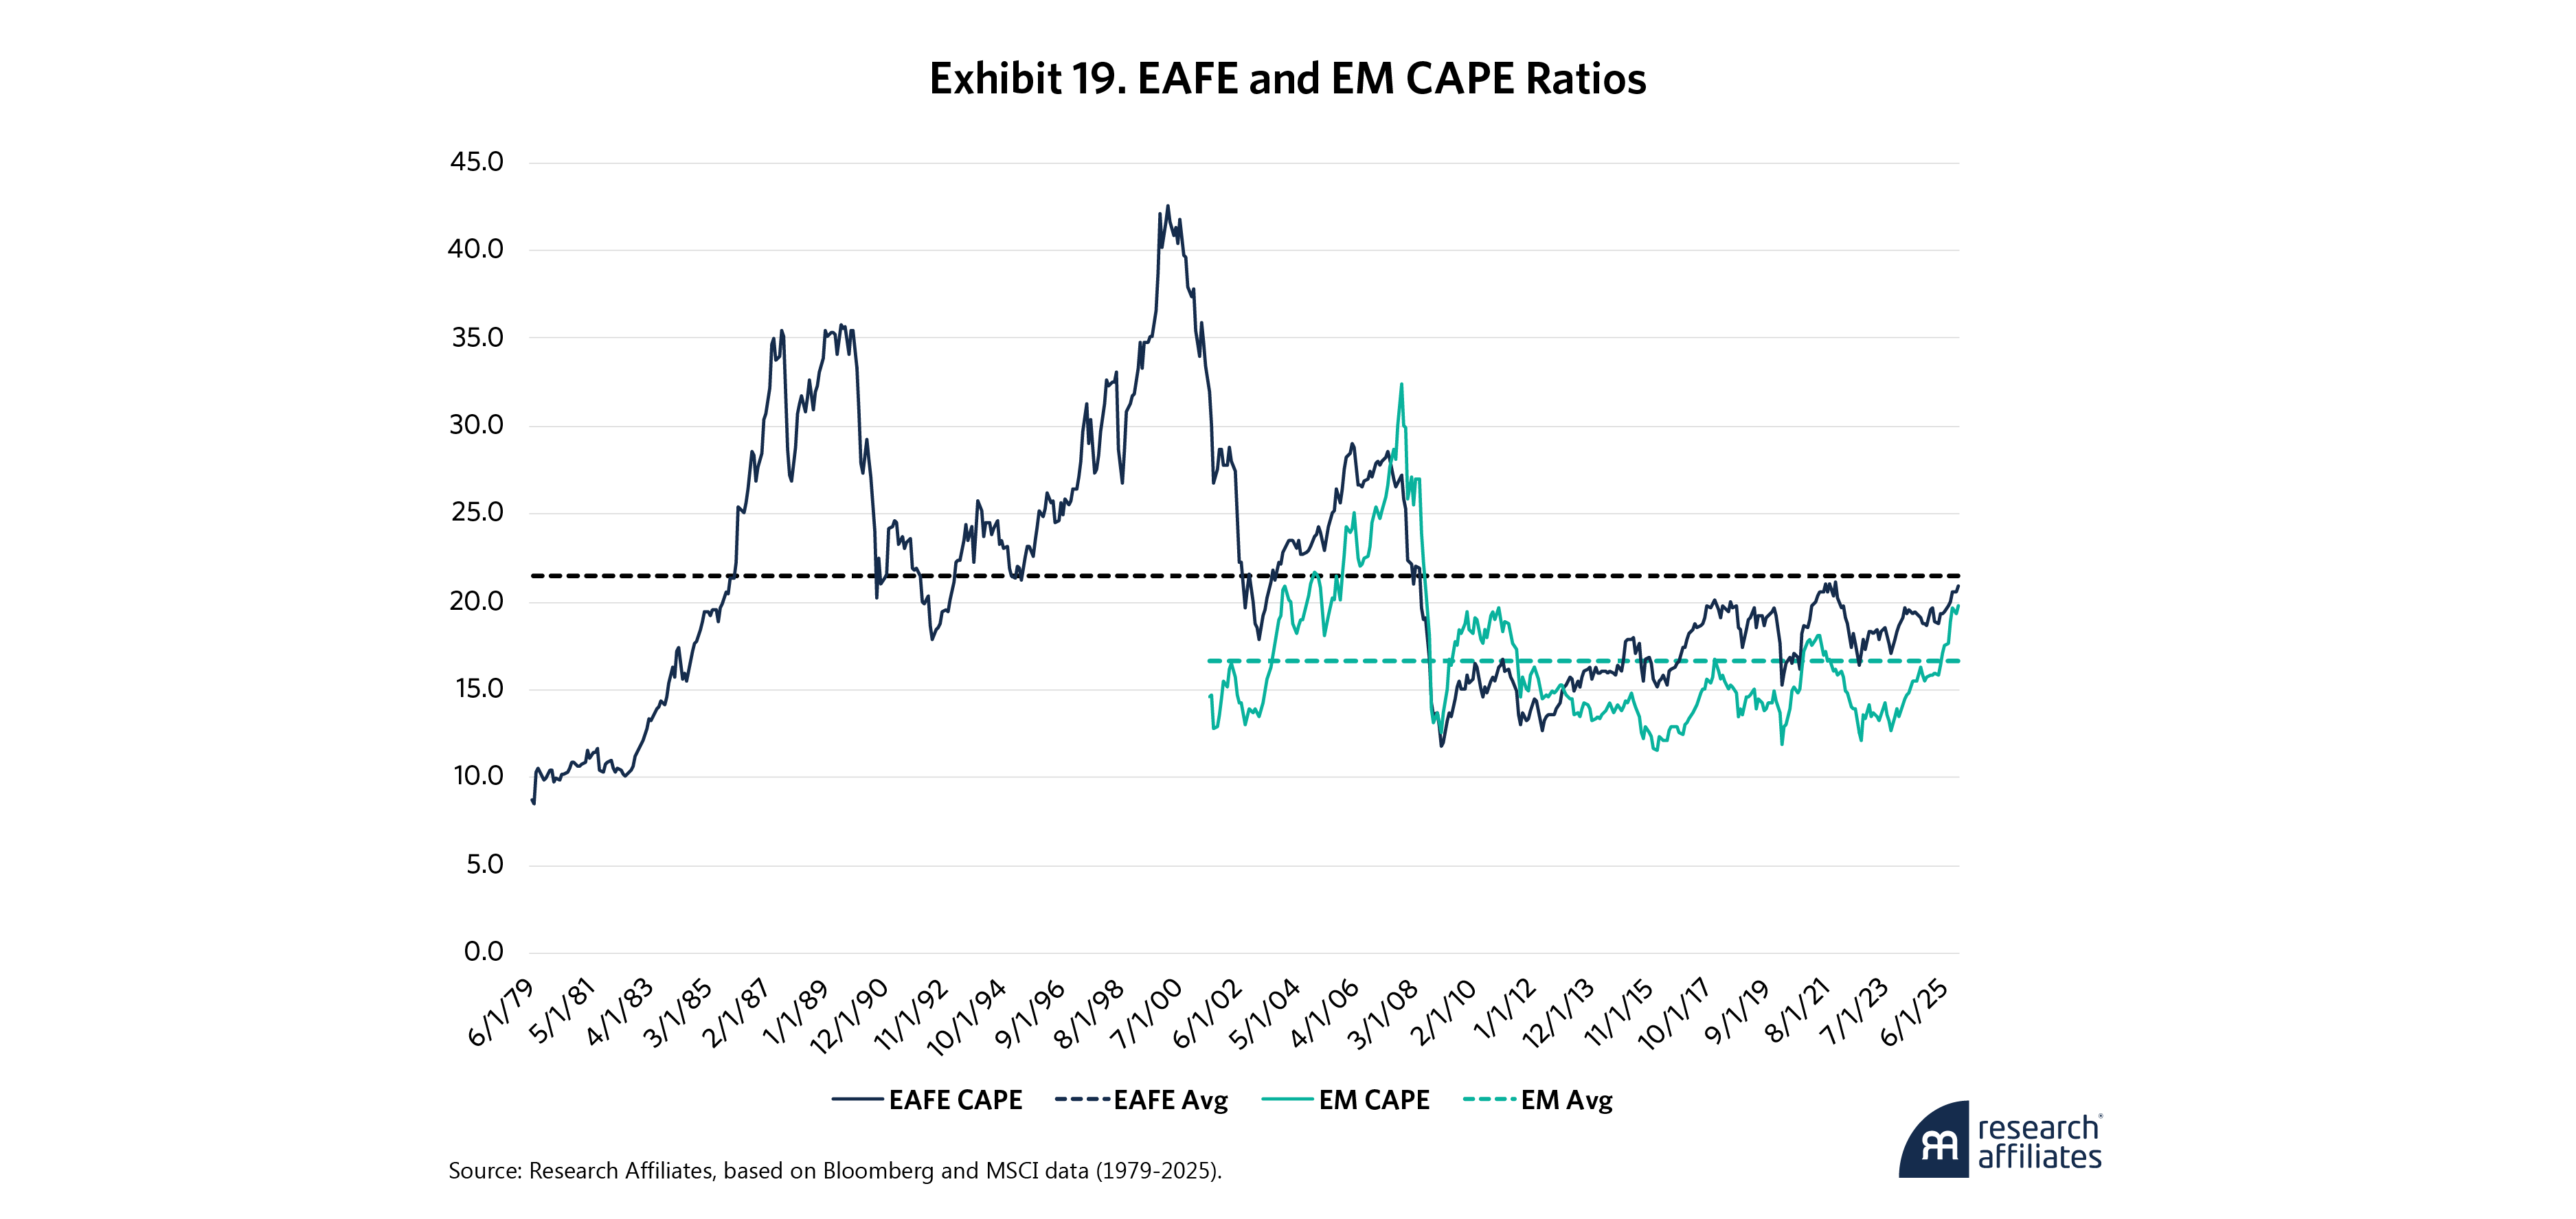
While CAPE and other valuation metrics may help identify when assets or markets are over- or underpriced, they are much less useful in anticipating when mean reversion will occur. With that in mind, we cannot say a U.S. equity crash is imminent, but investors should consider cheaper alternatives, such as developed (EAFE) and emerging markets. As Exhibit 19 shows, EAFE has averaged a 22 CAPE over the last 50 years or so. That indicates a 5% premium compared to its current CAPE of 21. After their 2025 run, emerging markets now trade at around 20, above, but in the neighborhood of, their historical average of 17. At these levels, EAFE and emerging markets have much more attractive fundamentals than U.S. equities.
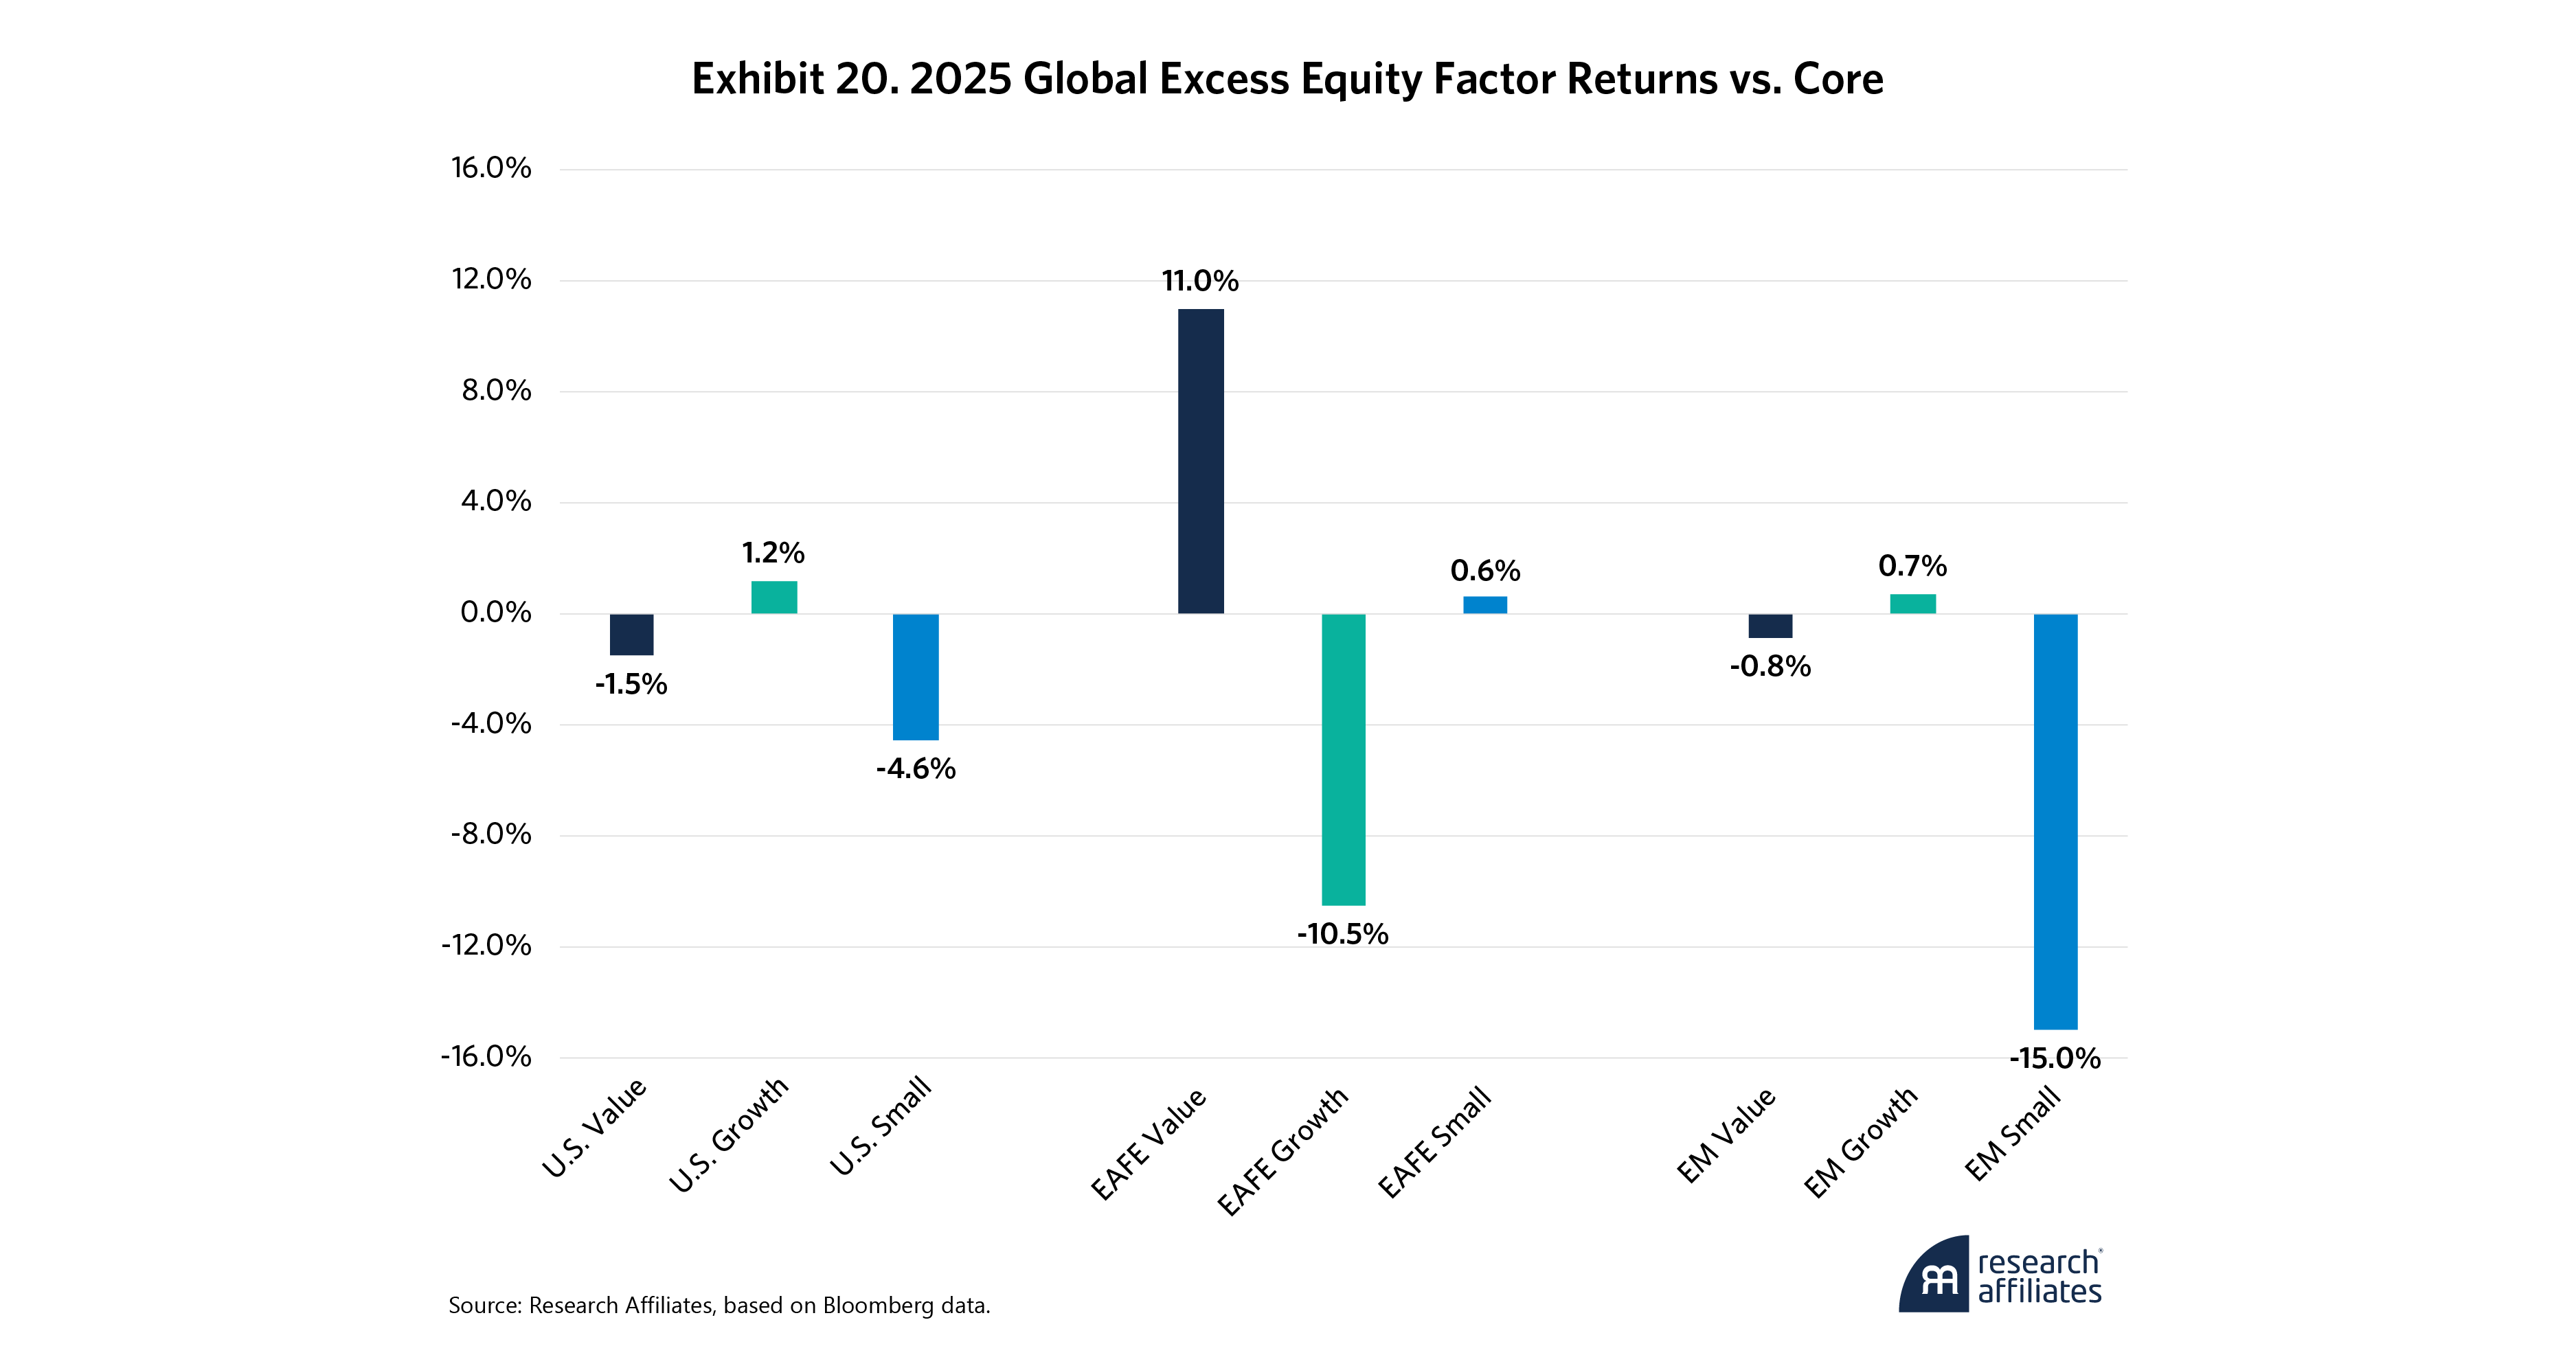
But what about the outlook for equity factor strategies? How do value, growth and size fit into the global equity discussion? Exhibit 20 shows the performance of these factors relative to the core portfolio in each of the three regions, U.S., Dev Ex-U.S. (EAFE) and EM. Value continued to trail growth in the U.S. as the Magnificent Seven tech giants and AI mania drove the market. Growth also outperformed, although modestly, in EM, while attractively valued companies surged in other developed markets.
Globally, large-cap companies continued to dominate small caps in the U.S. and particularly in EM, where again developed markets were the outlier as small outperformed.
Global Fixed Income
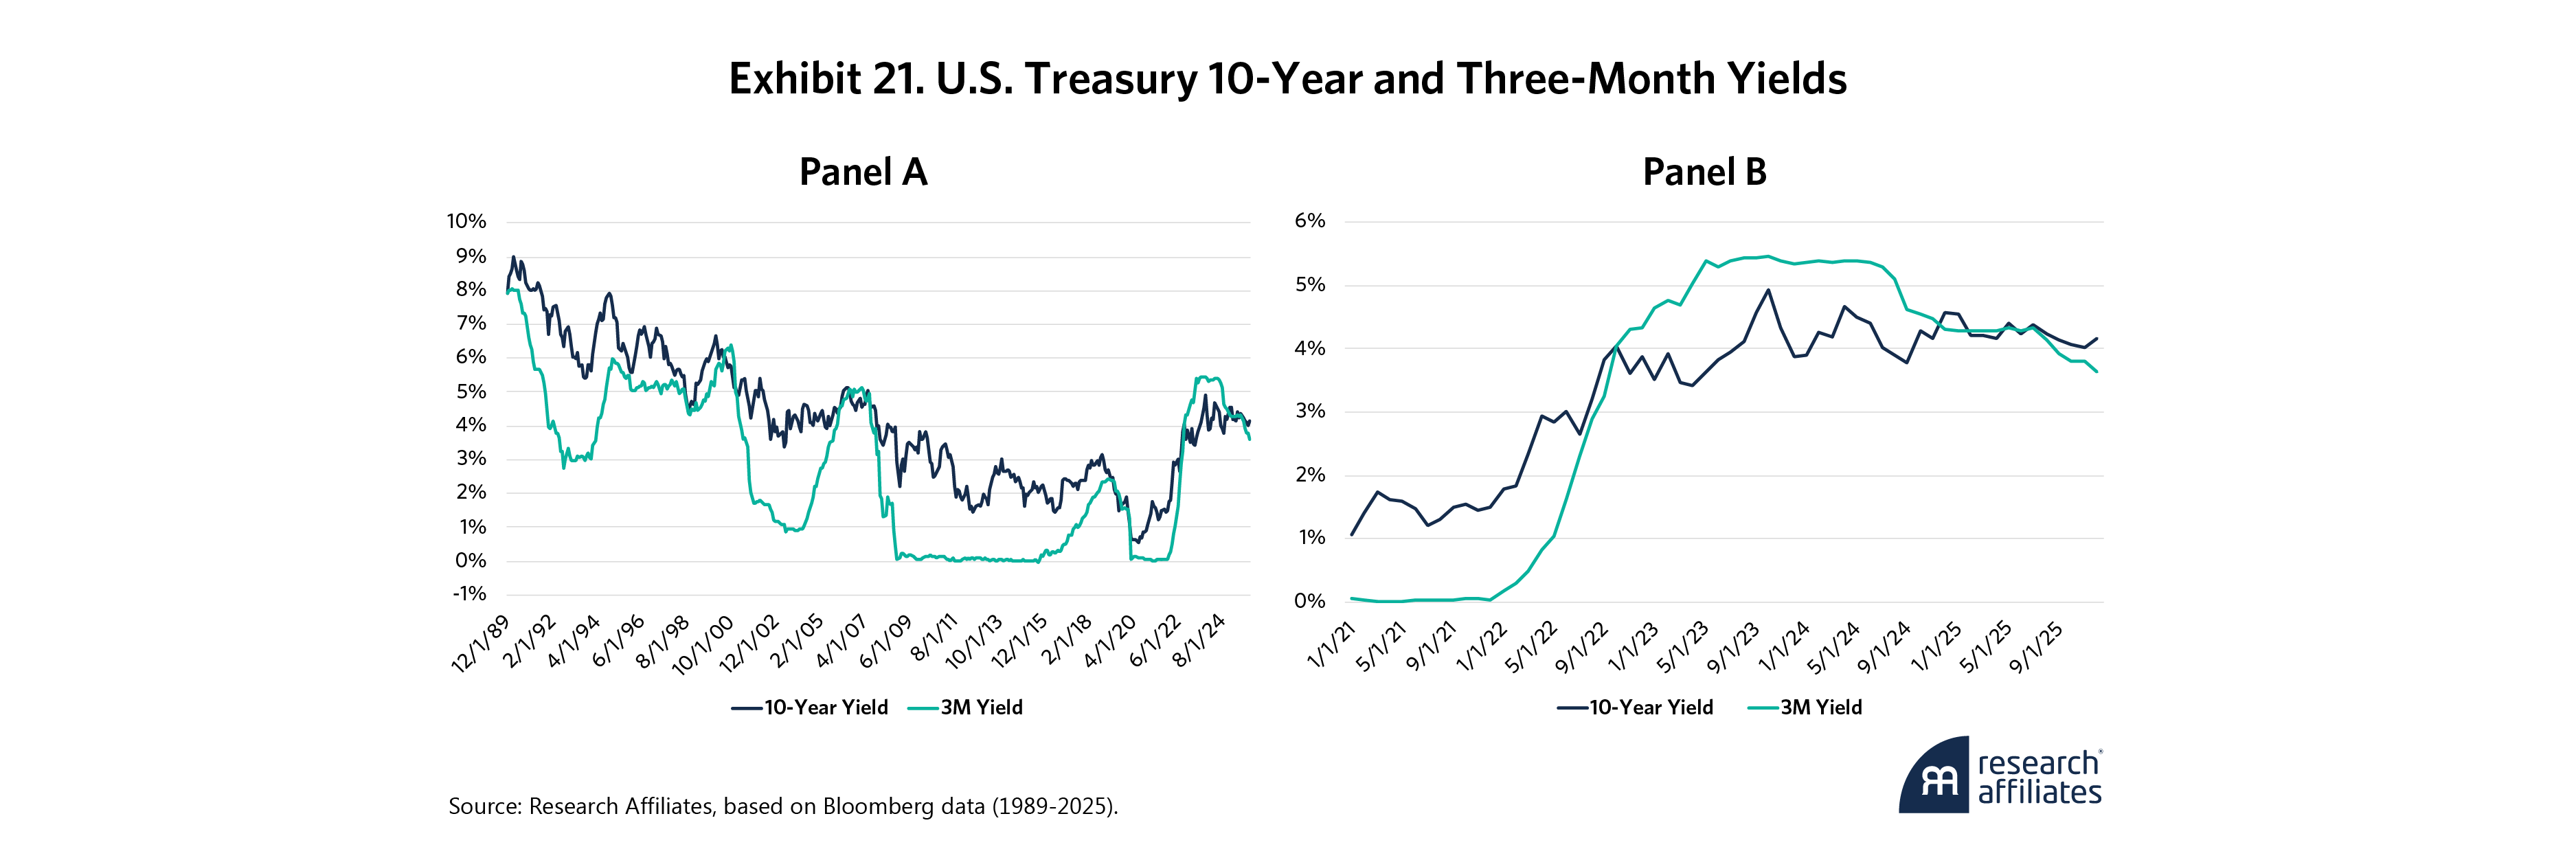
The gloomy U.S. fiscal outlook has led many to expect a dramatic rise in U.S. long-term rates. While this perspective may have some merit, it was not realized in 2025. As Exhibit 21 shows, rates ended the year lower than in January 2025 for the three-month and the 10-year.
Even in historical context, which is admittedly biased by the ultra-low rates of the 2010s, interest rates have only reverted to 2005 and 2006 levels, and so far there is no need for alarm. Indeed, in the 30 months since summer 2023, 10-year interest rates have stayed largely range-bound between 3.75% and 4.75%, presenting a buying opportunity at the top and a selling opportunity after rates tightened. Rinse and repeat. Absent recession, this pattern is expected to hold.
While flat for most of the year, short duration rates have finally fallen below 10-year rates and the yield curve slope is again positive at 50 bps today, as Exhibit 22, Panel A, shows. Historically this slope has averaged 160 bps. The two-year yield, which is less monetary policy-dependent than the three-month, has fallen relative to three-month and 10-year yields, and now has a positive slope at about 70 bps, close to its 80 bps average.
A curve that’s flatter than the mean anticipates a steeper slope in the future. That can come from a “bull steepener” of lower rates on the short end of the curve or a “bear steepener” of increasing rates at the longer end. With the Fed’s emphasis on cutting rates, at least in the short-term, bull steepening is the likely outcome.
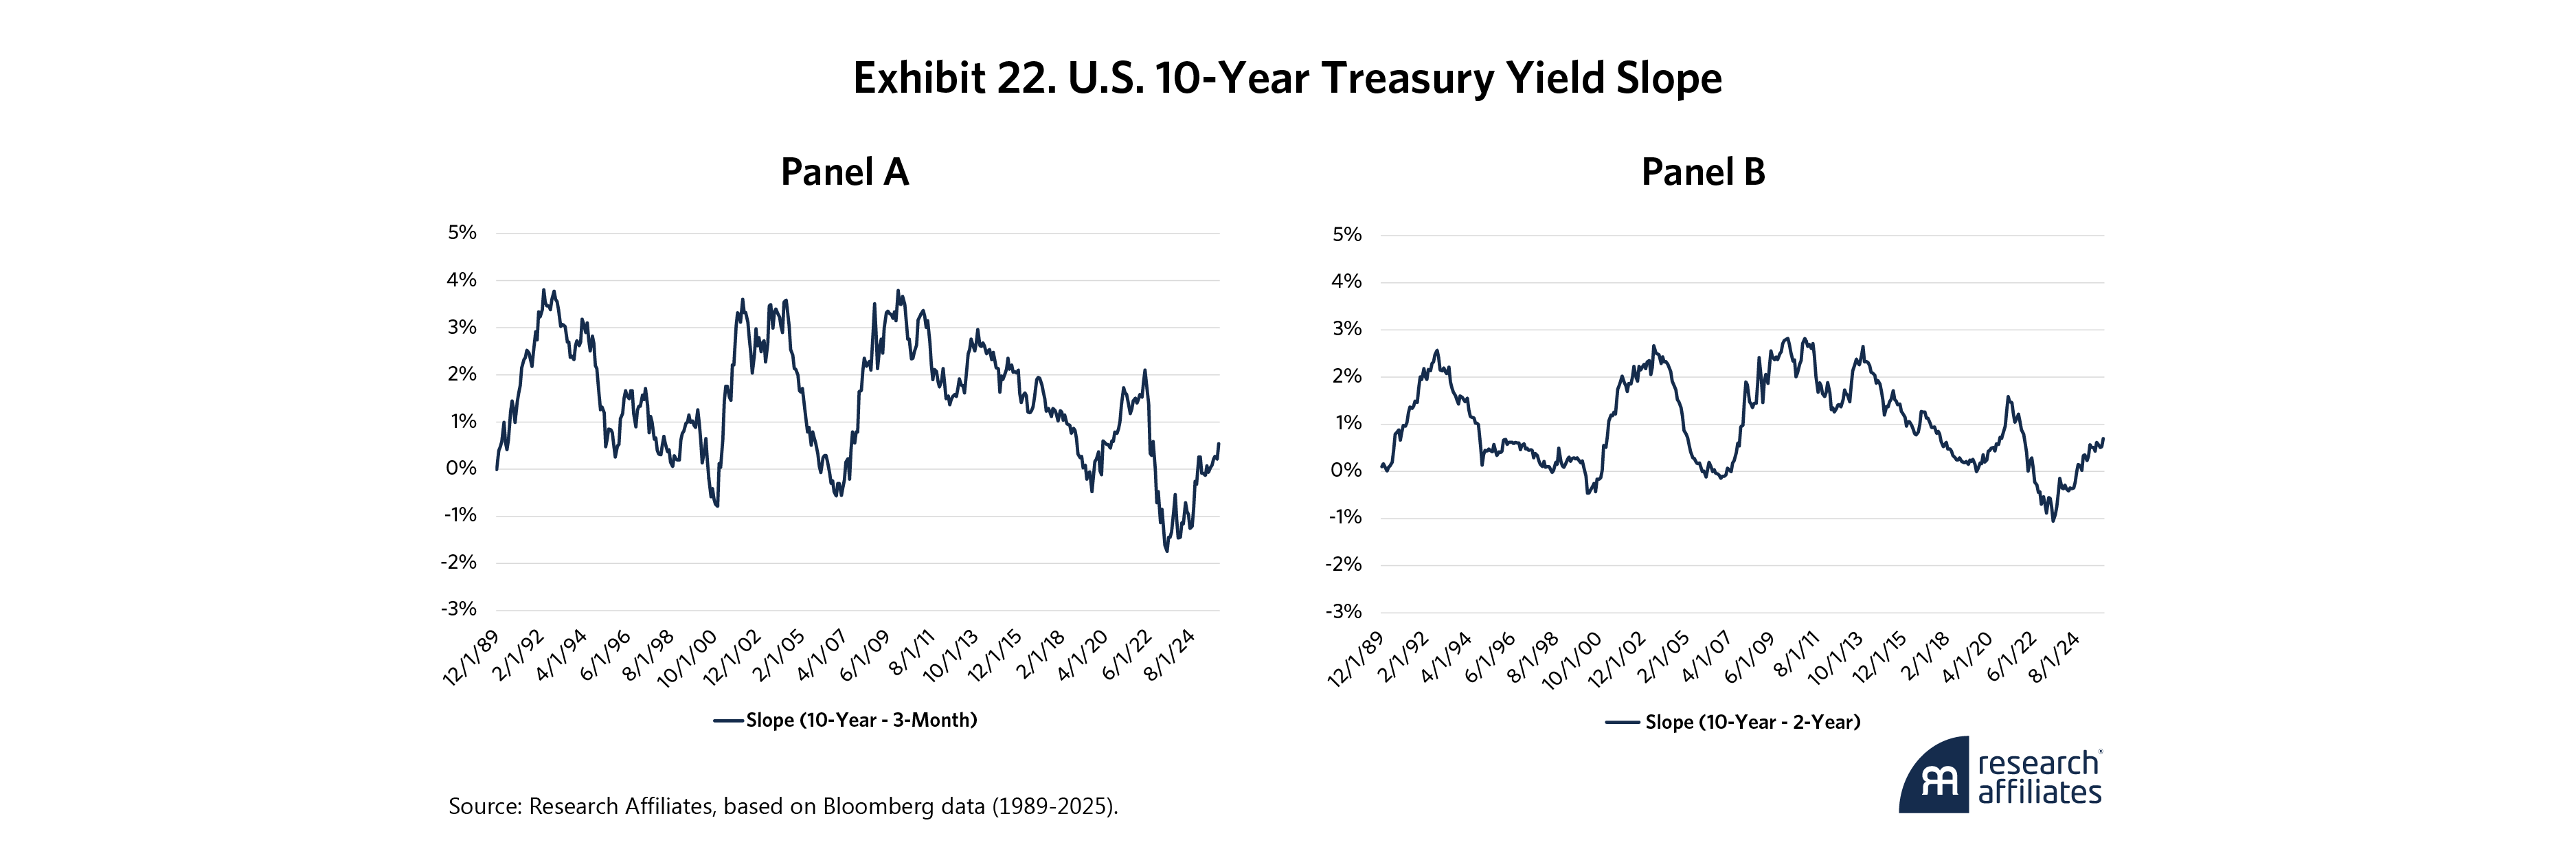
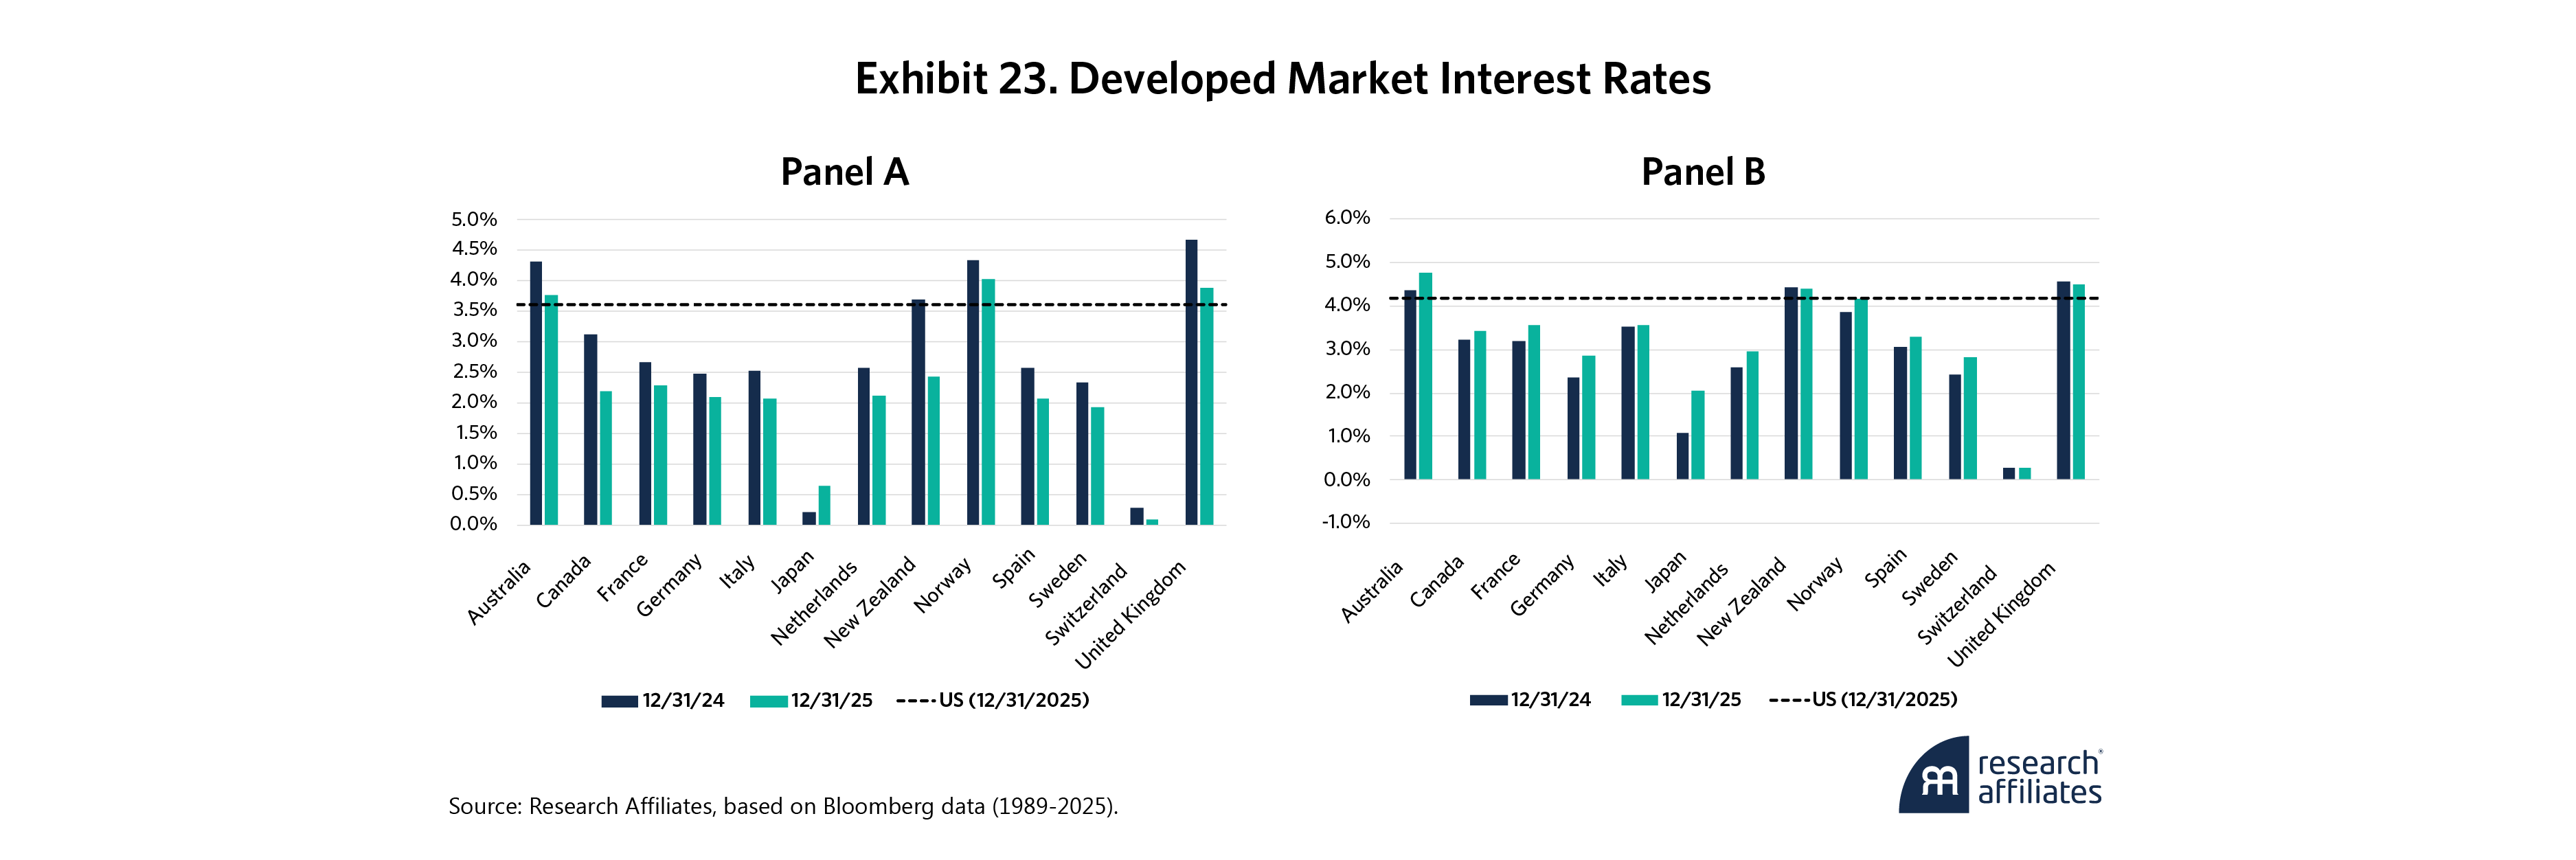
Exhibit 23, Panel A, shows global short rates have fallen around 50 bps on average, and three-month yields are currently lower than those in the U.S. in all developed countries except the U.K., Australia, and Norway. The story is different at the 10-year part of the curve where rates have generally increased during the year, but are still mostly lower than in the U.S.
Japan and Switzerland are the obvious outliers. The former is slow marching to marginally higher rates, while the latter has returned to zero, and in some cases negative, rates to match the strength of the Swiss franc. A small, export-driven economy with conservative fiscal and monetary policies, Switzerland holds a unique position in the world and is perceived as a safe haven of sorts.
Credit Bonds
“When you see one cockroach, there are probably more,” JPMorgan Chase CEO Jamie Dimon warned following some large credit write-offs in October (Noonan, 2025). The additional pests have yet to materialize to any great extent and U.S. credit spreads have not increased, but with the proliferation of zombie companies with interest payments exceeding their EBITDA, more roaches may soon scurry out from under the refrigerator.
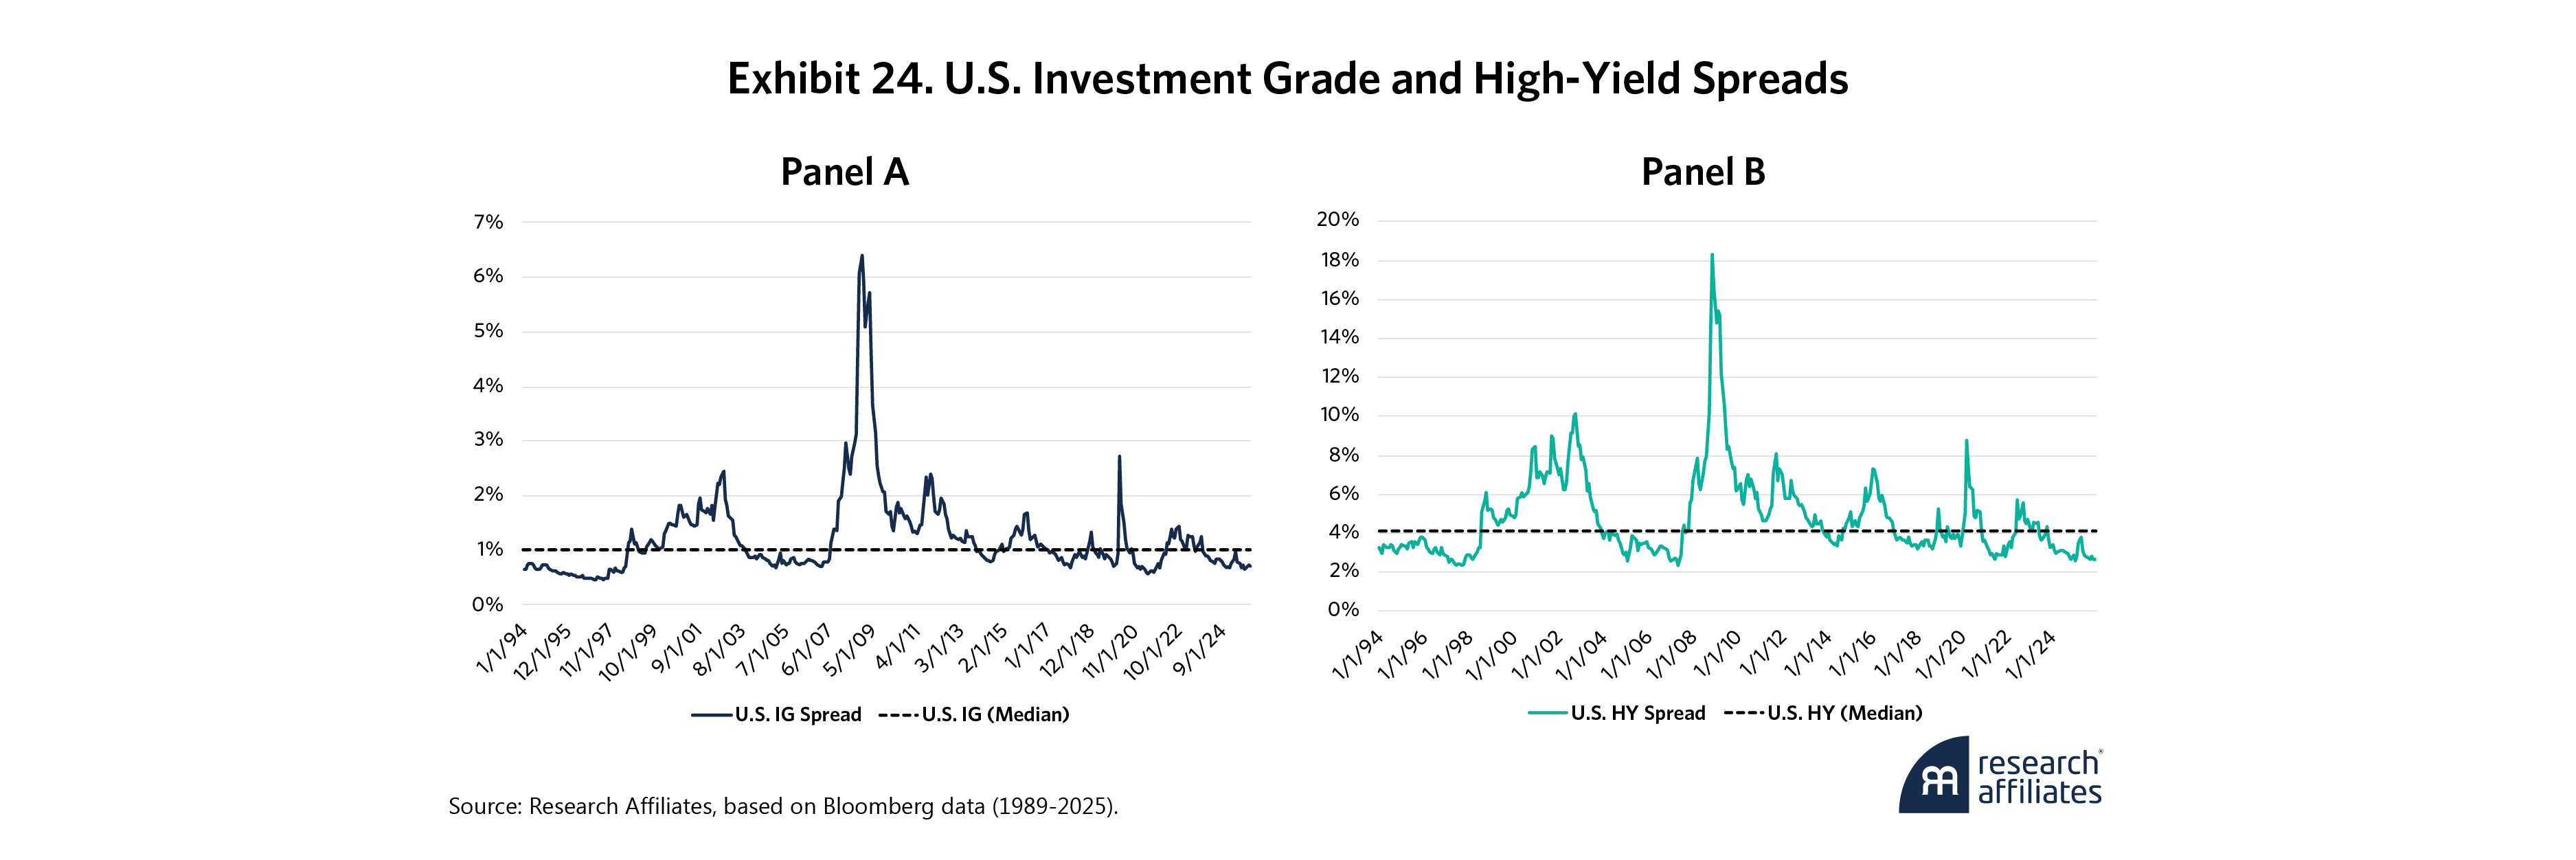
U.S. credit spreads stayed very tight this year, and U.S. high-yield spreads are now in the fifth percentile based on data dating back to 1994, as Exhibit 24, Panel B, shows. But spreads alone can be misleading since issuance has reverted to pre-pandemic levels and thus changed the supply-and-demand mix.
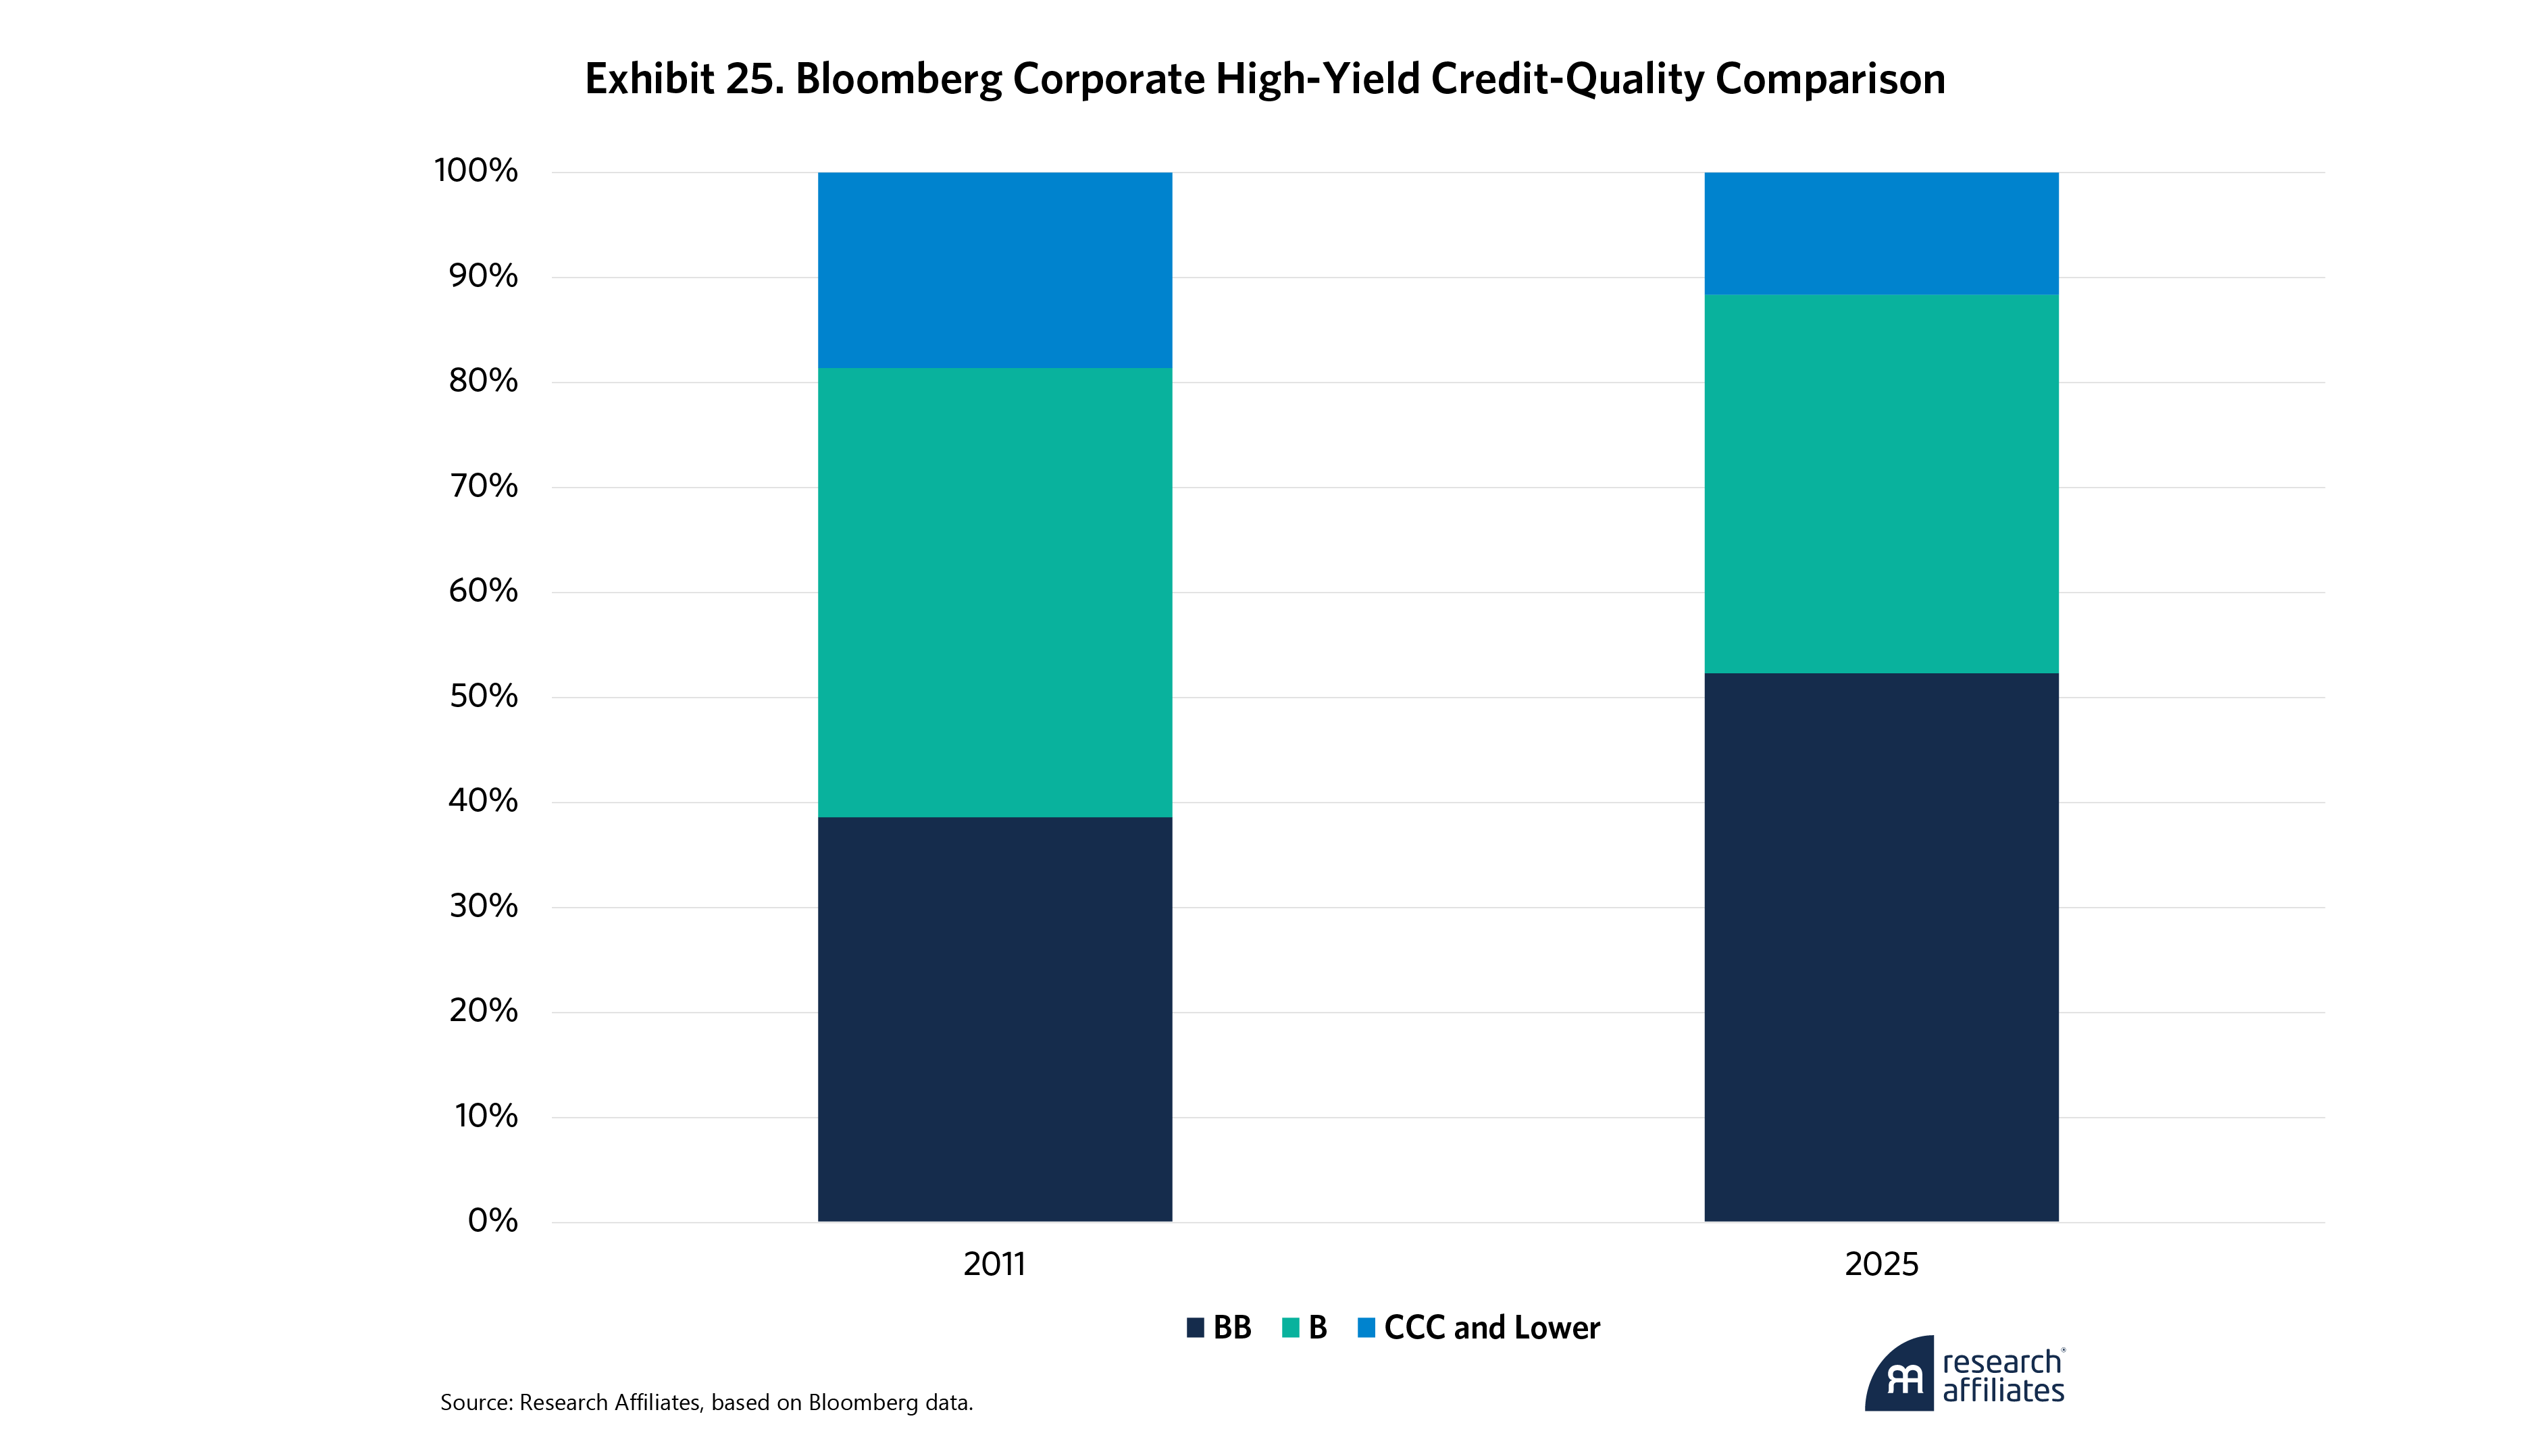
Rising high-yield credit quality is another factor driving tighter spreads, as lower-rated companies have shifted over time to private credit markets. Exhibit 25 shows 15% more of the Bloomberg High Yield Corporate Index is in BB-rated issues than in 2011, while CCC has fallen to just over 10% of the index from almost 20%. Lower expected credit risk has decreased the yield companies are required to pay by investors.
Emerging Market Local Currency Bonds
Emerging market local currency bonds are an interesting and often overlooked asset class. Why? Because many investors do not recognize that most emerging market sovereigns have improved credit ratings from the past. The S&P maintains largely investment-grade ratings on long-term local currency issues from Brazil (BB), China (A+), Indonesia (BBB), Malaysia (A), Mexico (BBB+), South Africa (BB), South Korea (AA), Poland (A), and Taiwan (AA), according to Bloomberg. This translates to a 5.9% index yield in emerging markets, on a duration of nearly six and a half years, which is cheap relative to similarly rated developed markets.
Emerging market policies are not what they once were. Several emerging market countries, such as Indonesia have implemented fiscal frameworks aimed at preserving debt sustainability, and the adoption of inflation-targeting regimes reduces the vulnerability of capital-flight crises. Demand for local bonds is also increasing from local investors such as pensions and sovereign wealth funds, helping these markets remain more resilient to global shocks.
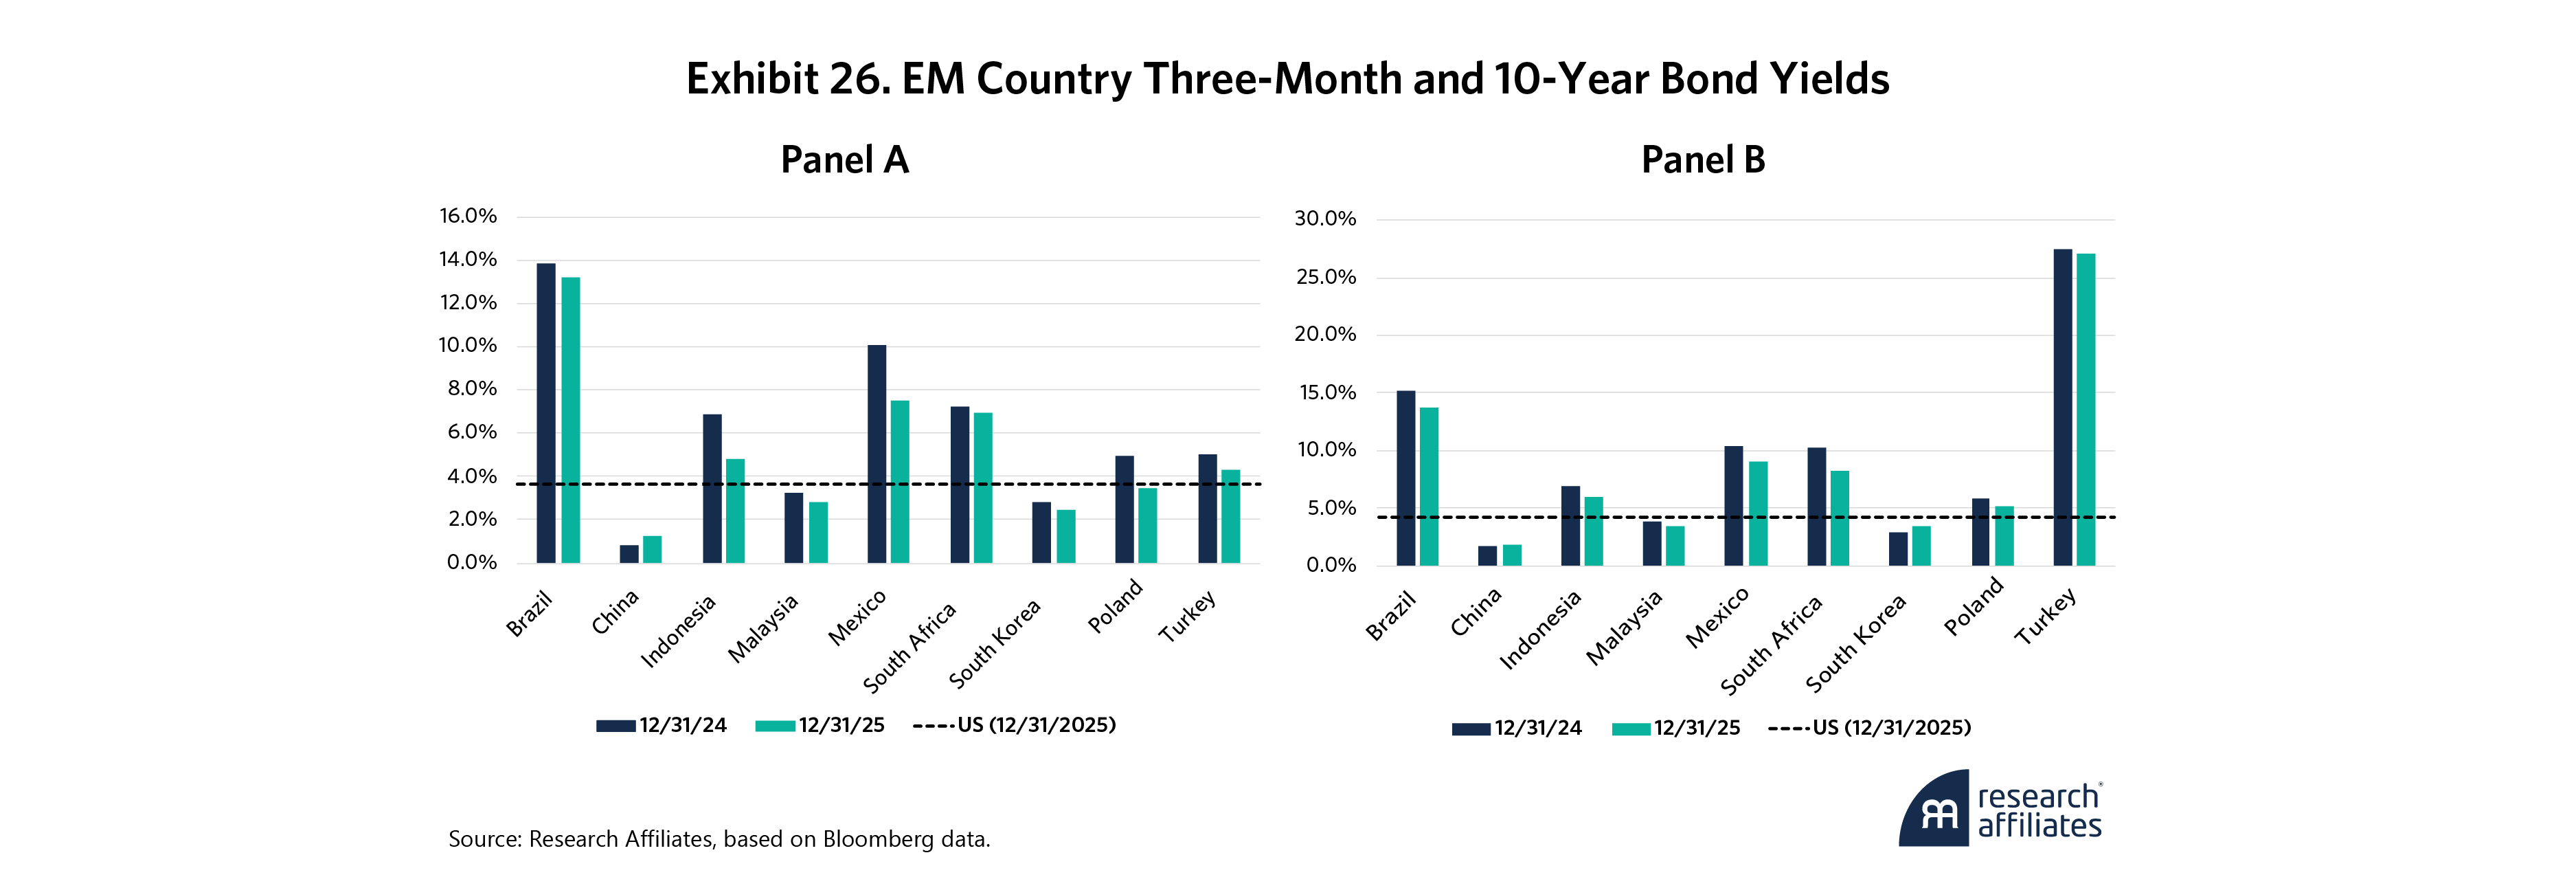
Exhibit 26, Panel A, shows a wide range of short-term rates, from China at 1.5% all the way up to Brazil at nearly 14%. Long-term rates, Panel B, exhibit a similar spread. For this reason, investors should build a diversified basket of emerging market local currency debt rather than prioritize any one country. Such a diversified basket can also mitigate exposure to currency fluctuations. EM bonds are primed to outperform in the “run-it-hot” environment but will face headwinds during risk-off episodes.
Inflation-Exposed Assets
TIPS
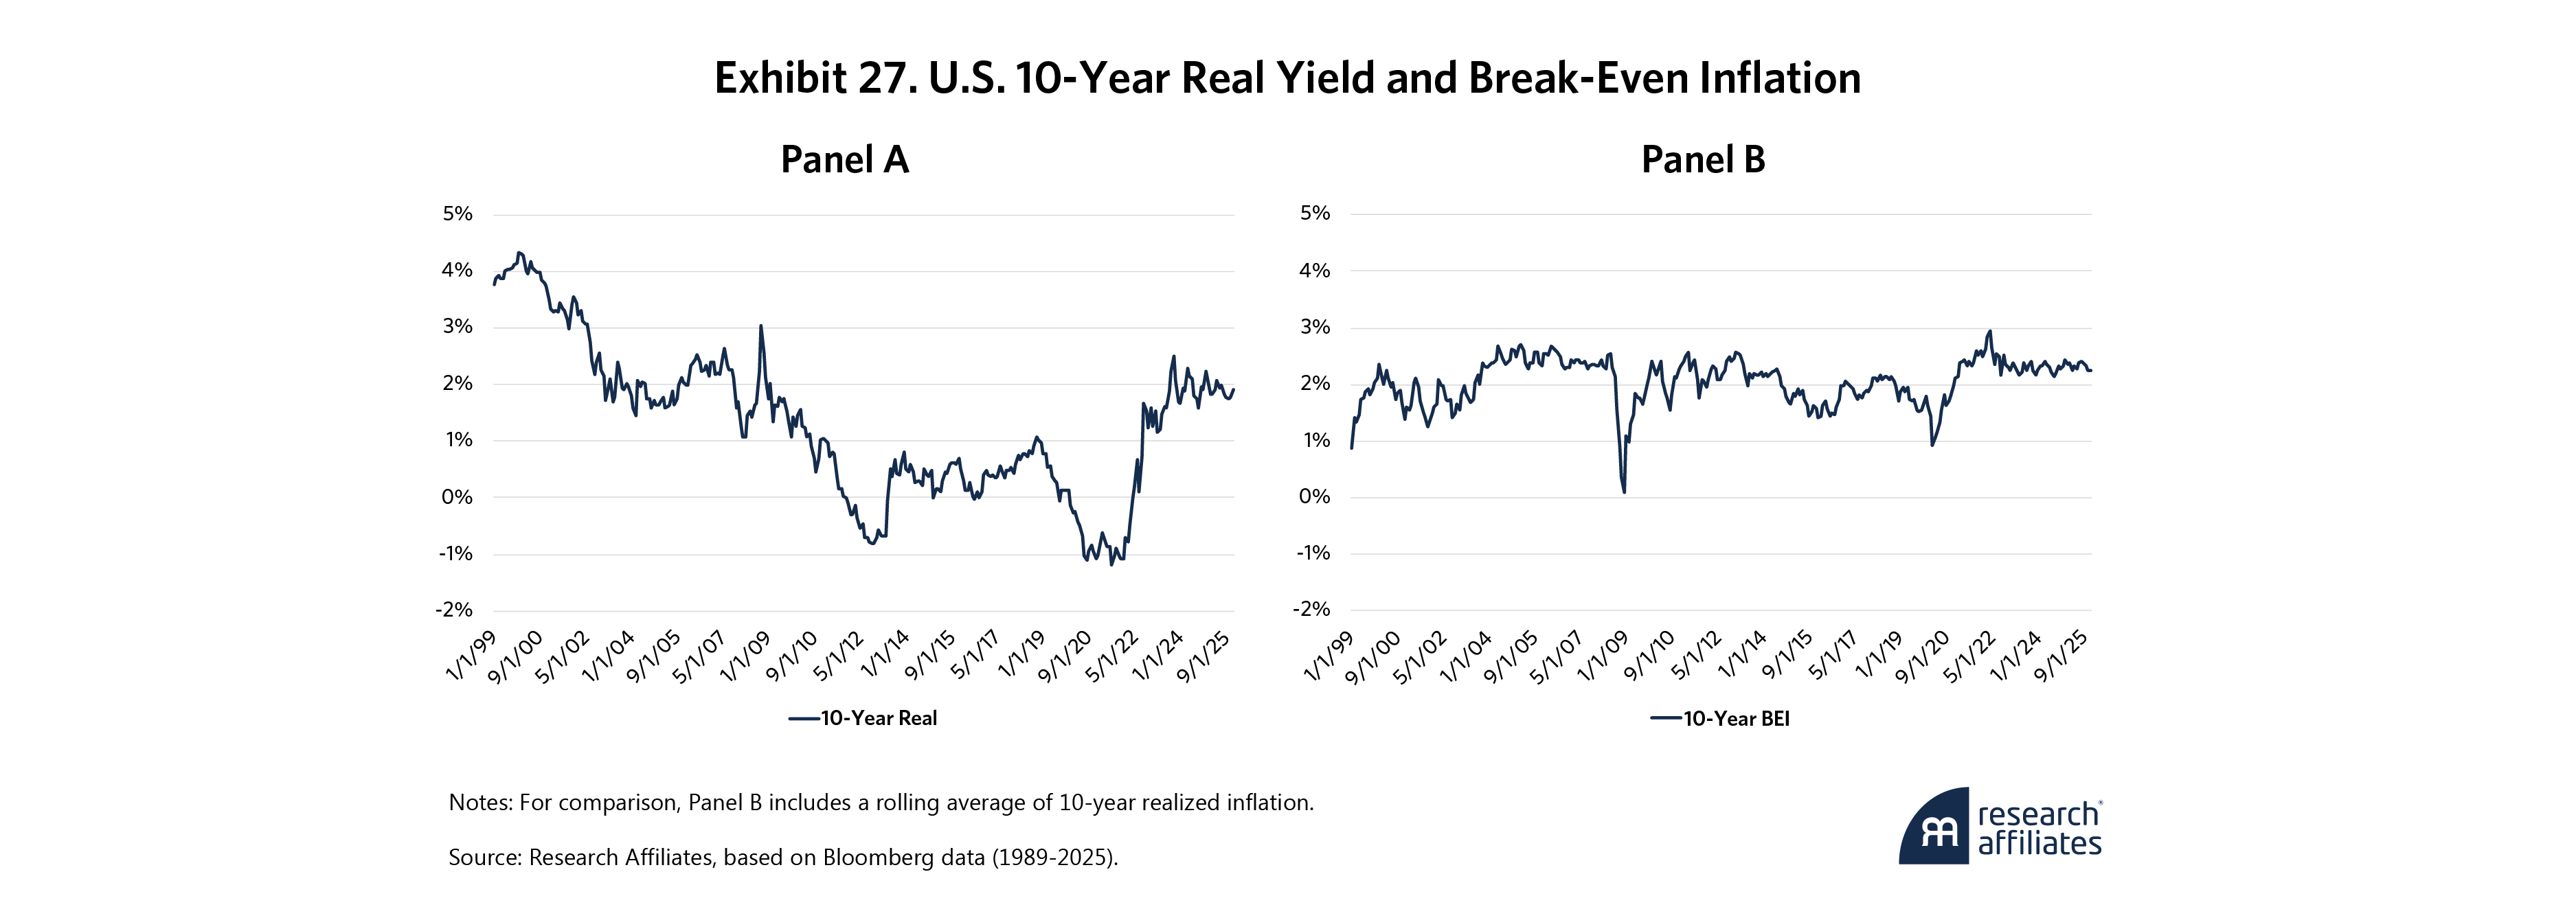
U.S. real interest rates, Exhibit 27, Panel A, echoed changes in nominal rates. As Exhibit 27, Panel B, shows, break-even inflation (BEI) remained stable throughout 2025. BEI, particularly short-term BEI, is positively correlated with energy prices, particularly oil. Oil has put downward pressure on BEI in 2025, offsetting upward inflationary forces. TIPS capital return comes from changes in break-even inflation (BEI) while income is driven by coupons from an inflation-adjusted principal.
The Goldilocks scenario for TIPS is falling rates, and higher inflation leading to both capital appreciation and interest payments. In this article we’ve already described why both of these seem not just plausible, but probable going forward.
Commodities
Commodities had a strong year as well. The total return on the Bloomberg Commodity Index (BCOM) was 15.8%, as Exhibit 28 shows. Since the BCOM is composed of commodity futures, this includes a strong 15.5% price appreciation in the spot commodities, along with the return on the invested collateral of 3.5% from short-term cash. The remaining return came from rolling down the associated curves which lowered total return by 3.2%.

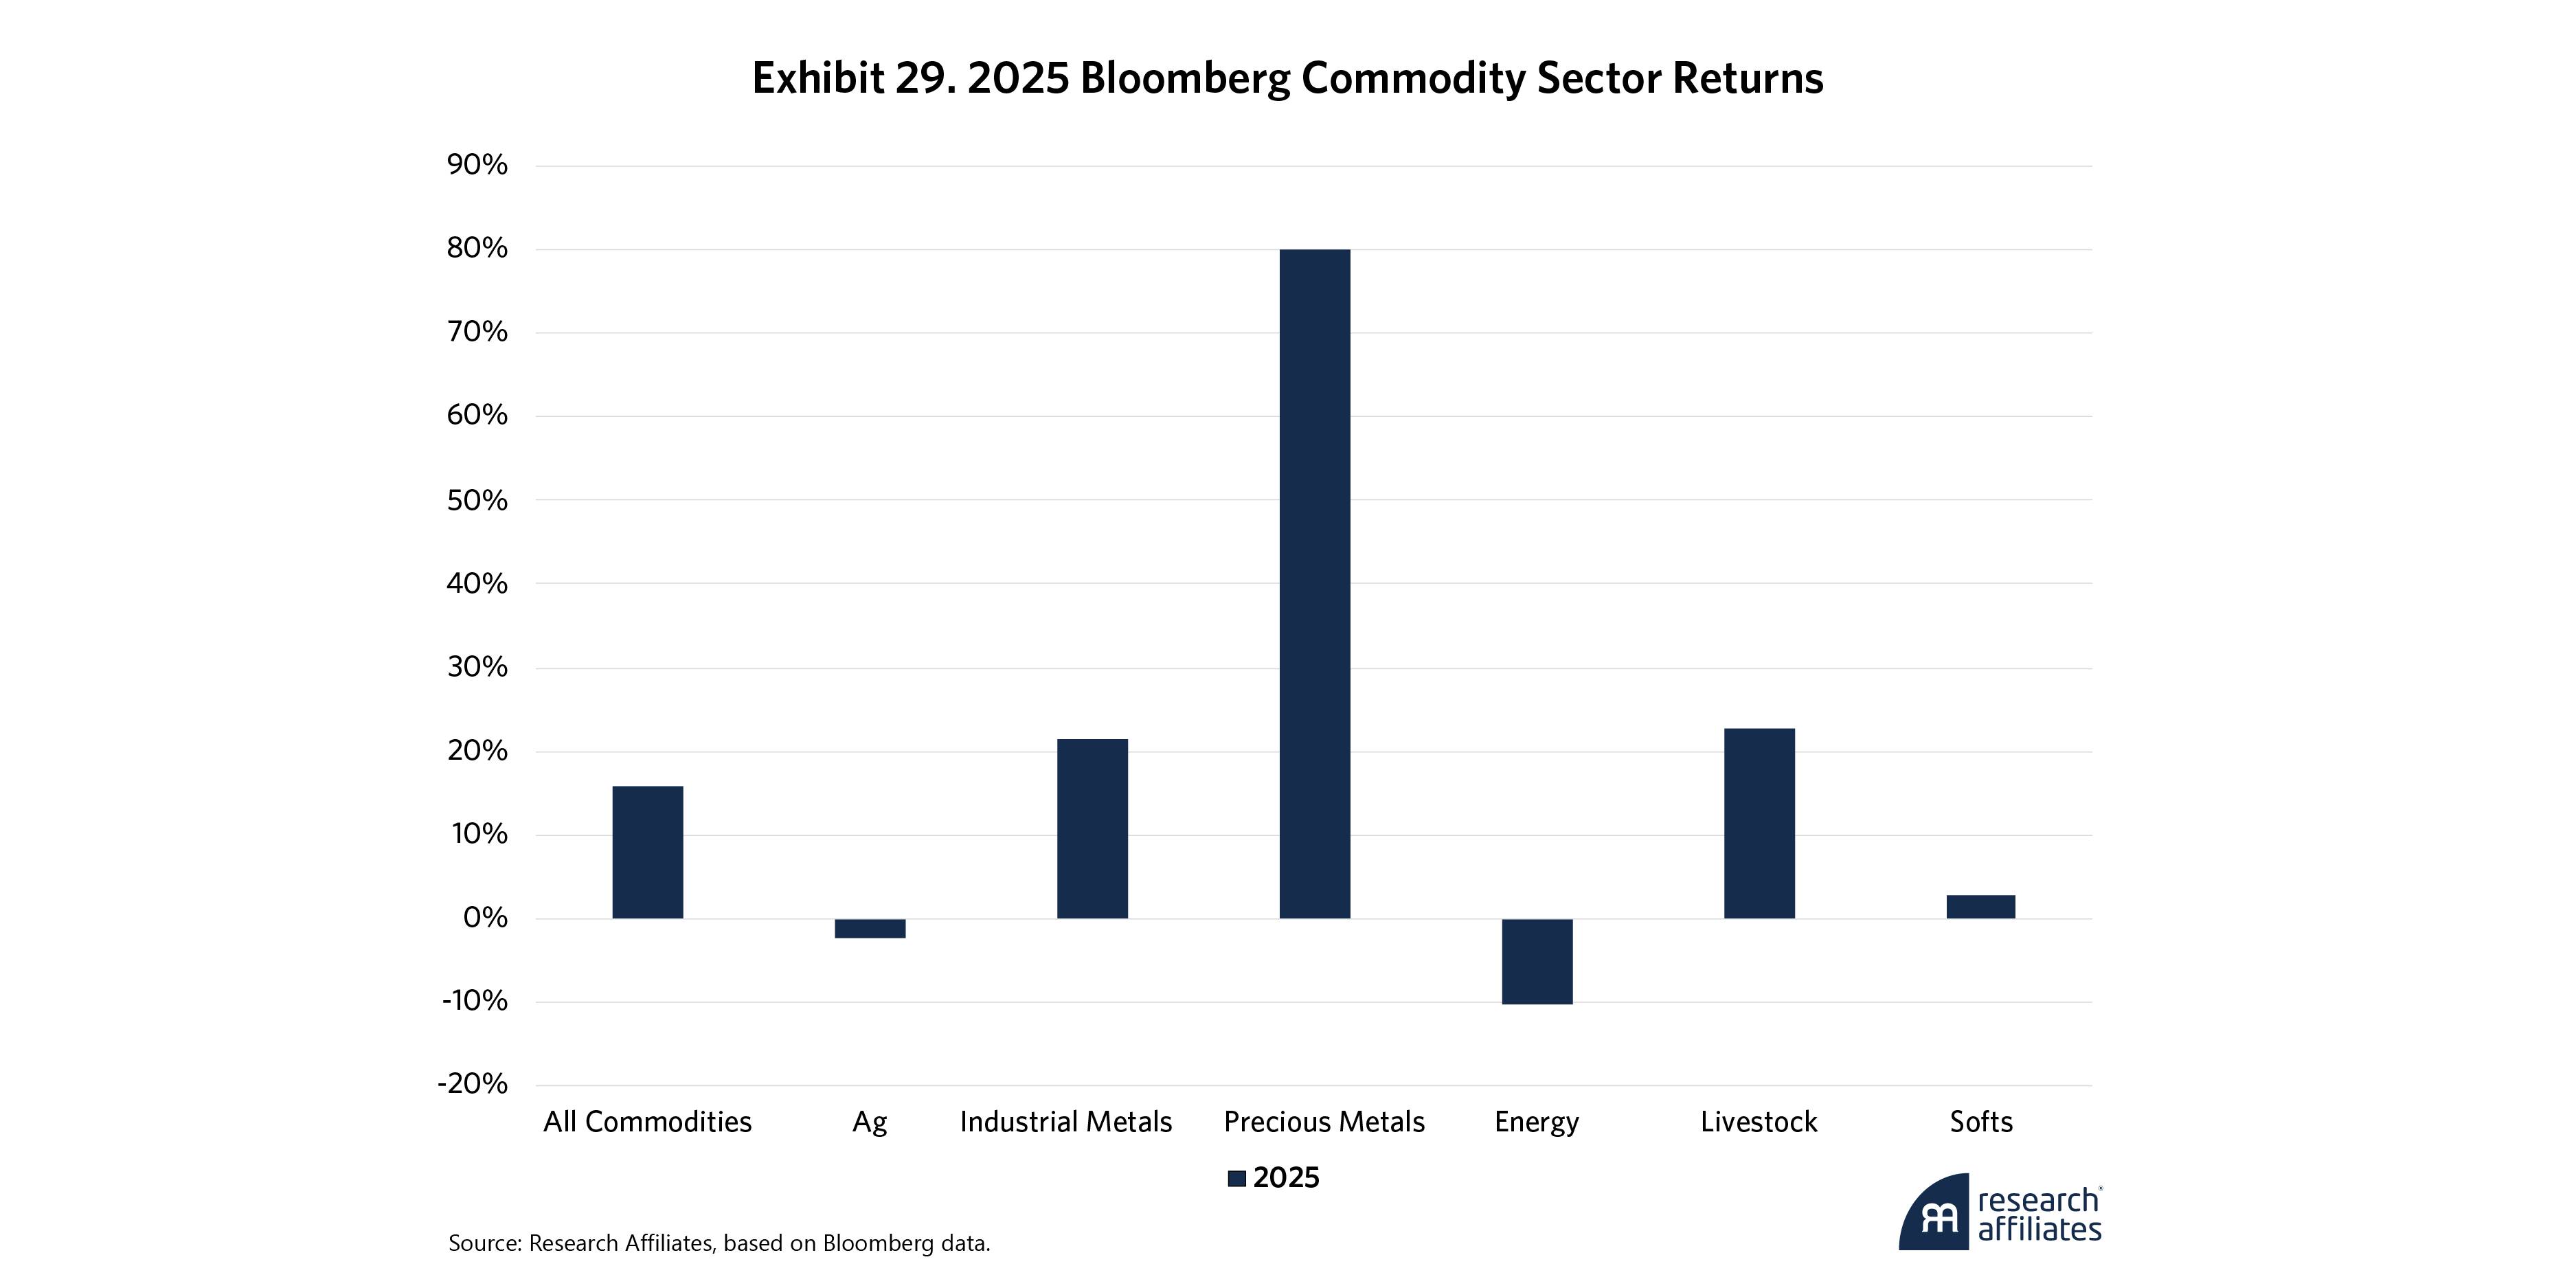
As Exhibit 29 shows, the top-level performance hides the fact that precious metals generated the vast majority of returns, with gold and silver comprising about 18% of the index. Industrial metals, 15% of the index, were also strong on the year, and while livestock returns were robust, live cattle and lean hogs account for only 5% of the index. At 30%, energy is the largest sector. Given the weakness in oil and other energy futures, BCOM’s performance is somewhat surprising.
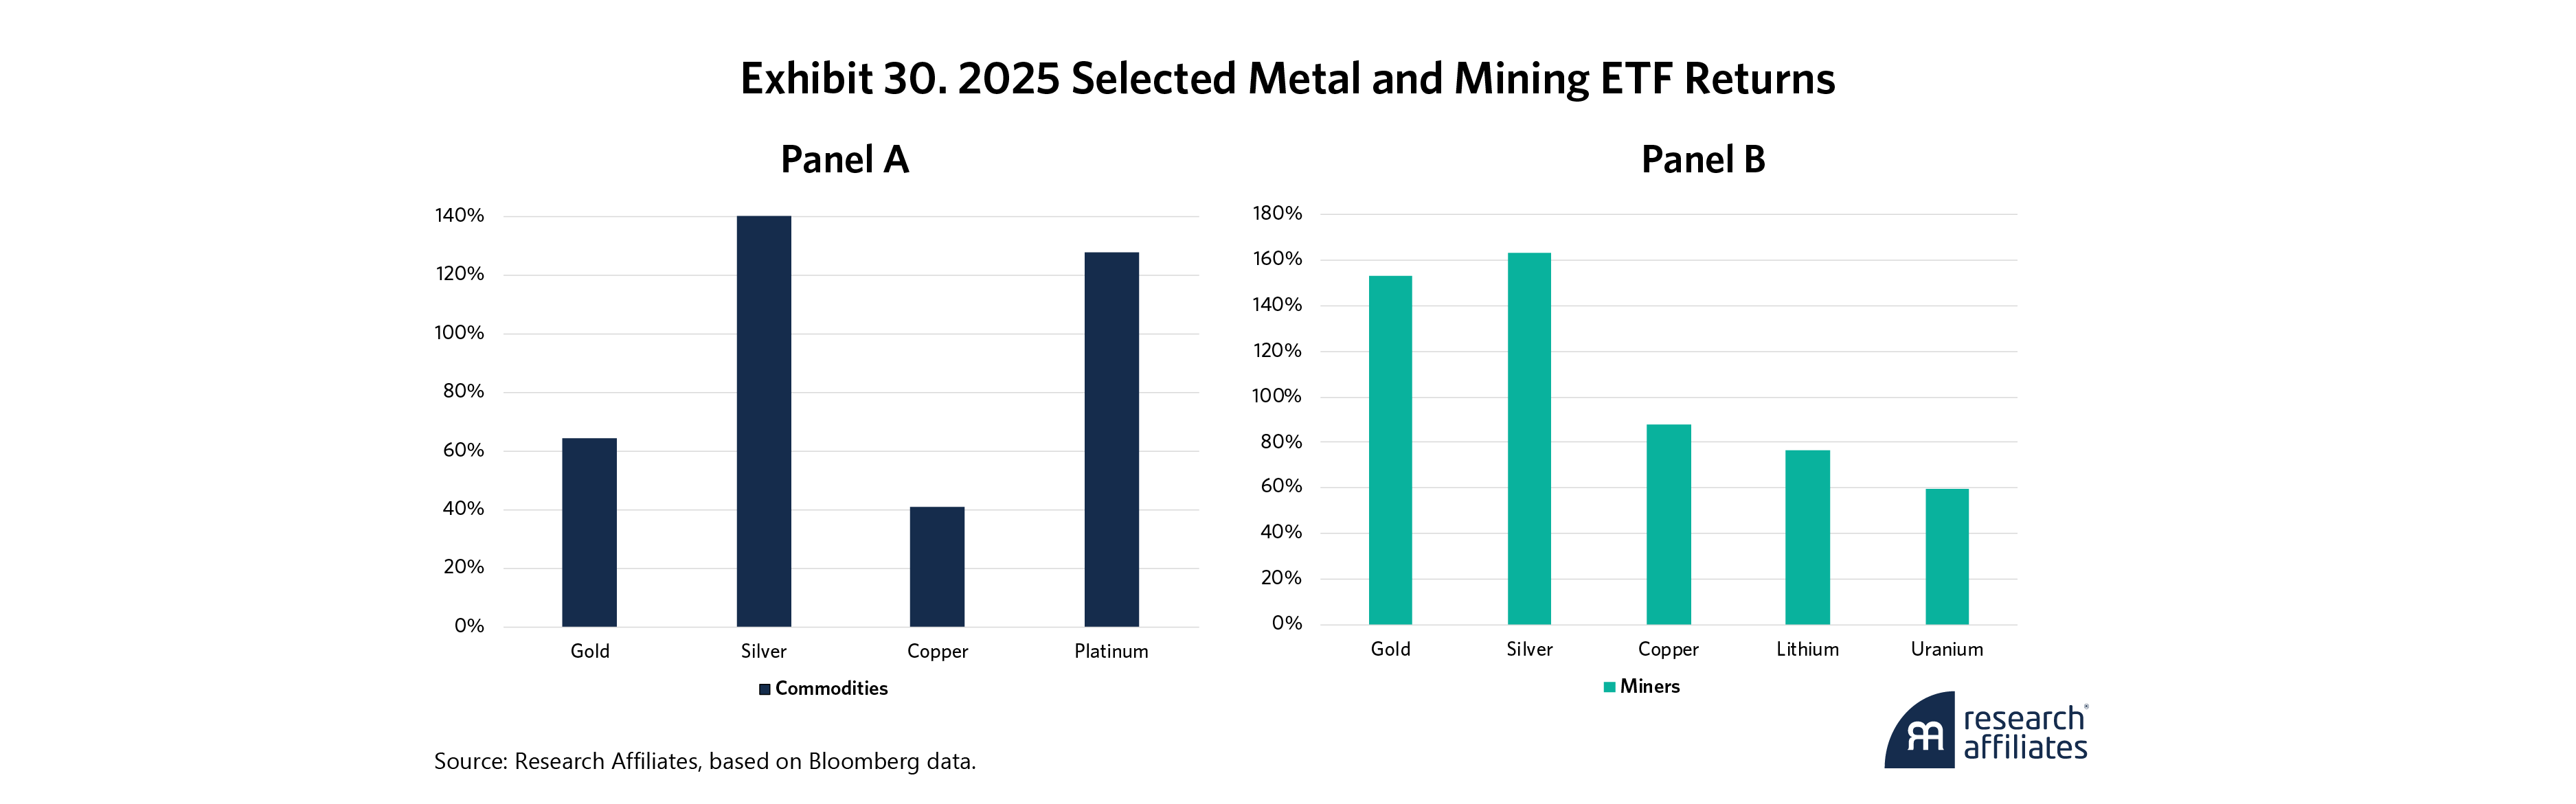
While gold and, to a lesser extent, silver received a lot of attention, platinum outperformed both before a late year silver surge. As Exhibit 30, Panel A, shows, while not a precious metal, copper also had a great 2025 given the uptick in global demand.
For investors seeking metals exposure outside the futures markets, commodity funds and equities are worth considering. Exhibit 30, Panel B, shows how mining ETFs enjoyed a double tailwind year amid high equity market and robust metals performance. This also indicates these funds can diverge from the underlying metals when equities have significant up or down years.
Mining stocks are a good way to access lithium and uranium, among other less-investable metals. Both lithium and uranium performed well thanks to increased demand and speculation. Uranium had a renaissance of sorts as many anticipate nuclear energy may help feed the AI beast’s insatiable appetite for electricity.
Real Estate Investment Trusts (REITs)
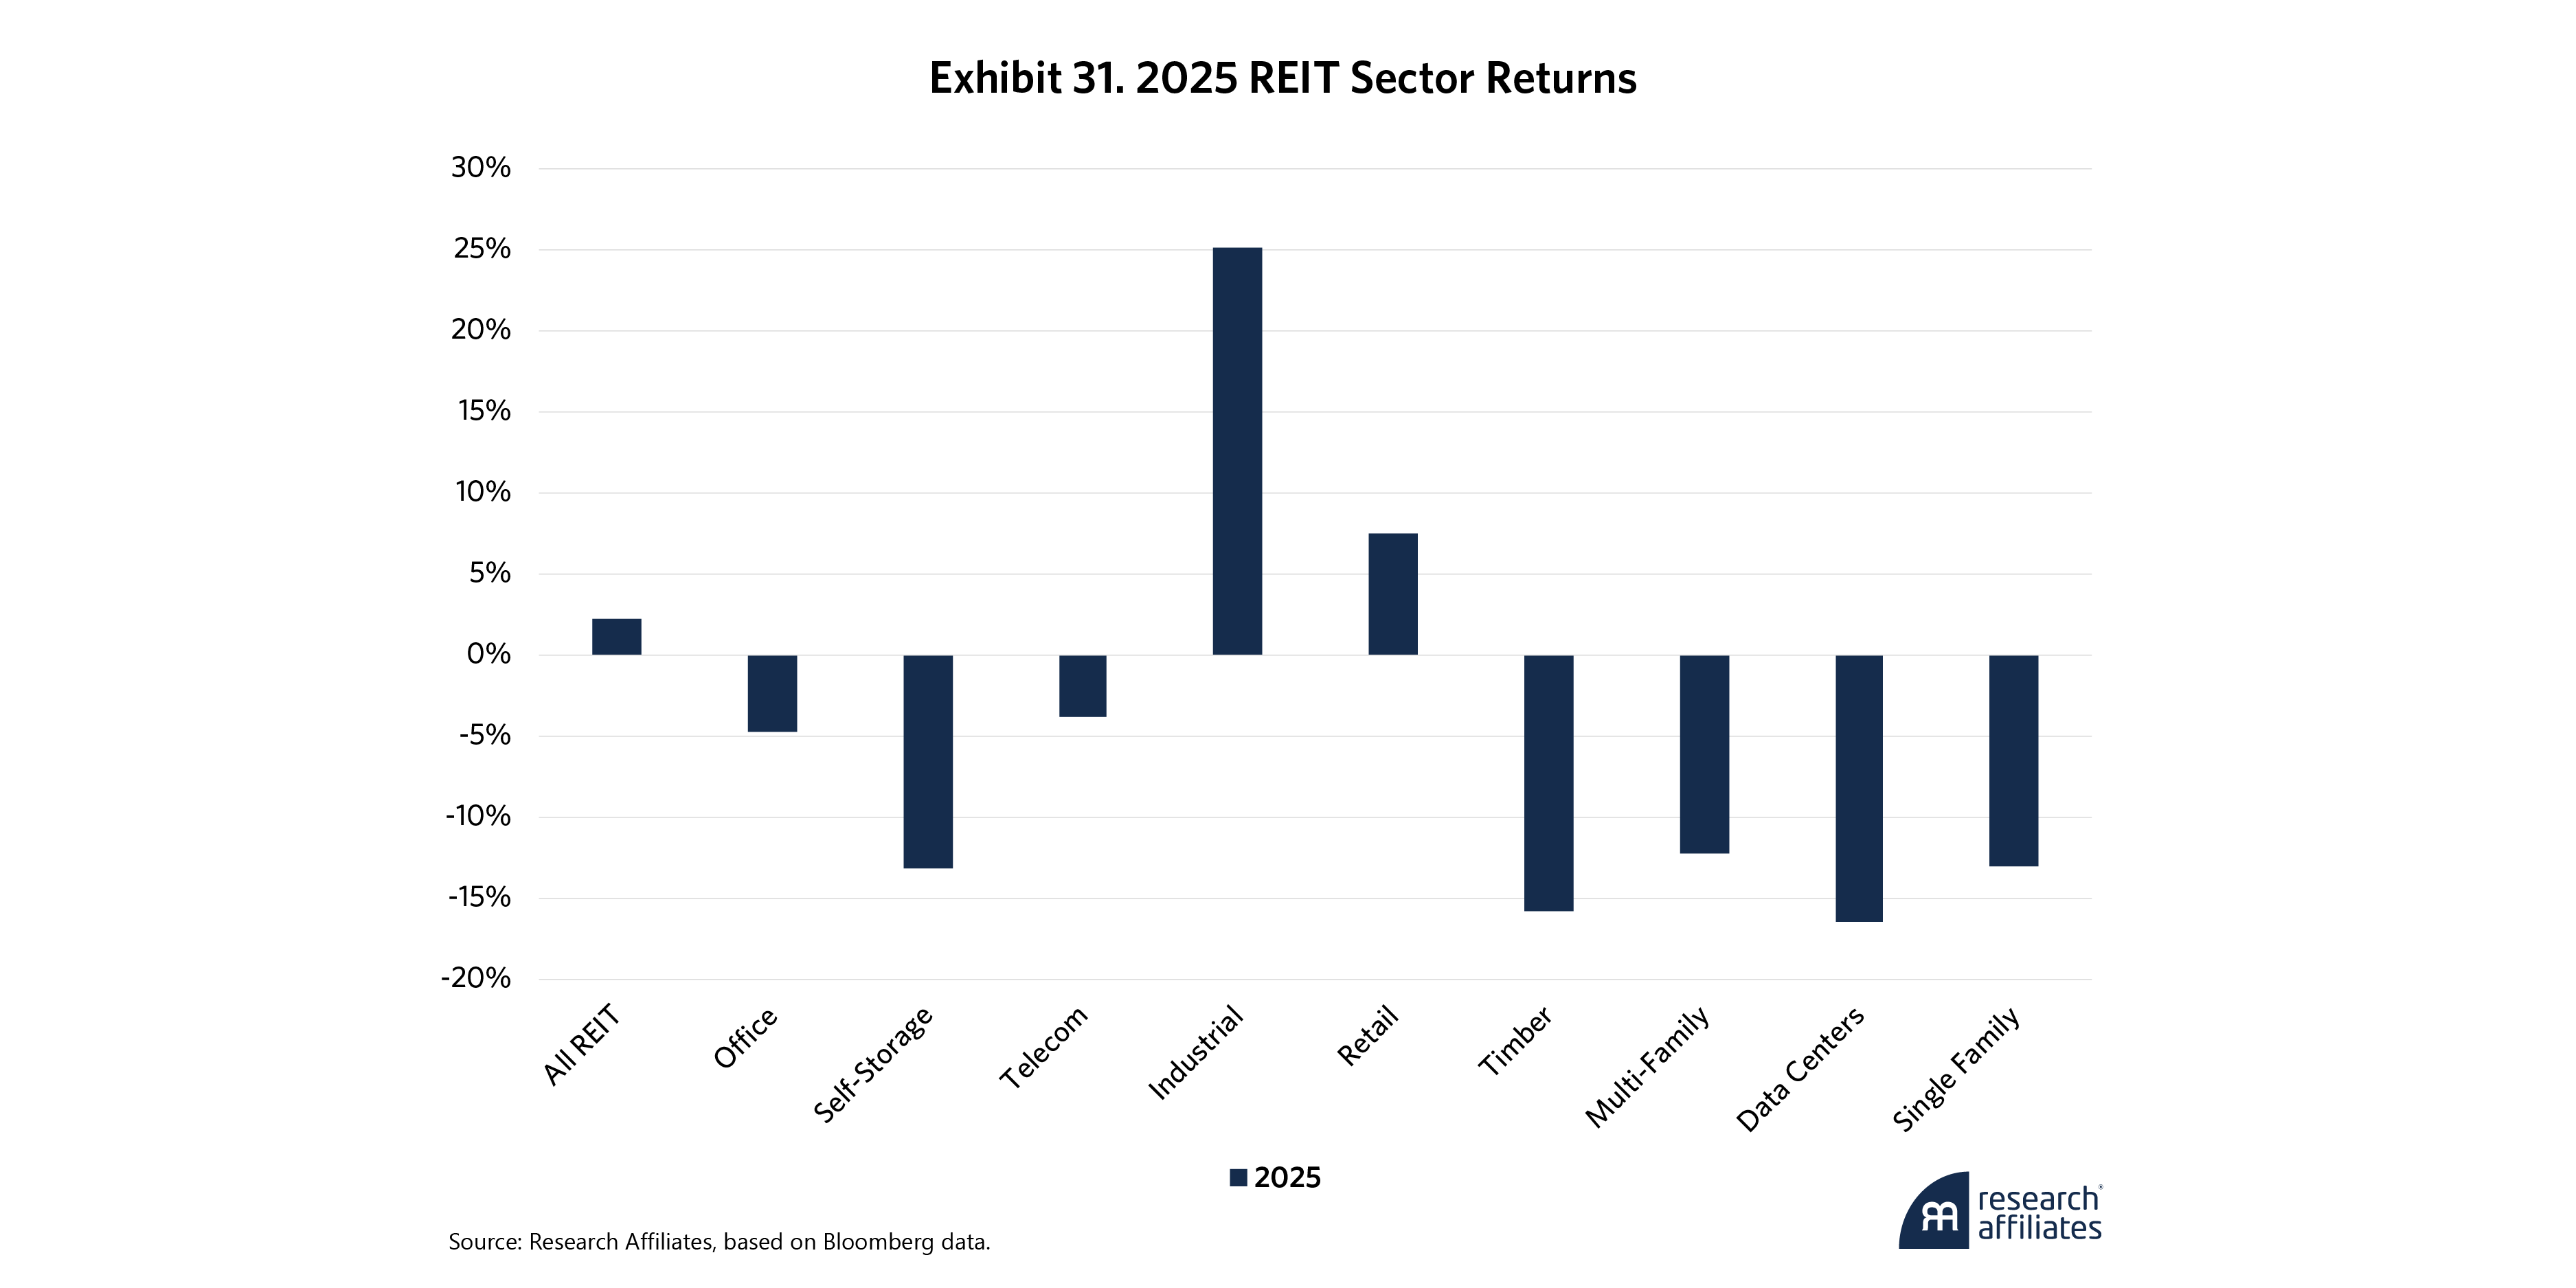
Has any asset class been more disparaged than commercial real estate over the last decade? With the “retail apocalypse” and the work-from-home phenomenon, the sector has seen better days, with such relative newcomers as data centers and telecom among its only bright spots in recent years. However, Exhibit 31 shows those darlings, with their richer valuations, exhibited a pullback in 2025 while industrial and left-for-dead retail rebounded.
Lower interest rates and tax benefits from investment as detailed in the OBBB provide tailwinds for the sector going forward. Similarly, AI is driving incredible amounts of investment into certain sectors. While not all of these investments will prove profitable, the engine of growth remains strong.
Longer-Term Outlook: Capital Market Expectations for the Next Decade
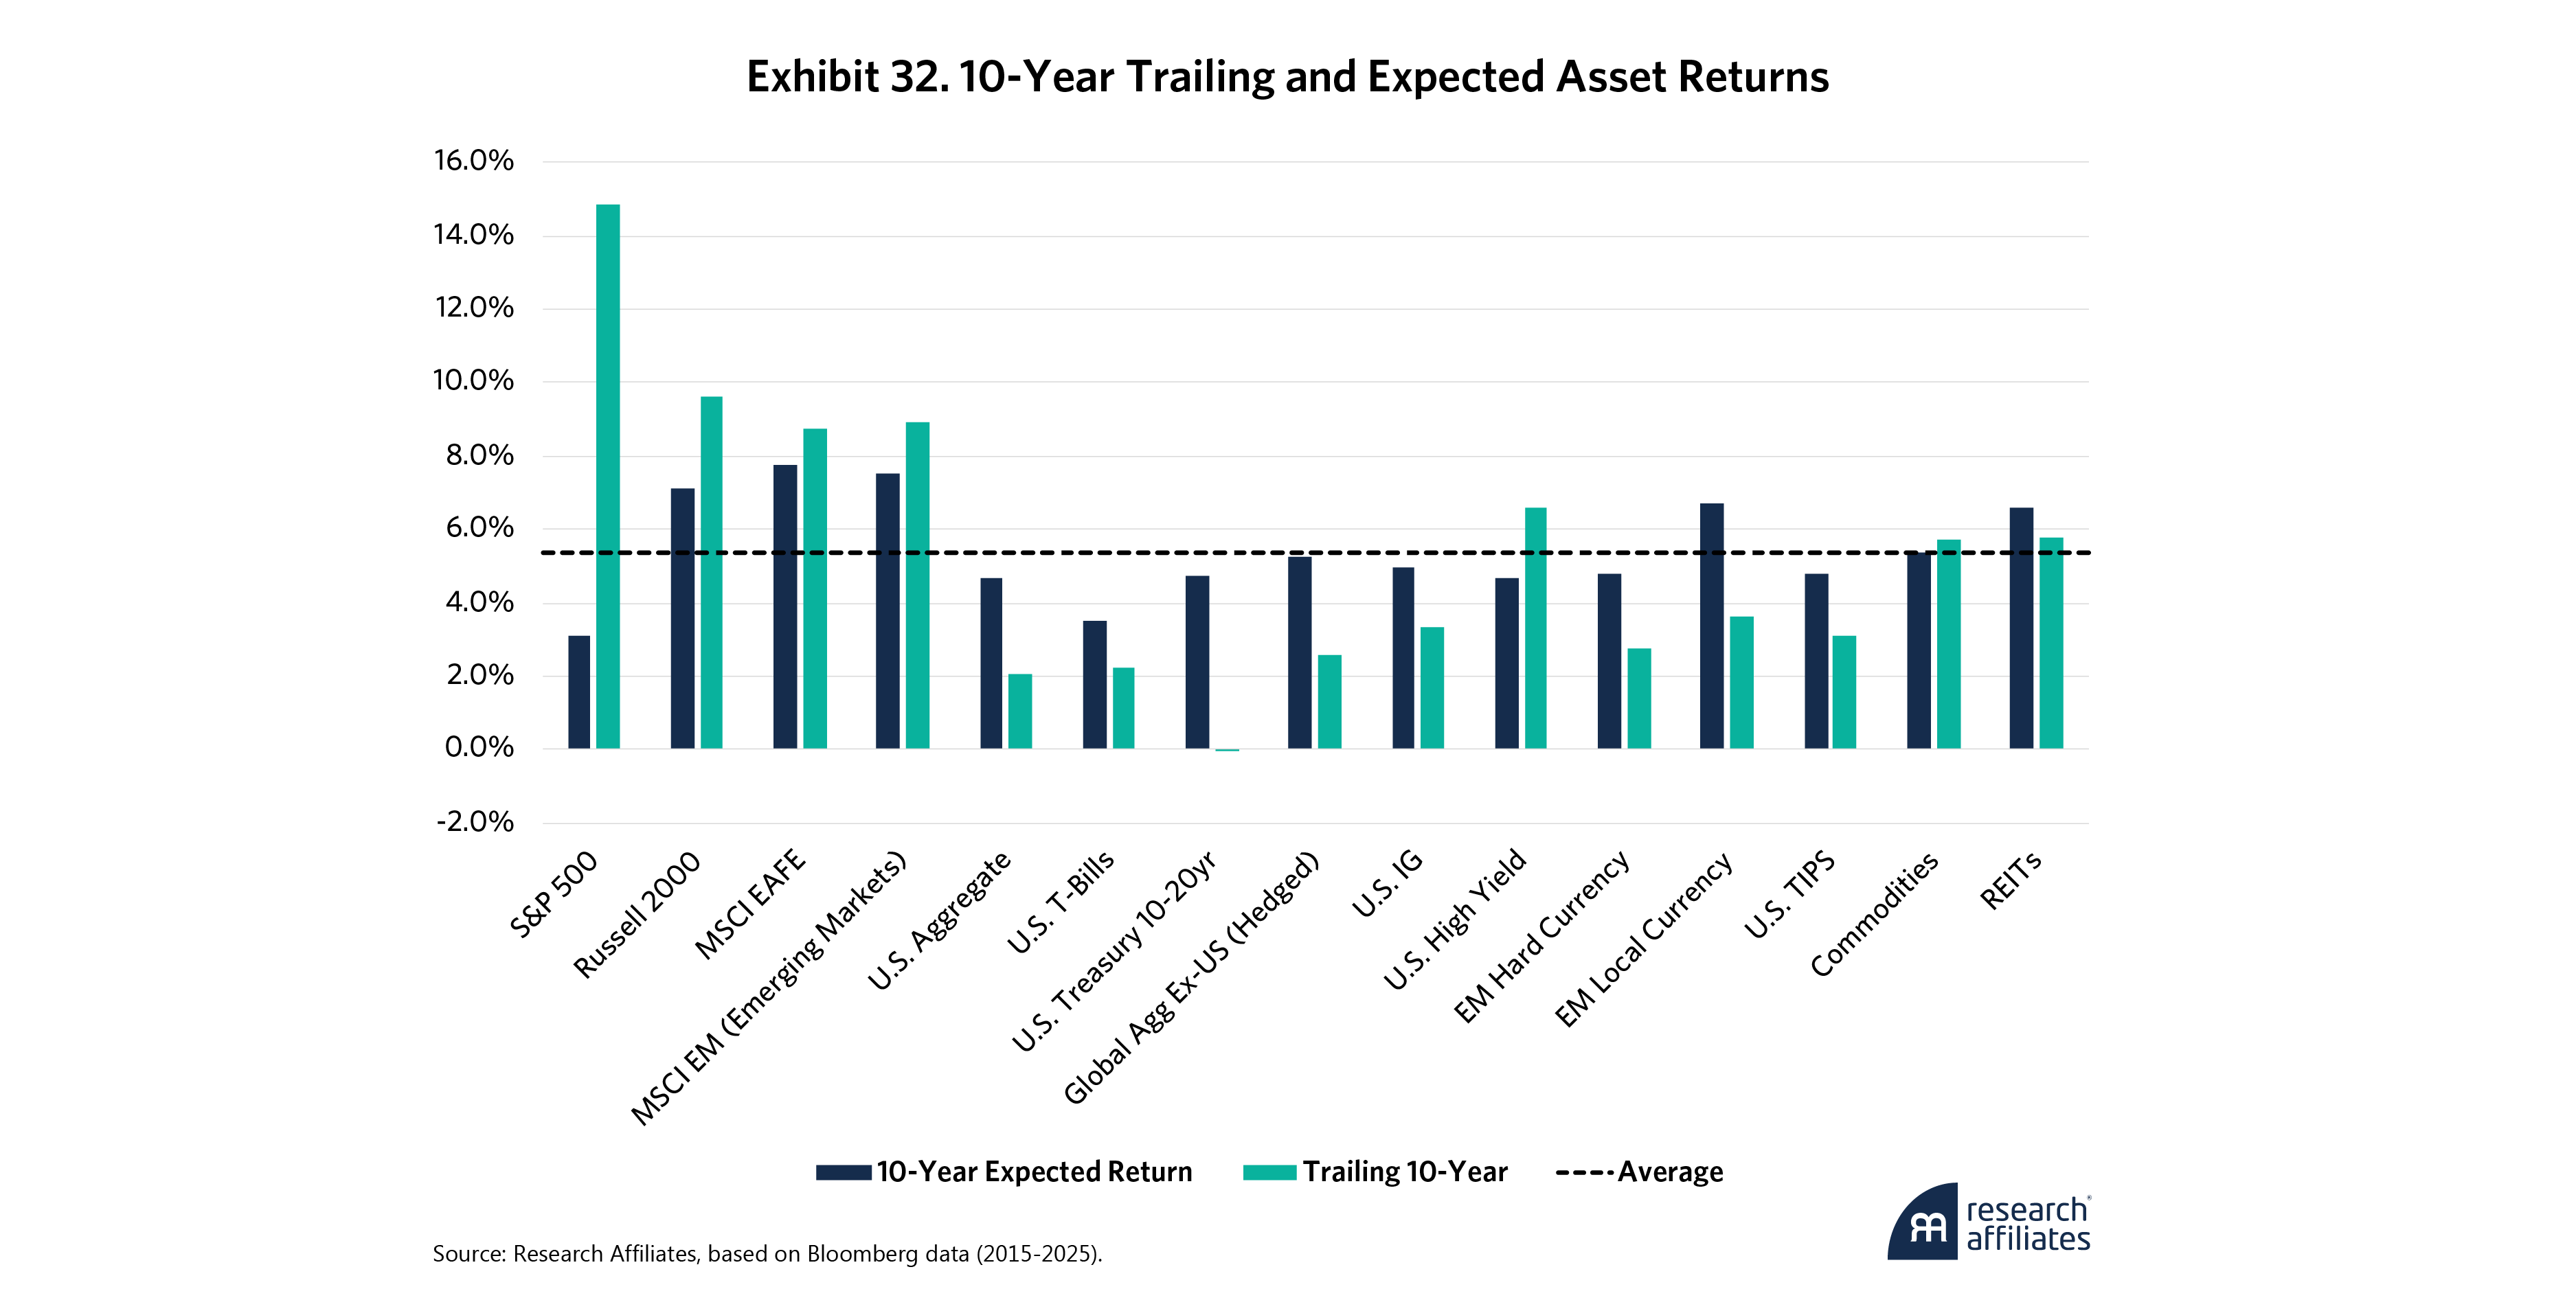
Having looked back at 2025 and slightly forward into 2026, we now turn to the long-term future. What do expected returns indicate for assets over the next decade? While there is much we don’t know about what is to come, the relationship between starting valuations and future returns is a reliable measure of expected returns for each asset class.2 These estimates are freely available on our Asset Allocation Interactive (AAI) tool.
Exhibit 32 shows the high-flying S&P 500, with its expensive multiples, is priced for perfection. That has historically led to poor future returns. By contrast, small caps, non-U.S. stocks, EM local bonds, commodities and REITs are generally priced for continued appreciation.
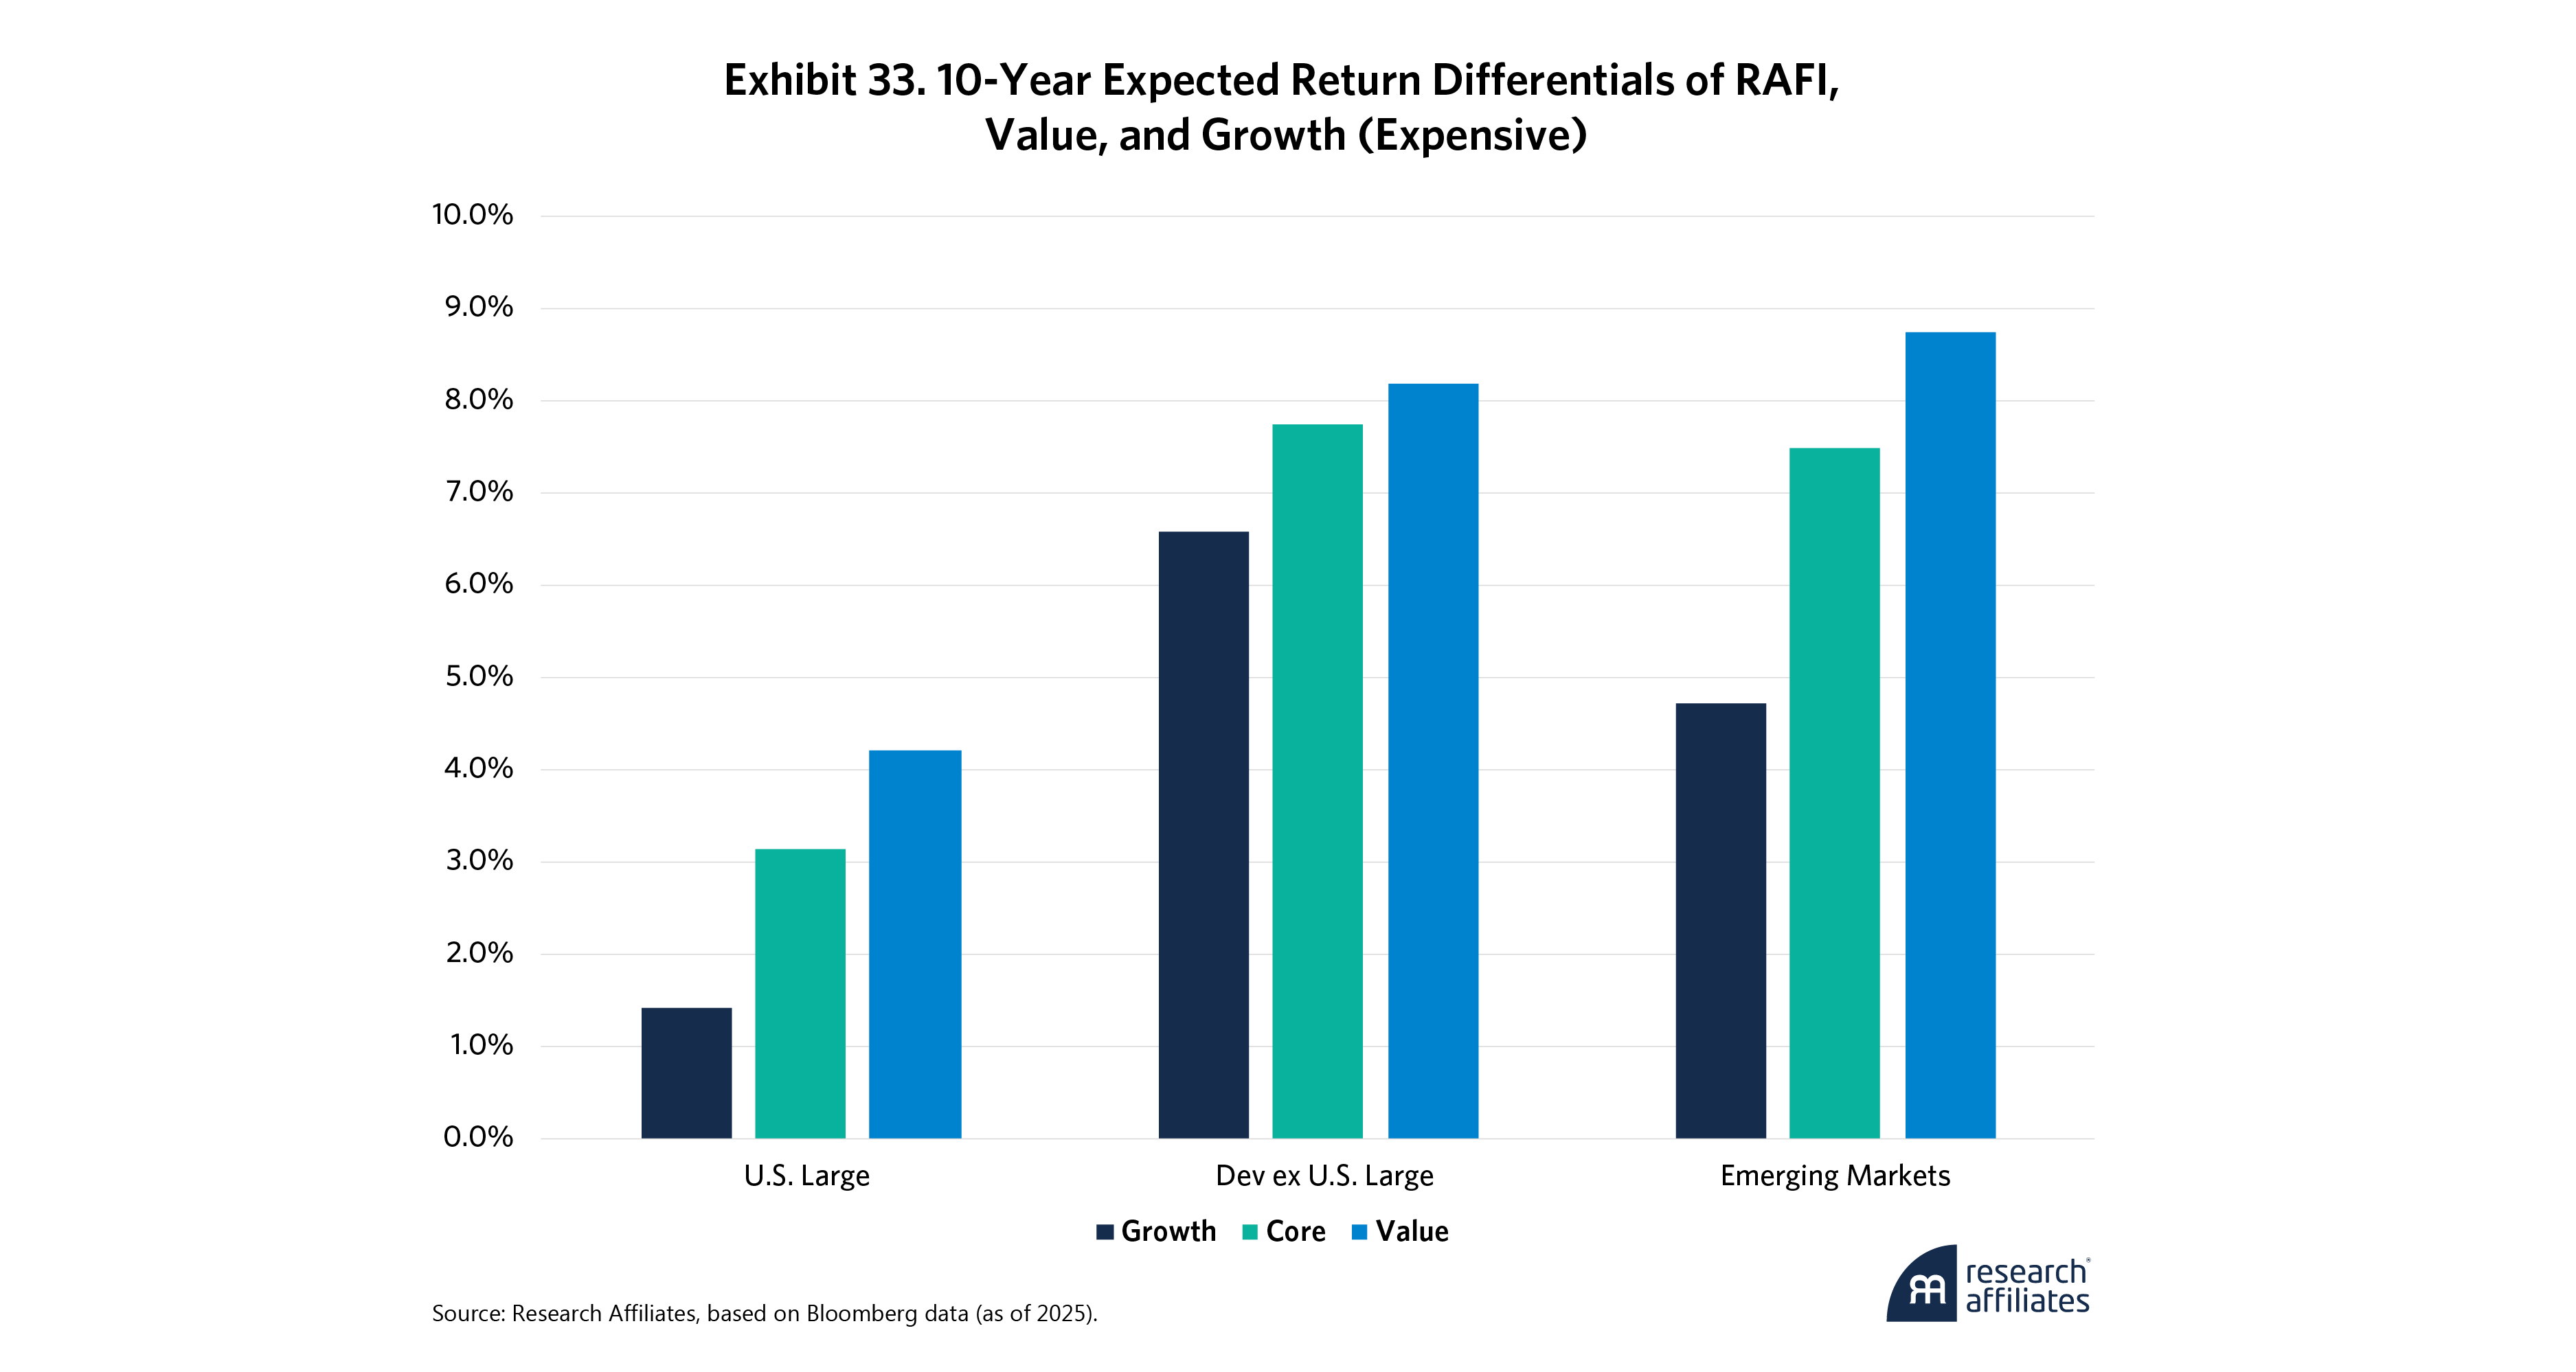
As Exhibit 33 shows, we expect growth stocks will underperform value stocks in all regions and drag down global equities. Here, growth is meant to imply the opposite of value, or more correctly described as expensive. However, as we’ve been detailing in our recent writings, this definition is a misnomer, growth stocks should focus on company growth, not the inverse of cheap fundamentals.
This exhibit shows that although momentum can be a fabulous short-term source of return, it often leads to companies whose prices grow faster than underlying fundamentals. This means the companies are then more expensive relative to their fundamentals as their multiples expand. Multiple expansion can’t continue indefinitely, meaning that over long horizons, it’s best to assume some amount of mean reversion will take hold.
Conclusion
As the clock struck midnight on the year, we can see that 2025 represented not an end but an inflection point. The era of ultra-low rates, central bank liquidity, and subdued inflation is giving way to a new global economy marked by higher nominal growth, persistent inflationary pressure, and the reassertion of fiscal reality. The past 12 months showed that while U.S. equities continued to shine, commodities shined even brighter as gold reached all-time highs.
As the clock struck midnight on the year, we can see that 2025 represented not an end but an inflection point. The era of ultra-low rates, central bank liquidity, and subdued inflation is giving way to a new global economy.
”Yet beneath the impressive nominal returns is a growing awareness of fragility. Rising fiscal deficits, an aging workforce, and mounting debt-servicing costs are now integral features of the macro landscape. The Fed must walk a fine line to manage its dual mandate, both sides of which are blinking yellow, if not red. The Fed’s embrace of a labor-first “run-it-hot” policy suggests that inflation and volatility will be an enduring companion to investors. In this environment, diversification across asset classes, geographies, and inflation-sensitive exposures may be more critical than in the last decade.
As growth and AI-driven sectors in the U.S. became an even bigger story in 2025, investment opportunities were migrating abroad, to non-U.S. equities, emerging market bonds, and alternative strategies that harness rather than avoid volatility. As capital reprices to reflect higher discount rates and more modest growth assumptions, disciplined investors that focus on fundamentals rather than narratives are likely to be rewarded.
As growth and AI-driven sectors in the U.S. became an even bigger story in 2025, investment opportunities were migrating abroad, to non-U.S. equities, emerging market bonds.
”In 2026 and beyond, investors will have a more dynamic and fragmented world to navigate. Complacency is not an option. Those who embrace a globally diversified, forward-looking, valuation-based approach may be better positioned to thrive in what promises to be another market-defining decade.
Please read our disclosures concurrent with this publication: https://www.researchaffiliates.com/legal/disclosures#investment-adviser-disclosure-and-disclaimers.

End Notes
1. At a market cap of only 2 trillion (https://coinmarketcap.com/currencies/bitcoin/), bitcoin doesn’t yet qualify as “major,” and got smaller during the year as Bitcoin fell -6.5% in 2025. I do not address private markets, both equity and credit, in this article due to the lack of quality comparable public data and because others know them better.
2. For details on the models that determine these expected returns, see our methodology document in the Asset Allocation Interactive (AAI) tool.
References
Bensinger, Greg. “Exclusive: Amazon Targets as Many as 30,000 Corporate Job Cuts, Sources Say.” Reuters, October 27, 2025.
Capoot, Ashley, and Jonathan Vanian. “Meta Lays Off 600 from ‘Bloated’ AI Unit as Wang Cements Leadership.” CNBC, October 22, 2025.
DiPalma, Brooke. “UPS Stock Rallies after Company Discloses 48,000 Layoffs in Multibillion-Dollar Savings Push.” Yahoo!Finance, October 29, 2025.
El Wardany, Salma, Fiona MacDonald, Grant Smith, and Nayla Razzouk. “OPEC+ to Pursue Output Hikes Next Year as Market Set for Glut.” Bloomberg, November 2, 2025.
Graf, Rachel, and Dorothy Ma. “The Ranks of Corporate Zombies Are Growing: Credit Weekly.” Bloomberg, November 1, 2025.
Masturzo, Jim. “As Duration Dies, Equities Rise.” Research Affiliates, March 2021.
Masturzo, Jim. “The Buck Stops Here.” Research Affiliates, January 2023.
Noonan, Keith. “‘When You See One Cockroach, There’s Probably More.’ Is JPMorgan Chase's Recent Hit a Warning to Other Major Banks?” The Motley Fool via Yahoo!Finance, October 14, 2025.
Nostrant, Rachel. “Houston’s Conoco Phillips to Lay Off Up to 25% of Global Workforce.” Houston Chronicle, September 3, 2025.
Research Affiliates. “Capital Markets Insights: Reconsidering Eastern European Investments.” LinkedIn, July 17, 2024.
Roberti, Rafael, James Greene, and Jessica Zhou. “High Yield Market Bounces Back, but Maturity Wall Looms.” White & Case Debt Explorer, March 10, 2025.
Vaziri, Aidin. “Intel to Cut 107 Silicon Valley Jobs and Shut Automotive Unit as Global Layoffs Begin.” San Francisco Chronicle, June 25, 2025.
Waller, Christopher J. “Demystifying the Federal Reserve’s Balance Sheet.” Lecture. At the Federal Reserve Bank of Dallas, Dallas, TX, July 10, 2025.
