
Why Hold Expensive Slow-Growing Stocks? An Alternative Framework for Value and Growth Indices
Because traditional style indices are based on the completeness principle, with all stocks defined as growth, value, or both, funds based on these indices hold stocks that are neither growth nor value.
As a result, investors in style funds can be forced to hold expensive slow-growing stocks that have historically underperformed.
We propose studier framework that forms value portfolios based solely on cheap stock prices and growth portfolios based solely on fast-growing companies, seeking to eliminate the underperforming expensive slow-growing stocks.
This framework allows for a simple, practical implementation by forming portfolios that combine the market’s cheapest stocks with its fastest-growing stocks.
Our analysis shows that portfolio concentration and style timing can provide a further boost to performance.
For decades, investors have bought value and growth funds that track their respective style indices. By design, index providers construct these style indices by partitioning the full market, and the resulting value and growth indices hold stocks that are neither value nor growth. This approach to index construction often requires investors in style funds to own expensive stocks of slow-growing companies that have historically underperformed.
Create your free account or log in to keep reading.
Register or Log in
To remedy this problem, we propose an alternative framework that removes the expensive slow-growth stocks. Using this new blueprint, we build value and growth portfolios designed to outperform the market when combined. In addition, forming more concentrated portfolios and using style timing can deliver even better performance.
What’s Inside Your Style Index Fund?
Today’s style-based index funds track benchmark indices built with the “completeness principle,” according to which all stocks are categorized as value, growth, or some combination of both. But that’s just not true; some stocks are neither.
Today’s style-based index funds track benchmark indices built with the “completeness principle,” according to which all stocks are categorized as value, growth, or some combination of both. But that’s just not true; some stocks are neither.
”The impact of “style investing” was formally examined in the academic literature by Barberis and Shleifer (2003), who showed that investor categorization by style and the flows it induces can cause asset prices within a style to move together and deviate from fundamentals. Since then, style investing has grown to become an enormous portion of the stock market. The massive scale means getting it right is important. Roughly, $14 trillion (23% of the $62 trillion U.S. stock market) passively tracks or is benchmarked to traditional style indices (see Appendix A).
A central feature of today’s dominant style index structure is the “completeness property,” the rule that an equal mix of value and growth indices must replicate the parent cap-weighted index at each annual reconstitution. The symmetry imposed by this design ensures that investing equally in both style indices is functionally equivalent to investing in the full market, eliminating any aggregate style bias. Russell, S&P, and MSCI all build their standard style indices by splitting the weight of “crossover” stocks into both their value and growth indices.1 Choice of characteristics to define style and methods for defining crossover stocks differ, but all three include stocks that are neither value nor growth.
The world’s largest asset managers create and sell style index funds, which hold much of the market’s expensively priced stocks of companies with slow or negative growth. In turn, investment advisors and consultants recommend value and growth index funds to their clients. Investors in style index funds may assume they get diversification of style. But do they? This isn’t diversification; it’s diworsification.
We ask a simple question: Why include expensive stocks of slow-growing companies in either index? We think doing so is illogical, unnecessary, and costly.
We ask a simple question: Why include expensive stocks of slow-growing companies in either index? We think doing so is illogical, unnecessary, and costly.
”Value and Growth Quadrants
Can we design an alternative? Yes, style portfolios can be created to exclude the expensive stocks of slow-growing companies, which have historically underperformed.
Here, we present a blueprint for this alternative structure. Value and growth portfolios can be built upon sturdy foundations: value on cheaply priced stocks and growth on fast-growing companies. Both foundations can eliminate the structural weakness of including expensive stocks of slow-growing companies.
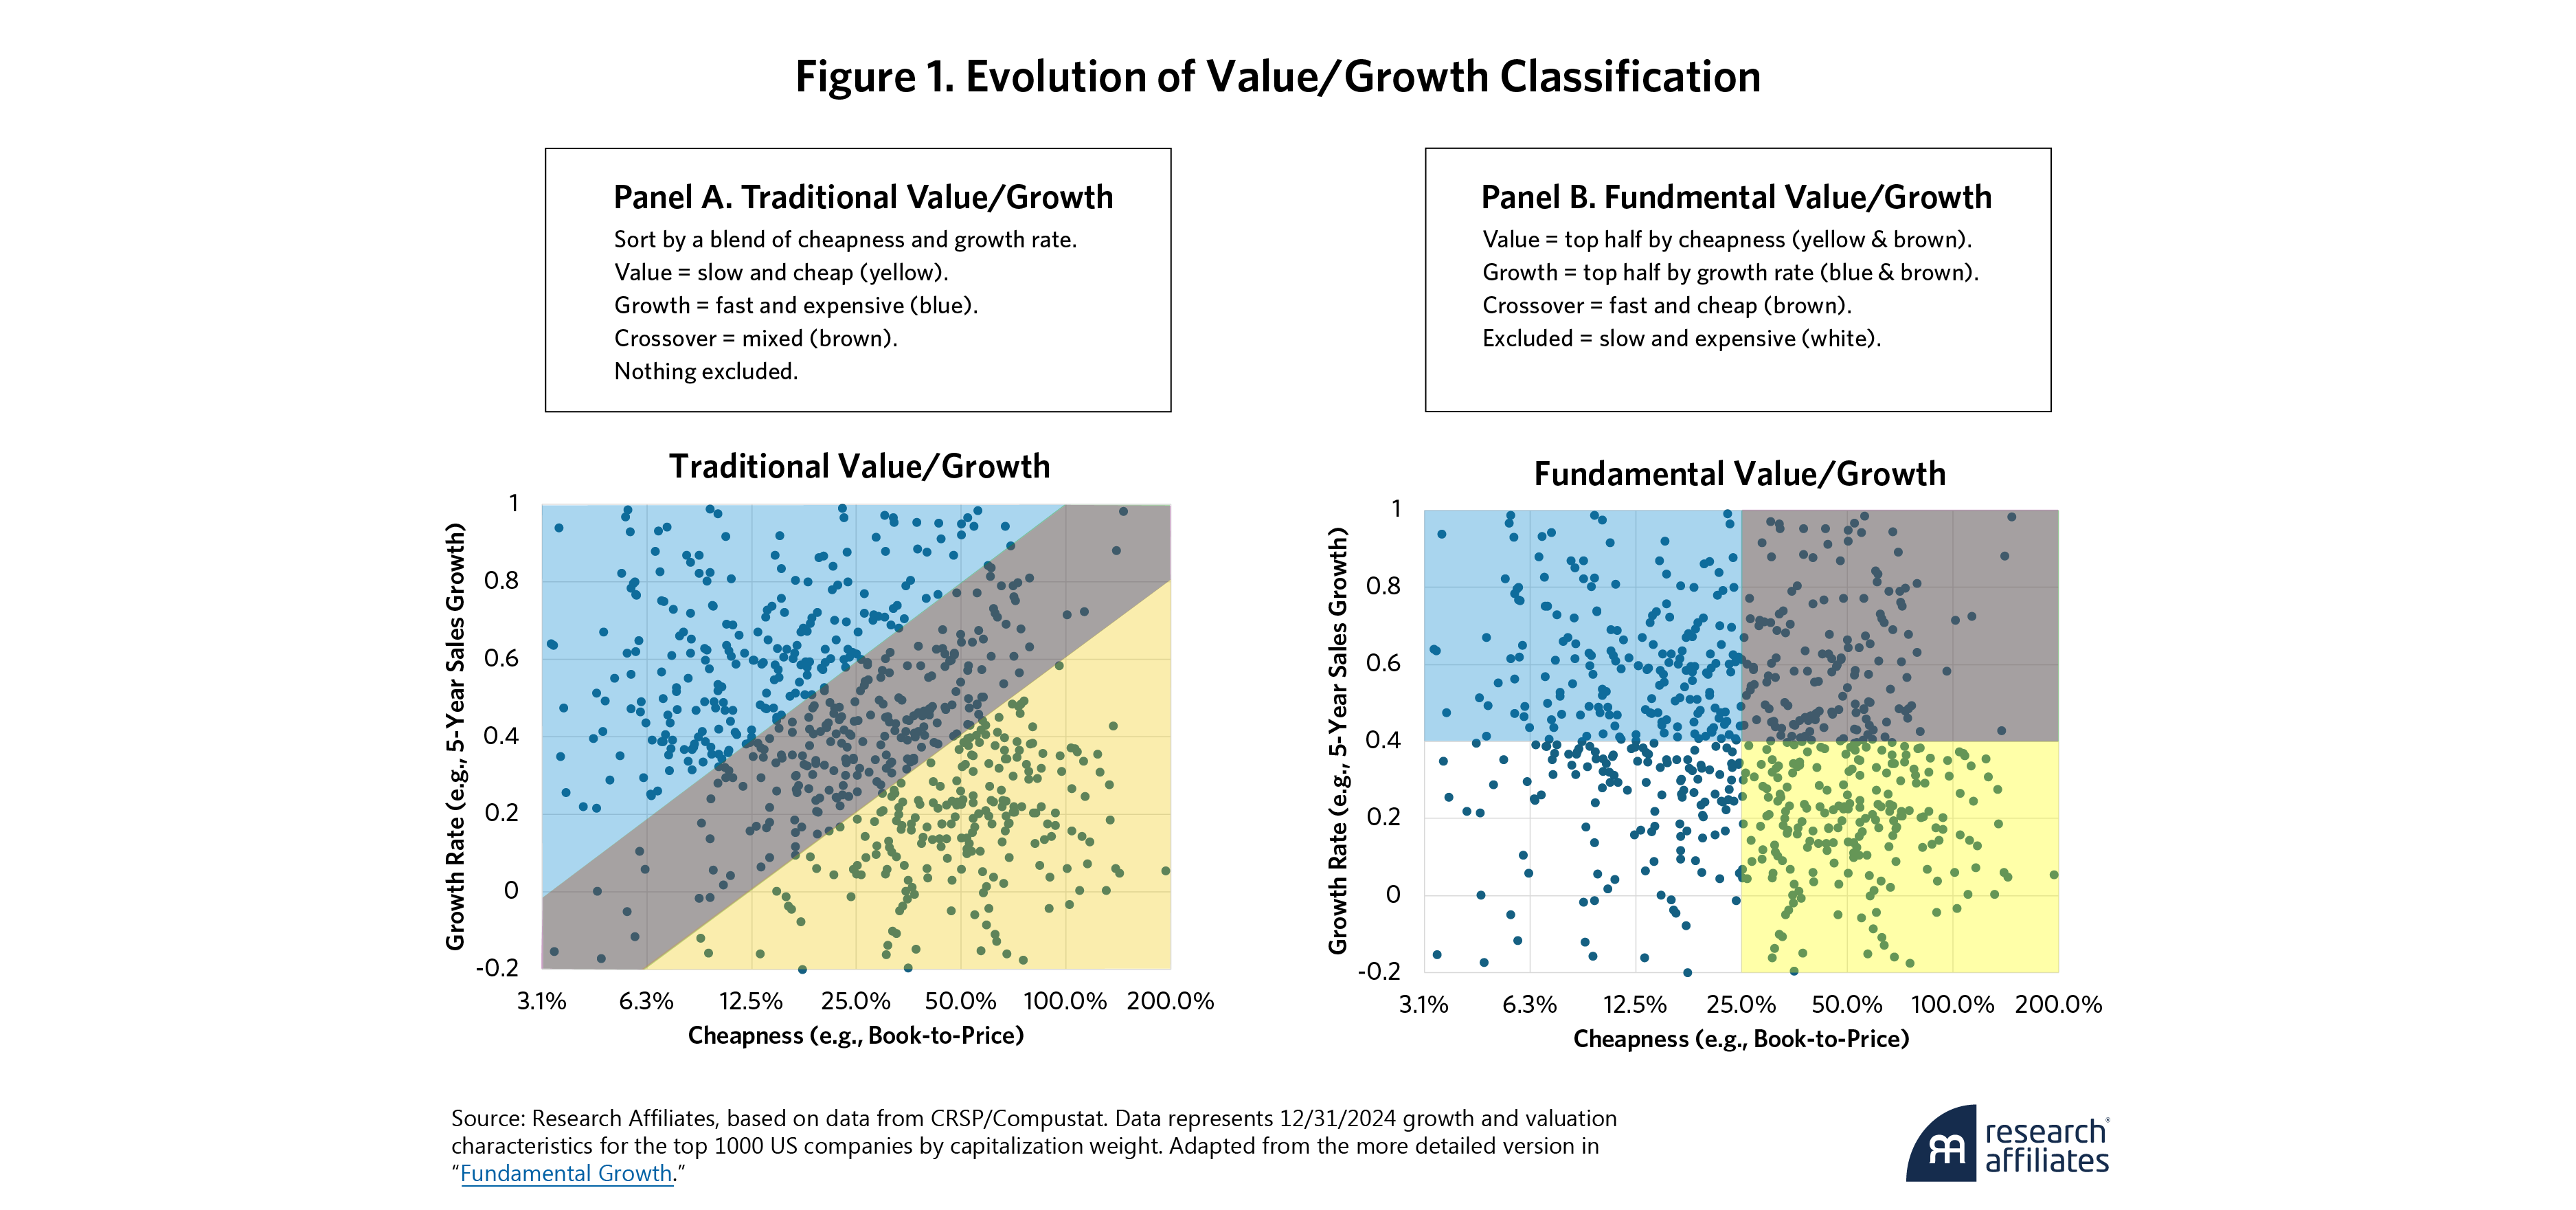
To provide a simple example of the alternative framework,2 we measure value as book-to-price, the original ratio used in the seminal research that identified the value premium (Rosenberg, Reid, and Lanstein, 1985; Fama and French, 1993). We measure growth as five-year sales growth. Unlike earnings growth, sales growth may be calculated consistently across the entire market, including young, innovative companies that are not yet profitable.
Stocks are then sorted by book-to-price and sales growth. Combining these measures, we place stocks into a two-by-two matrix, with valuation on one axis and growth on the other axis.
Figure 1 contrasts the traditional style classification with our proposed framework. Panel A illustrates today’s style designs based on the completeness principle, which requires that all stocks be in value, growth, or both. Panel B illustrates our approach. We define the value portfolio as cheaply priced stocks, regardless of the companies’ growth rates. We define the growth portfolio as fast-growing companies, regardless of their stocks’ valuation ratios. We exclude the expensive/slow-growth quadrant from both value and growth portfolios.
This framework allows for a simple, practical implementation: a portfolio that combines the market's cheapest stocks with its fastest-growing stocks, thereby systematically avoiding the slow/expensive quadrant.
Quadrant Performance
Next, we form portfolios by cap-weighting stocks in each quadrant. We then simulate their performance from March 1970 through June 2025 and also simulate broad-market and traditional style portfolios as reference benchmarks.
The broad-market benchmark includes the top 1,000 U.S. companies by market capitalization (CW 1000). The style benchmarks (CW Growth and CW Value) decompose the CW 1000, assigning 500 stocks each to the value and growth portfolios based on a composite score of the same signals used to define our quadrants: book-to-price and five-year sales growth.3
The results are instructive, as shown in Table 1. Not surprisingly, the Cheap/Fast quadrant of this matrix is the most attractive, outperforming the market by 0.8% per year. The Slow/Expensive quadrant has trailed badly, underperforming the market by 2.0% per year. It’s the one quadrant that investors may do without. Slow/Cheap includes typical value stocks, and Fast/Expensive includes typical growth stocks. Both performed in between the Cheap/Fast and Slow/Expensive quadrants.
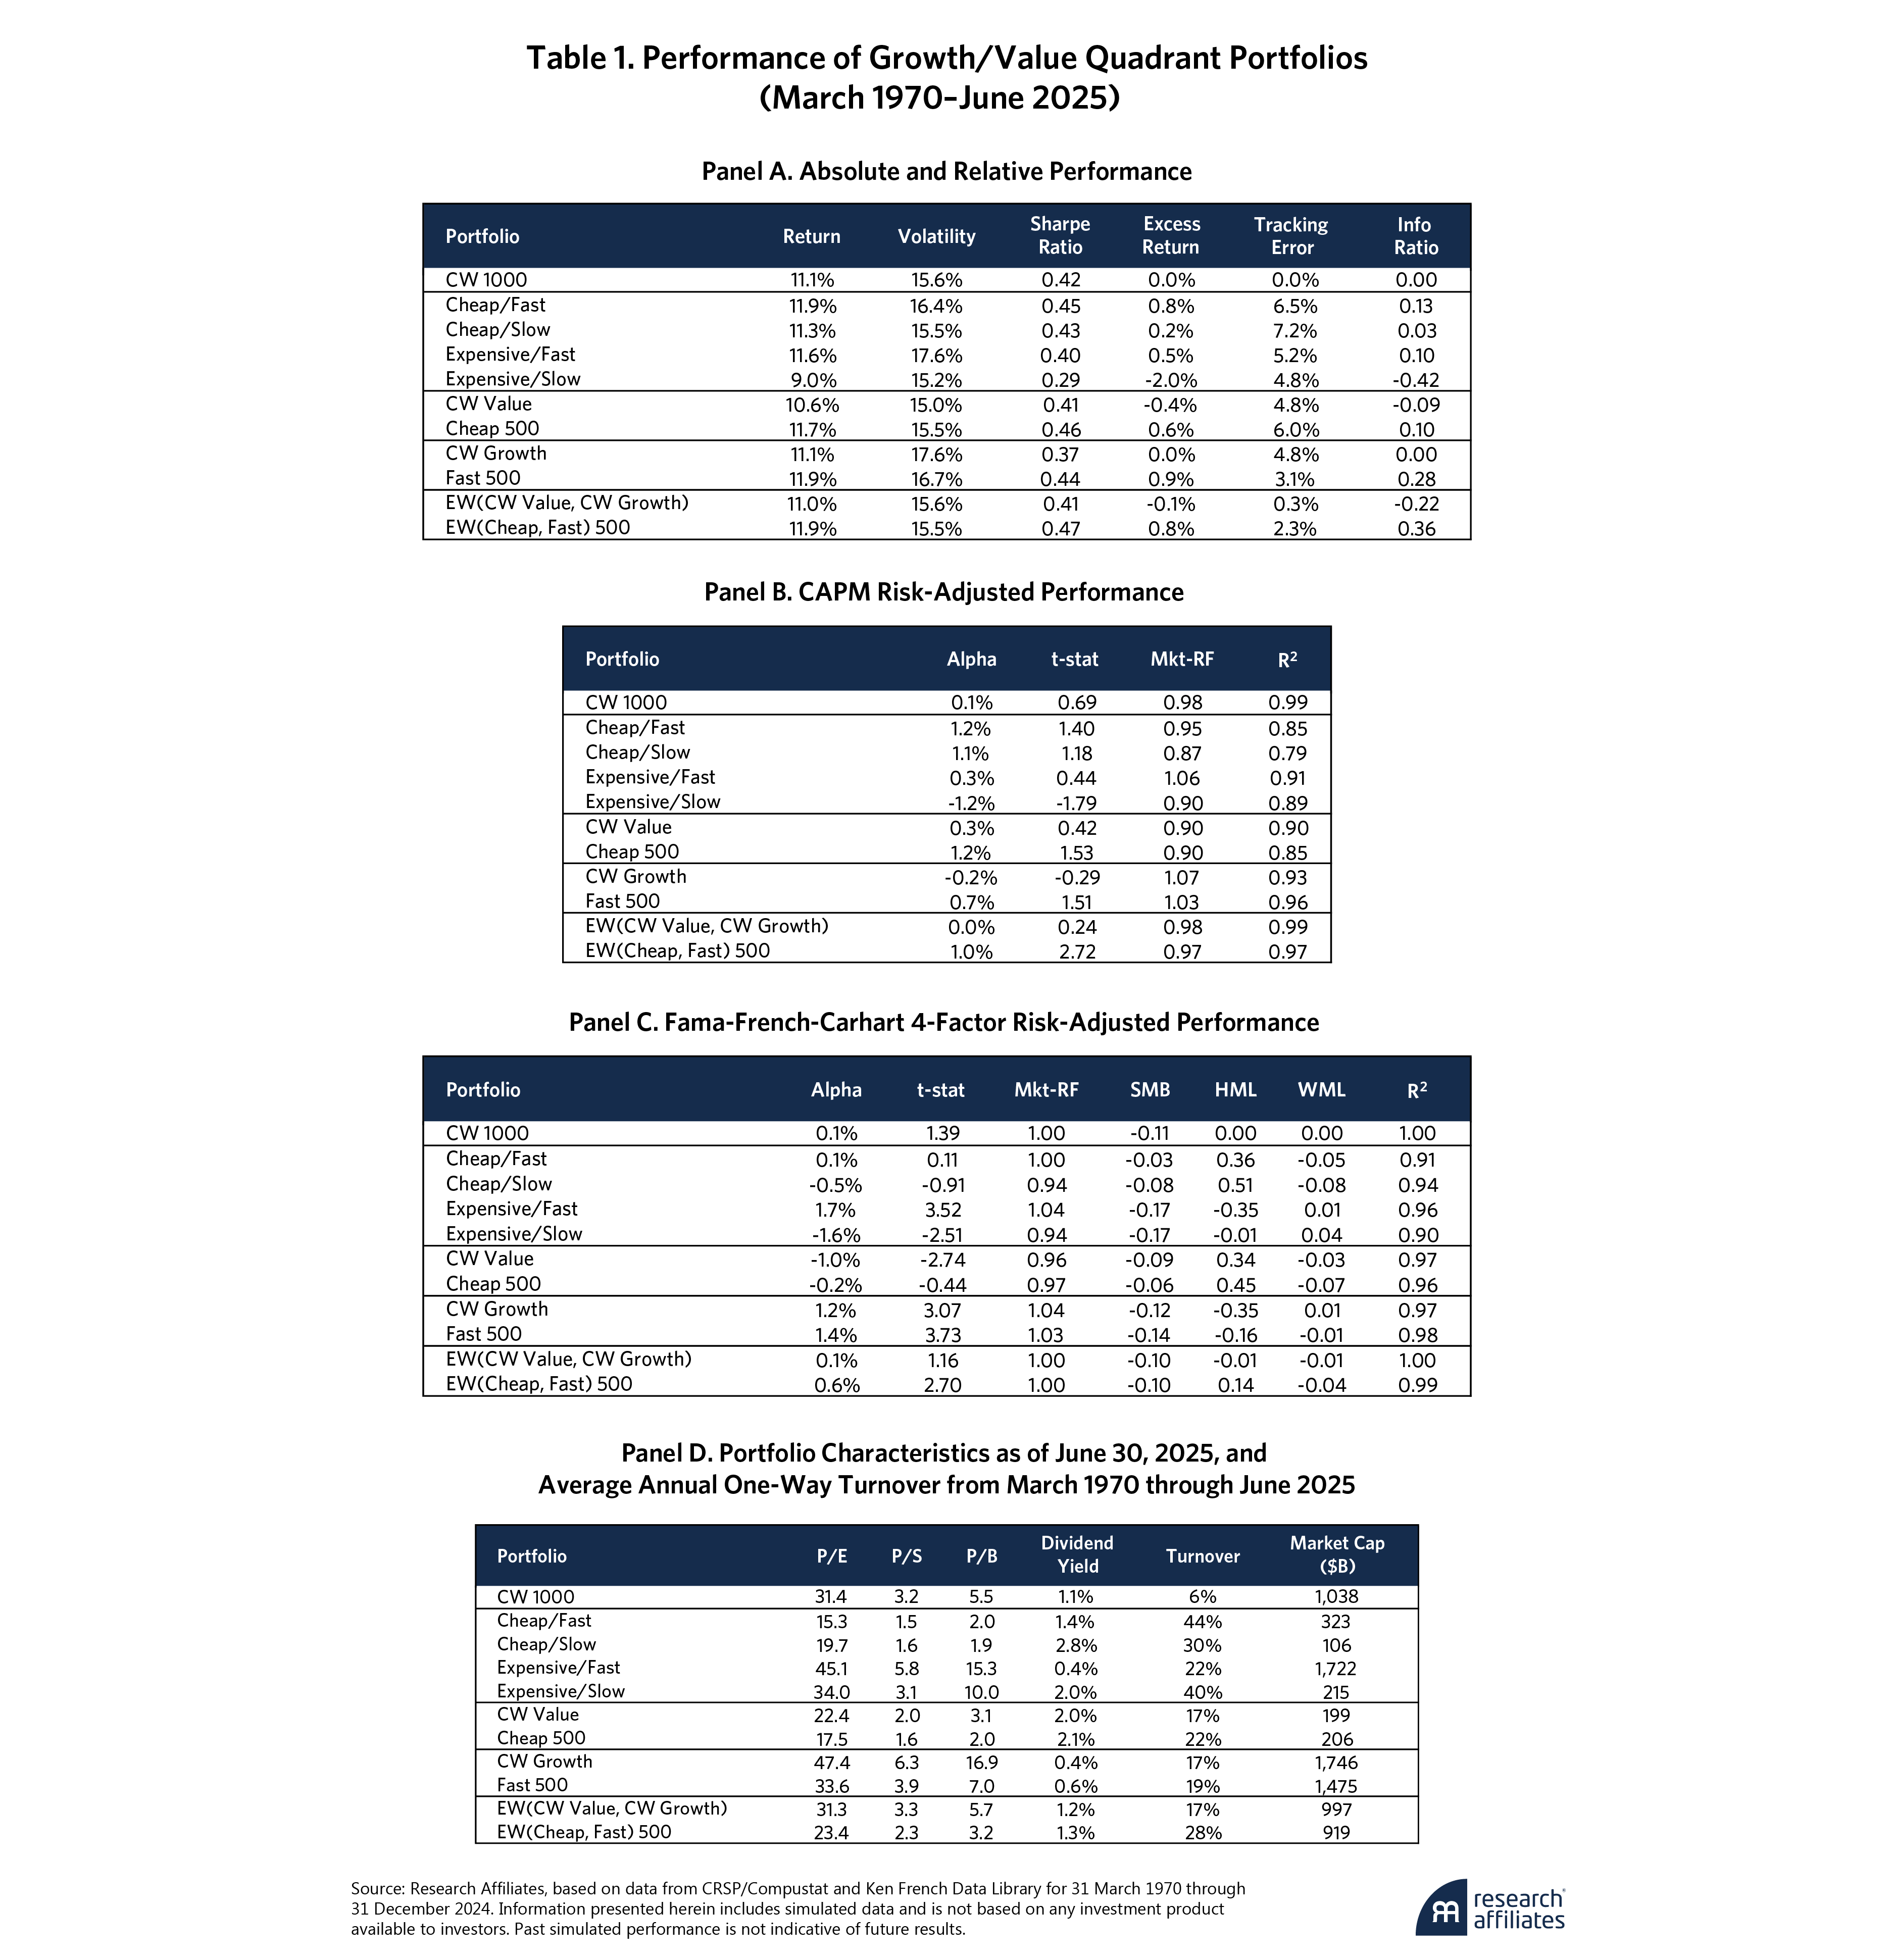
As we see in Panel A, an equal-weighted mix of traditional value and growth, labeled "EW(CW Value, CW Growth)", delivered zero alpha, with tracking error of 0.3% relative to the market. By construction, the equal mix of the two styles reproduces the market: it’s the completeness property at work.
In contrast, an equal-weight blend of the Cheap 500 and Fast 500 portfolios, labeled "EW(Cheap, Fast) 500", historically outperformed the market by 0.8% per year, with tracking error of only 2.3%. On a risk-adjusted basis, the advantage is even clearer: a CAPM alpha of 1.0% with a statistically significant t-statistic of 2.7. In the four-factor model, the alpha drops to 0.6% but retains a t-stat of 2.7 (Fama and French, 1993; Carhart, 1997).
Detaching value and growth by excluding expensive stocks of slow-growing companies produces cleaner growth and value portfolios. Our analysis shows that combining a value portfolio defined solely as cheaply priced with a growth portfolio defined solely as fast growth produces a portfolio that significantly outperformed the market and the combination of traditional style indexes.
Our analysis shows that combining a value portfolio defined solely as cheaply priced with a growth portfolio defined solely as fast growth produces a portfolio that significantly outperforms the market and the combination of traditional style indexes.
”Figure 2 compares the time series of relative wealth with the market portfolio as represented by CW 1000. We graph both traditional value and growth indices and the cleaner style portfolios defined solely as cheap stocks and fast-growing stocks. The graph displays relative wealth, with the line at 1.0 on horizontal axis representing the market portfolio.
Of course, the equal-weighted combination of traditional value and growth provided approximately zero alpha against the broader market because the combination reconstructs the market (i.e., the completeness principle). In a stark contrast, the combination of cheap and fast portfolios provided remarkably steady growth of excess wealth.

This persistent, accumulation of relative wealth raises an intriguing question: can we improve performance of these portfolios by concentrating them?
Benefits of Concentration
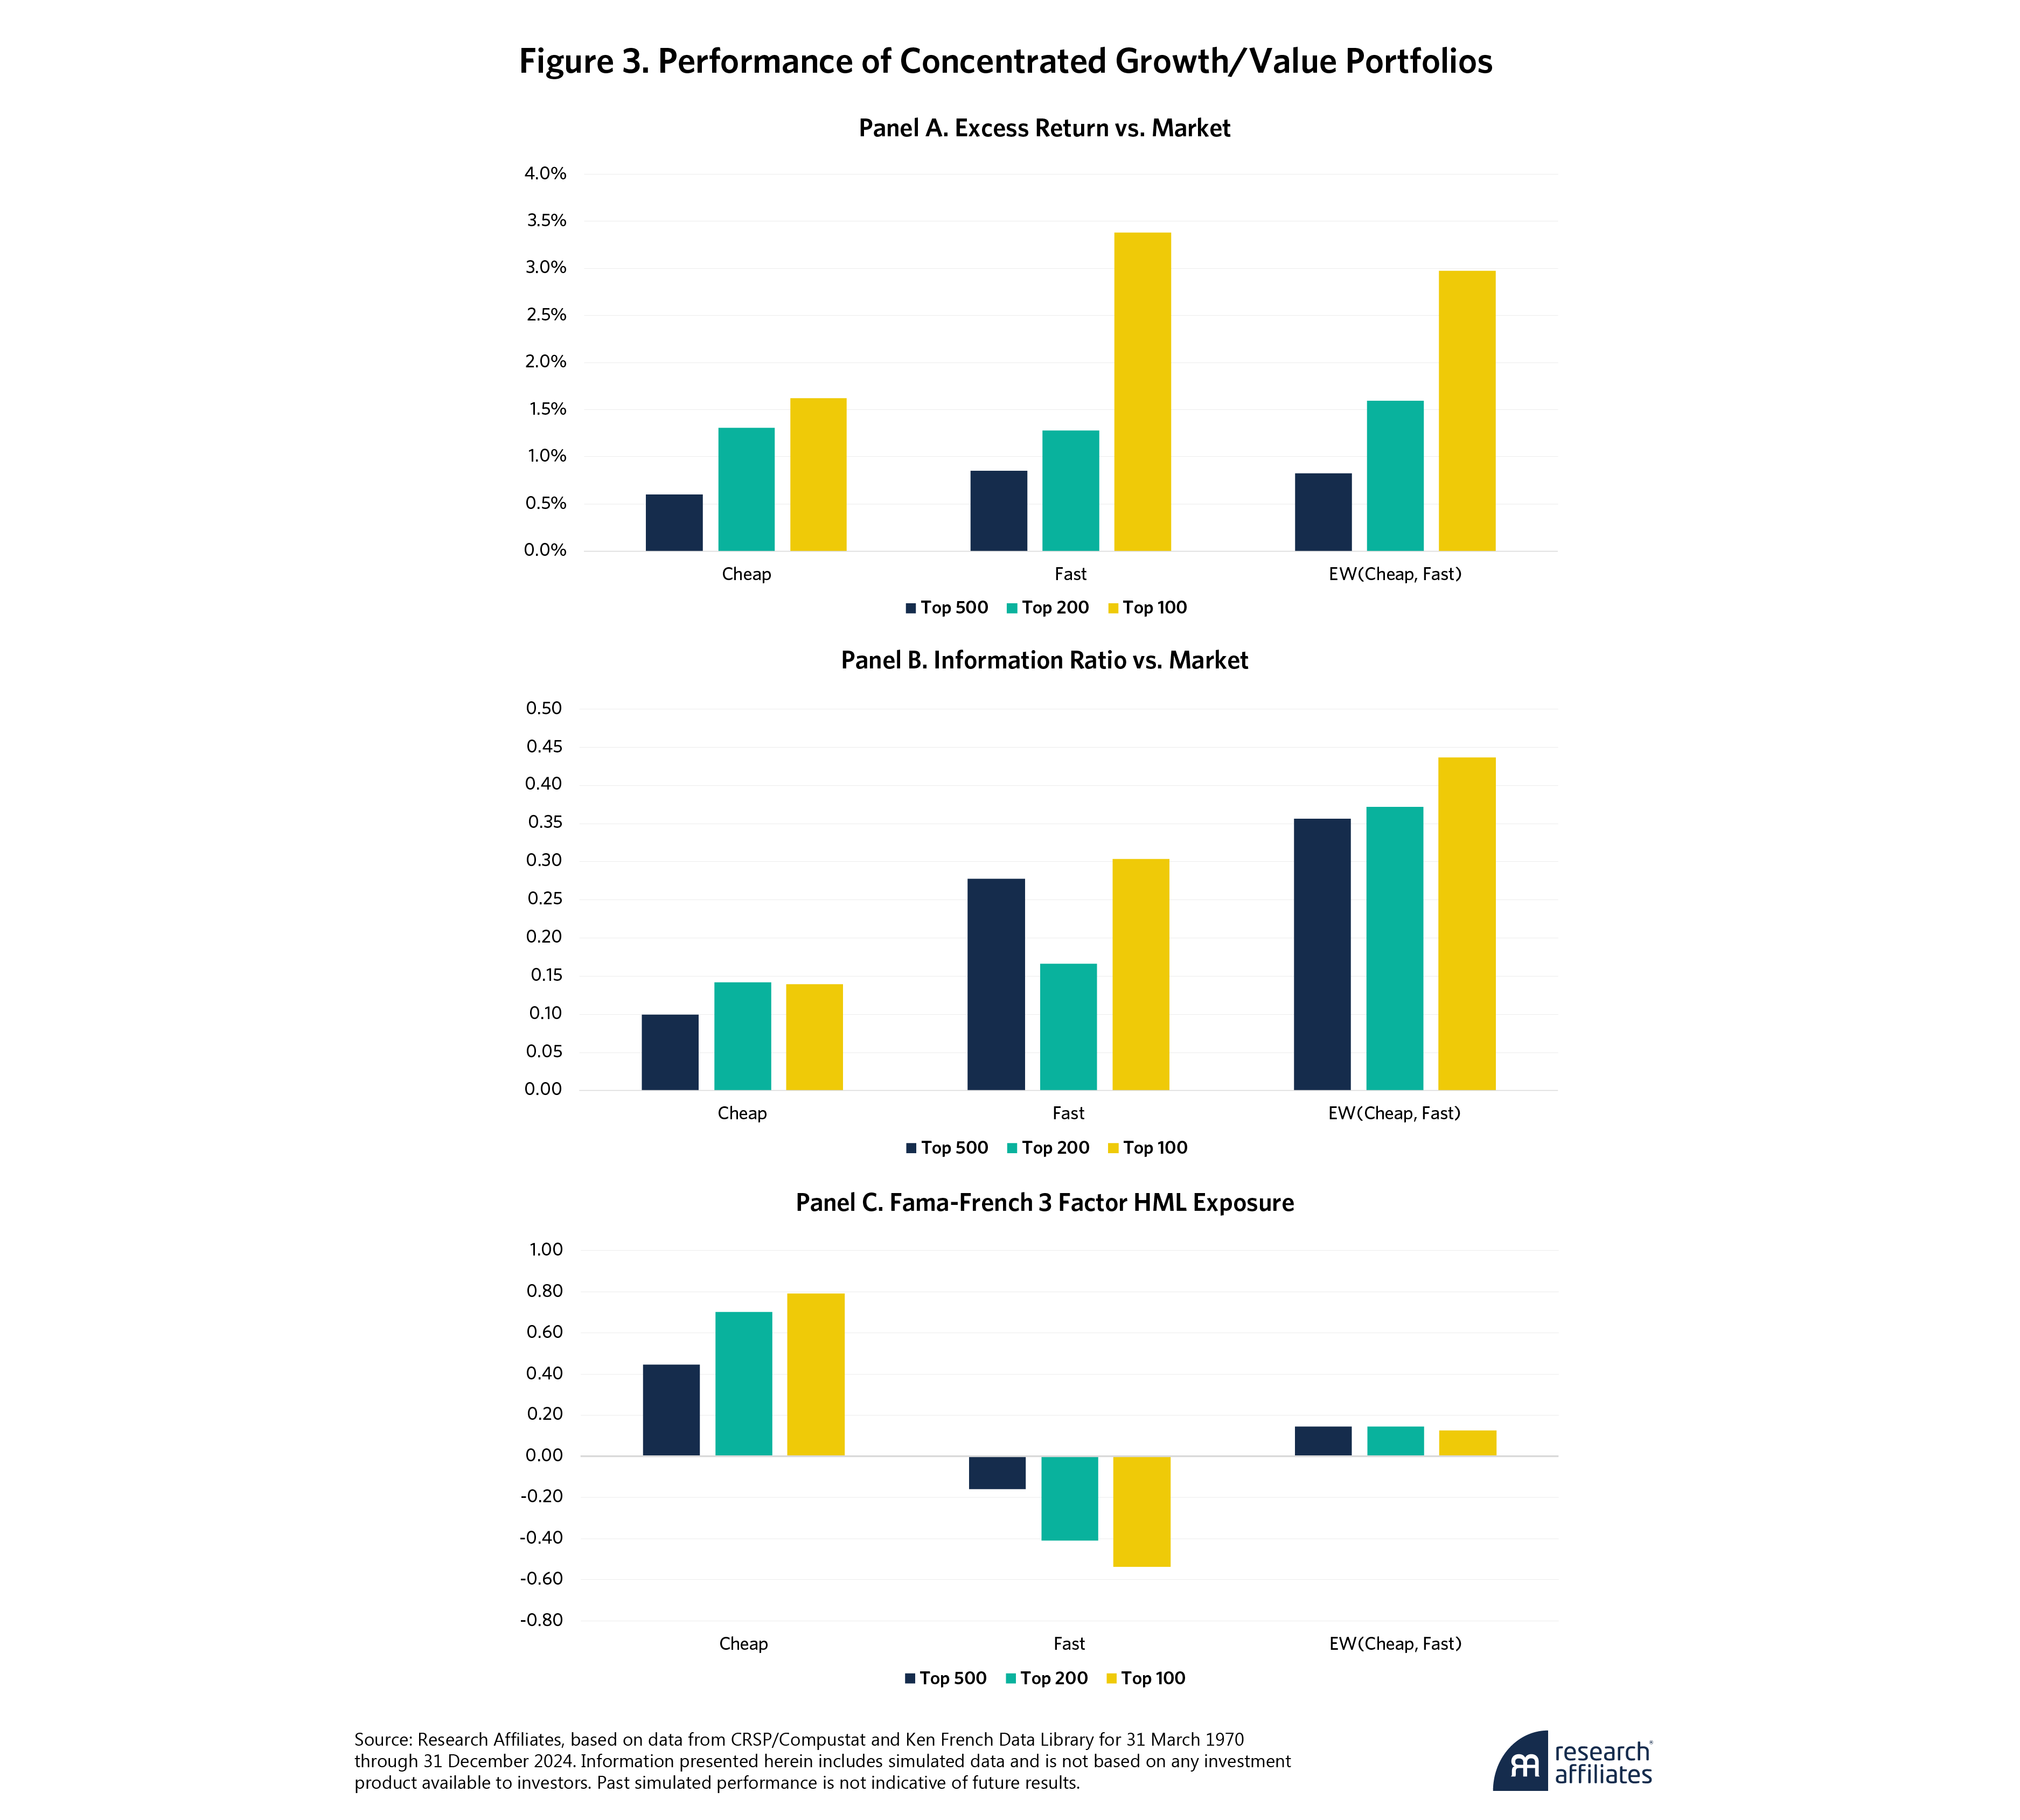
We tested this question by creating more concentrated portfolios, moving from the top 500 stocks in each category to the top 200 and top 100. As shown in Table 2, the results confirm that concentration raises excess returns. Eliminating the worst quadrant improves performance, and concentrating in the best stocks enhances it further.
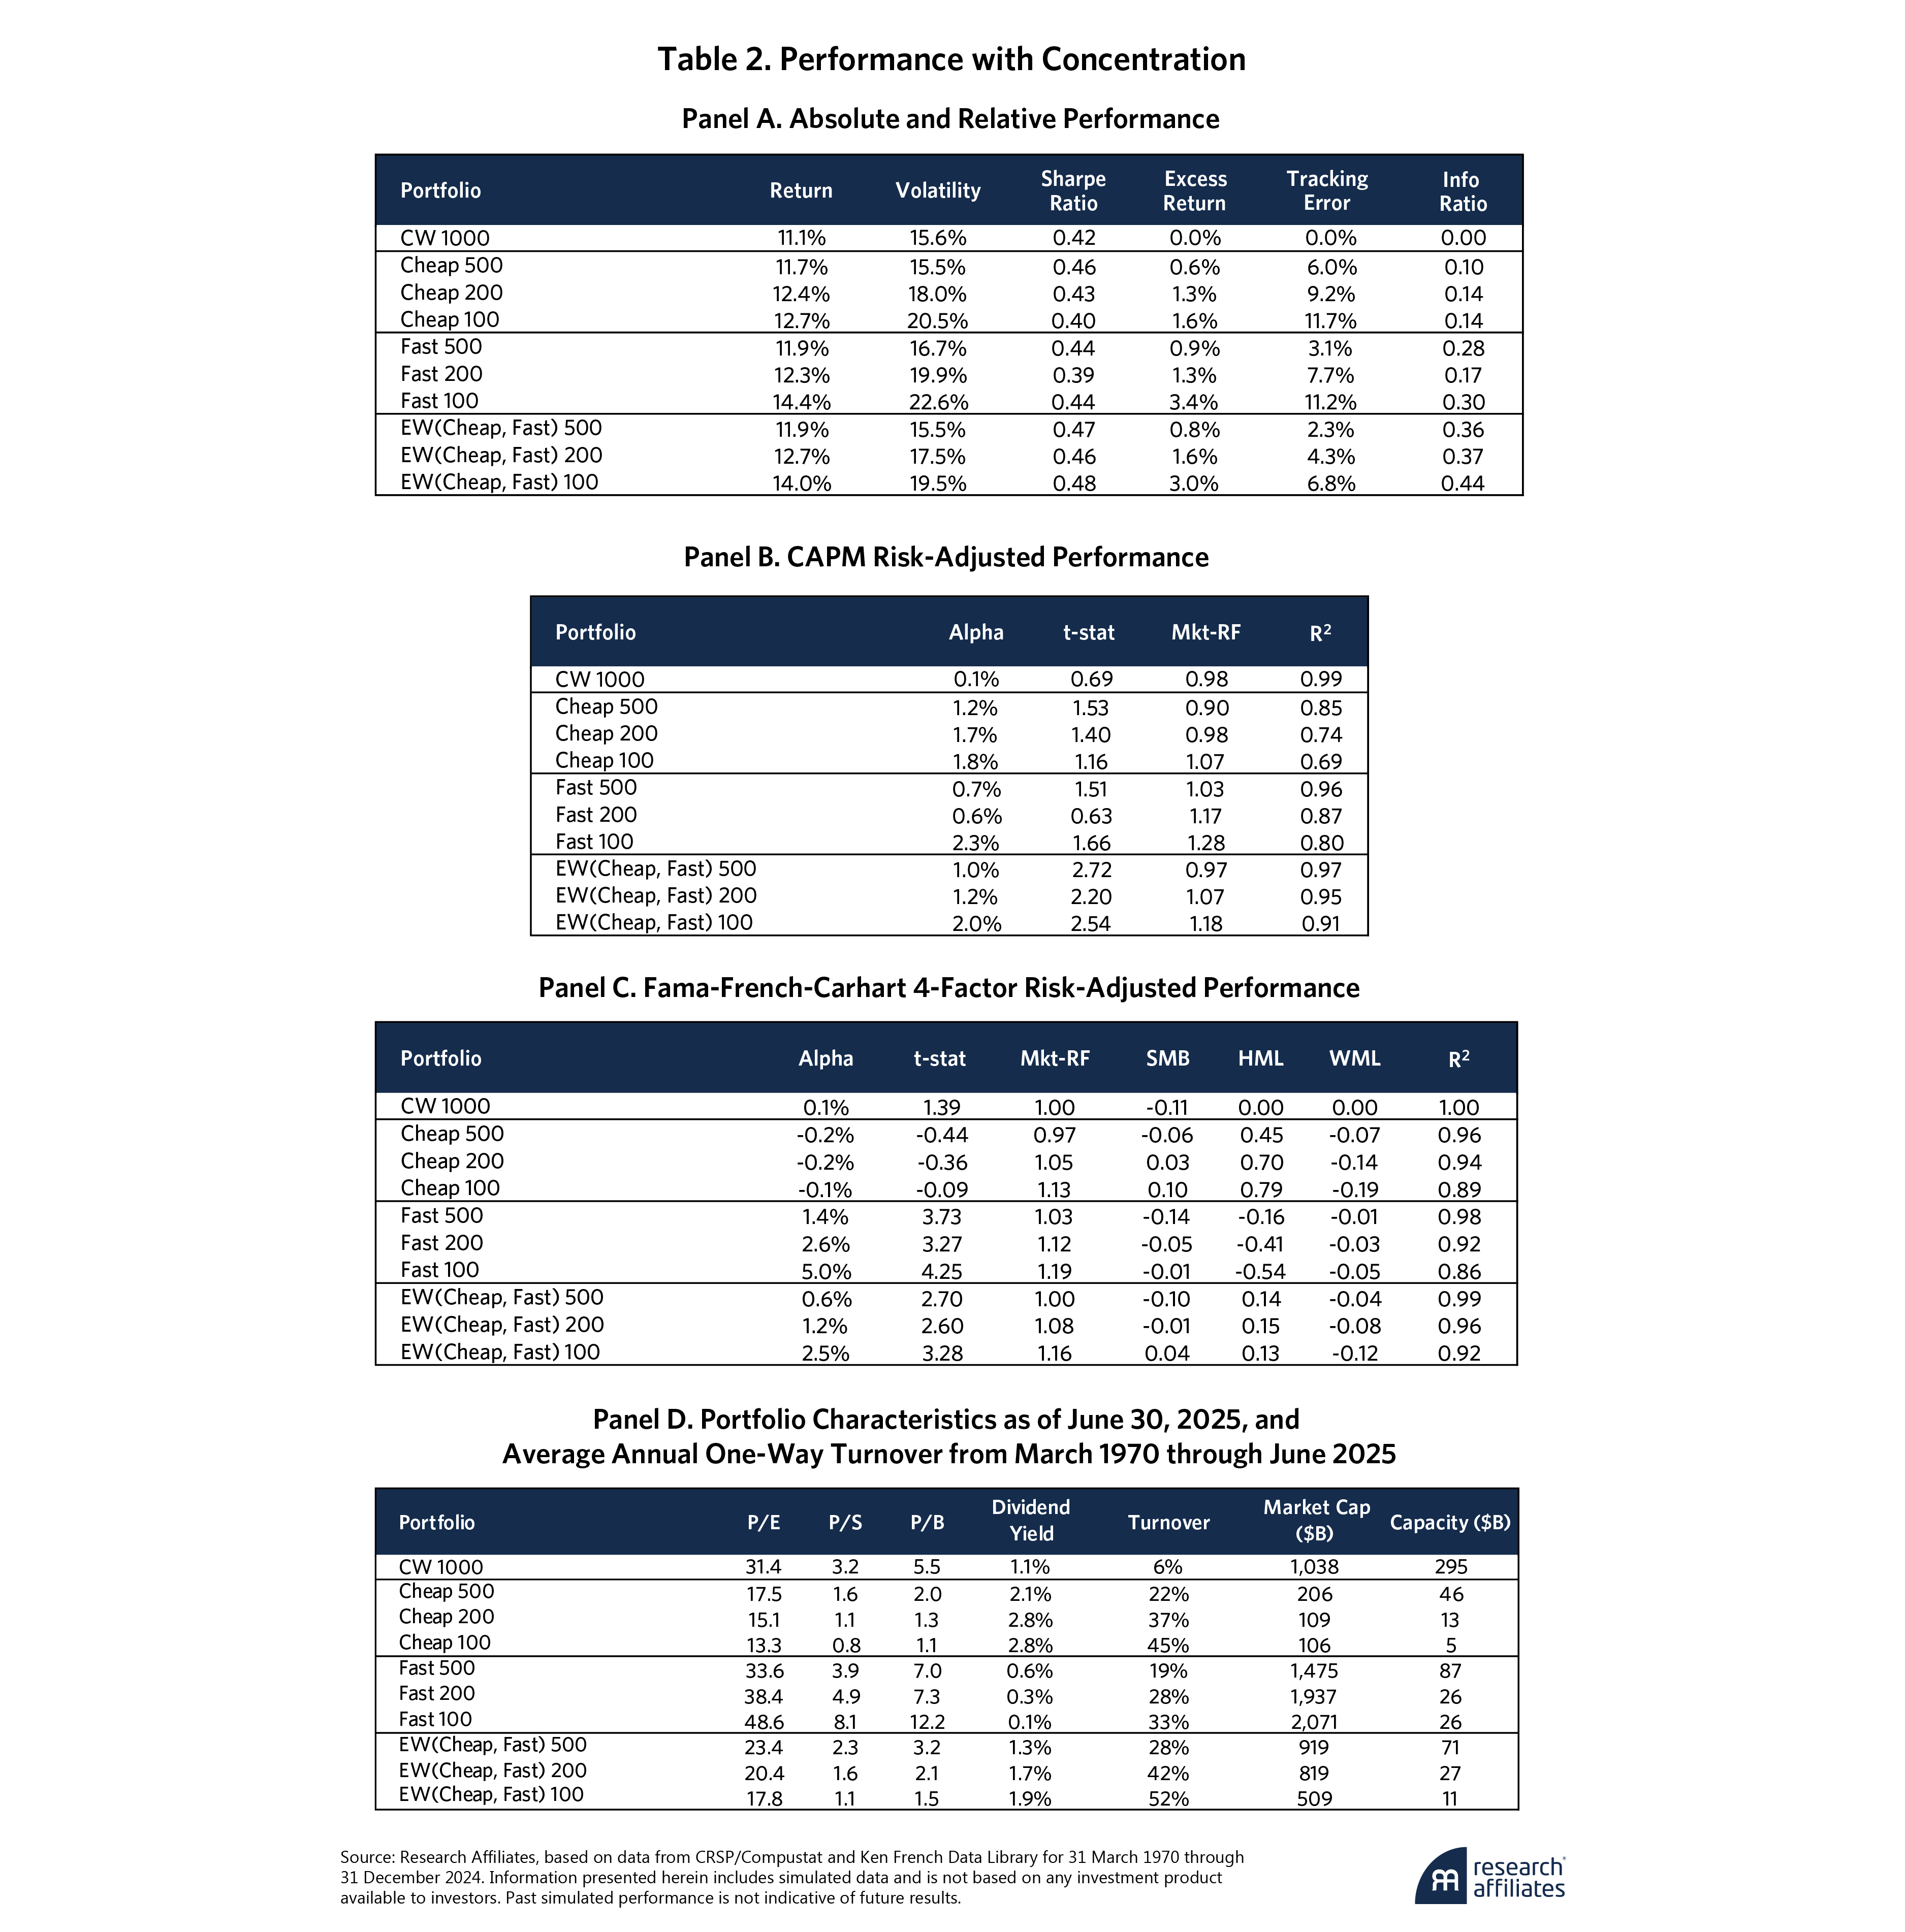
Figure 3 illustrates these results. As concentration increases, the cheap, fast, and equal-weighted cheap/fast portfolios all produce superior performance. Not only does concentration raise excess returns, but it also improves information ratios.
Importantly, factor loadings also intensify performance. The HML loading of the cheap portfolio becomes more strongly positive, and the HML loading of the fast portfolio, more strongly negative. As a result, the excess returns of the two portfolios become more negatively correlated, improving diversification.
The pattern of persistent trends and then reversals of value and growth excess returns (as illustrated in Figure 2) suggests an additional opportunity to go beyond static allocations to Cheap and Fast. Timing style trends may add to performance.
Style Timing
Can investors get even better performance by shifting between styles over time rather than holding a static mix? Our research, even with the simple alternative framework, suggests they can.
The relative performance of cheap versus fast is not random; it runs in cycles. Asness, Friedman, Krail, and Liew (2000) demonstrates that systematic timing between value and growth can meaningfully enhance returns, a finding that continues to hold across decades of data. Value is favored in recoveries and growth in downturns, a pattern linked to shifting macroeconomic conditions (Petkova and Zhang, 2005). Likewise, investor sentiment inflates growth stocks, leaving unpopular value stocks behind. When sentiment eventually turns, growth stocks suffer and value stocks outperform (Lakonishok, Shleifer, and Vishny, 1994; Baker and Wurgler, 2006).
Our timing approach builds on a growing body of research documenting factor momentum. Studies show that factor returns display short to intermediate-term persistence. Momentum of specific stocks largely reflects momentum in factor exposures (Arnott, Kalesnik, and Linnainmaa, 2021).
To time styles, we use the momentum turning points (MTP) framework of Goulding, Harvey, and Mazzoleni (2023). This signal combines a slower 12-month trend with a faster six-month trend.
Simpler crossover rules switch between portfolios every time the trends cross, even when both point in the same direction. MTP does not switch between value and growth when the trends cross but still point in the same direction, as happens during persistent bull and bear markets. It switches only when the fast and slow signals diverge in sign, thereby filtering out many reversals. MTP thus improves performance and reduces turnover.
Following the MTP signal, the combined portfolio compounds wealth faster than static allocations do, as shown in Table 3. Style timing with MTP provides higher excess returns, Sharpe ratios, and information ratios. The MTP style-timed portfolio of the 100 cheapest and 100 fastest stocks earns a striking 18.2% per year, compared with 11.1% for the broad market.
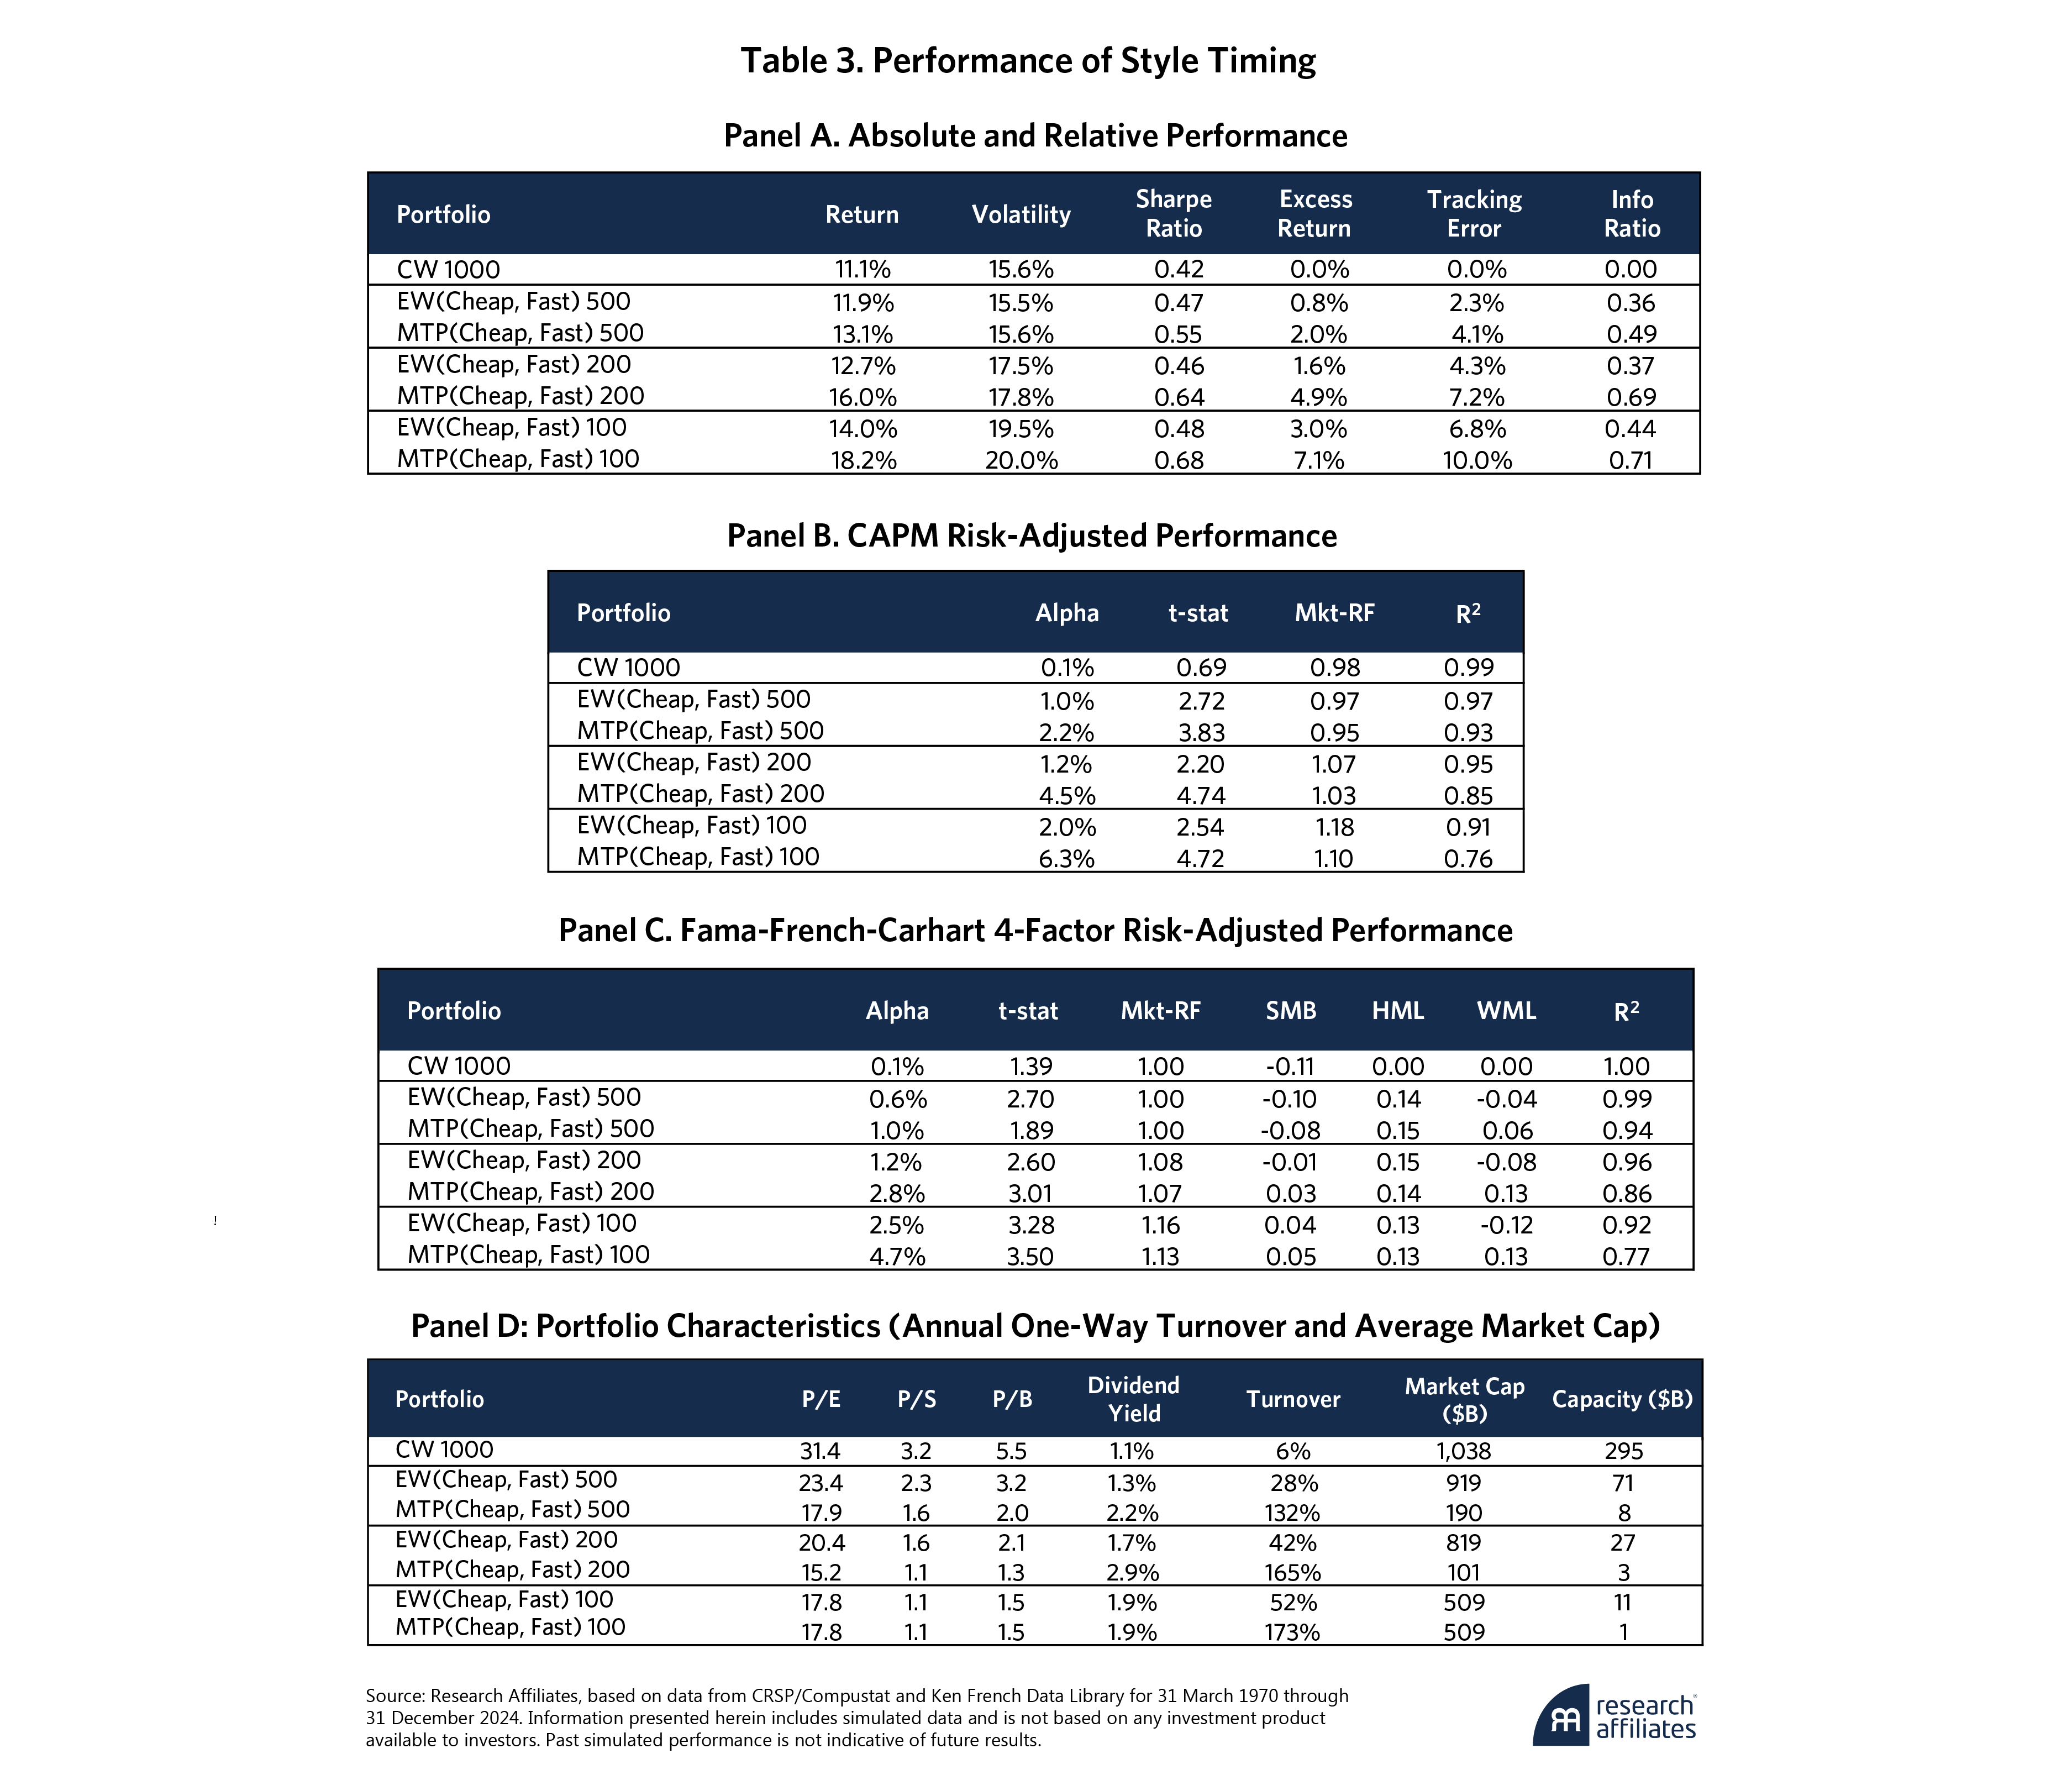
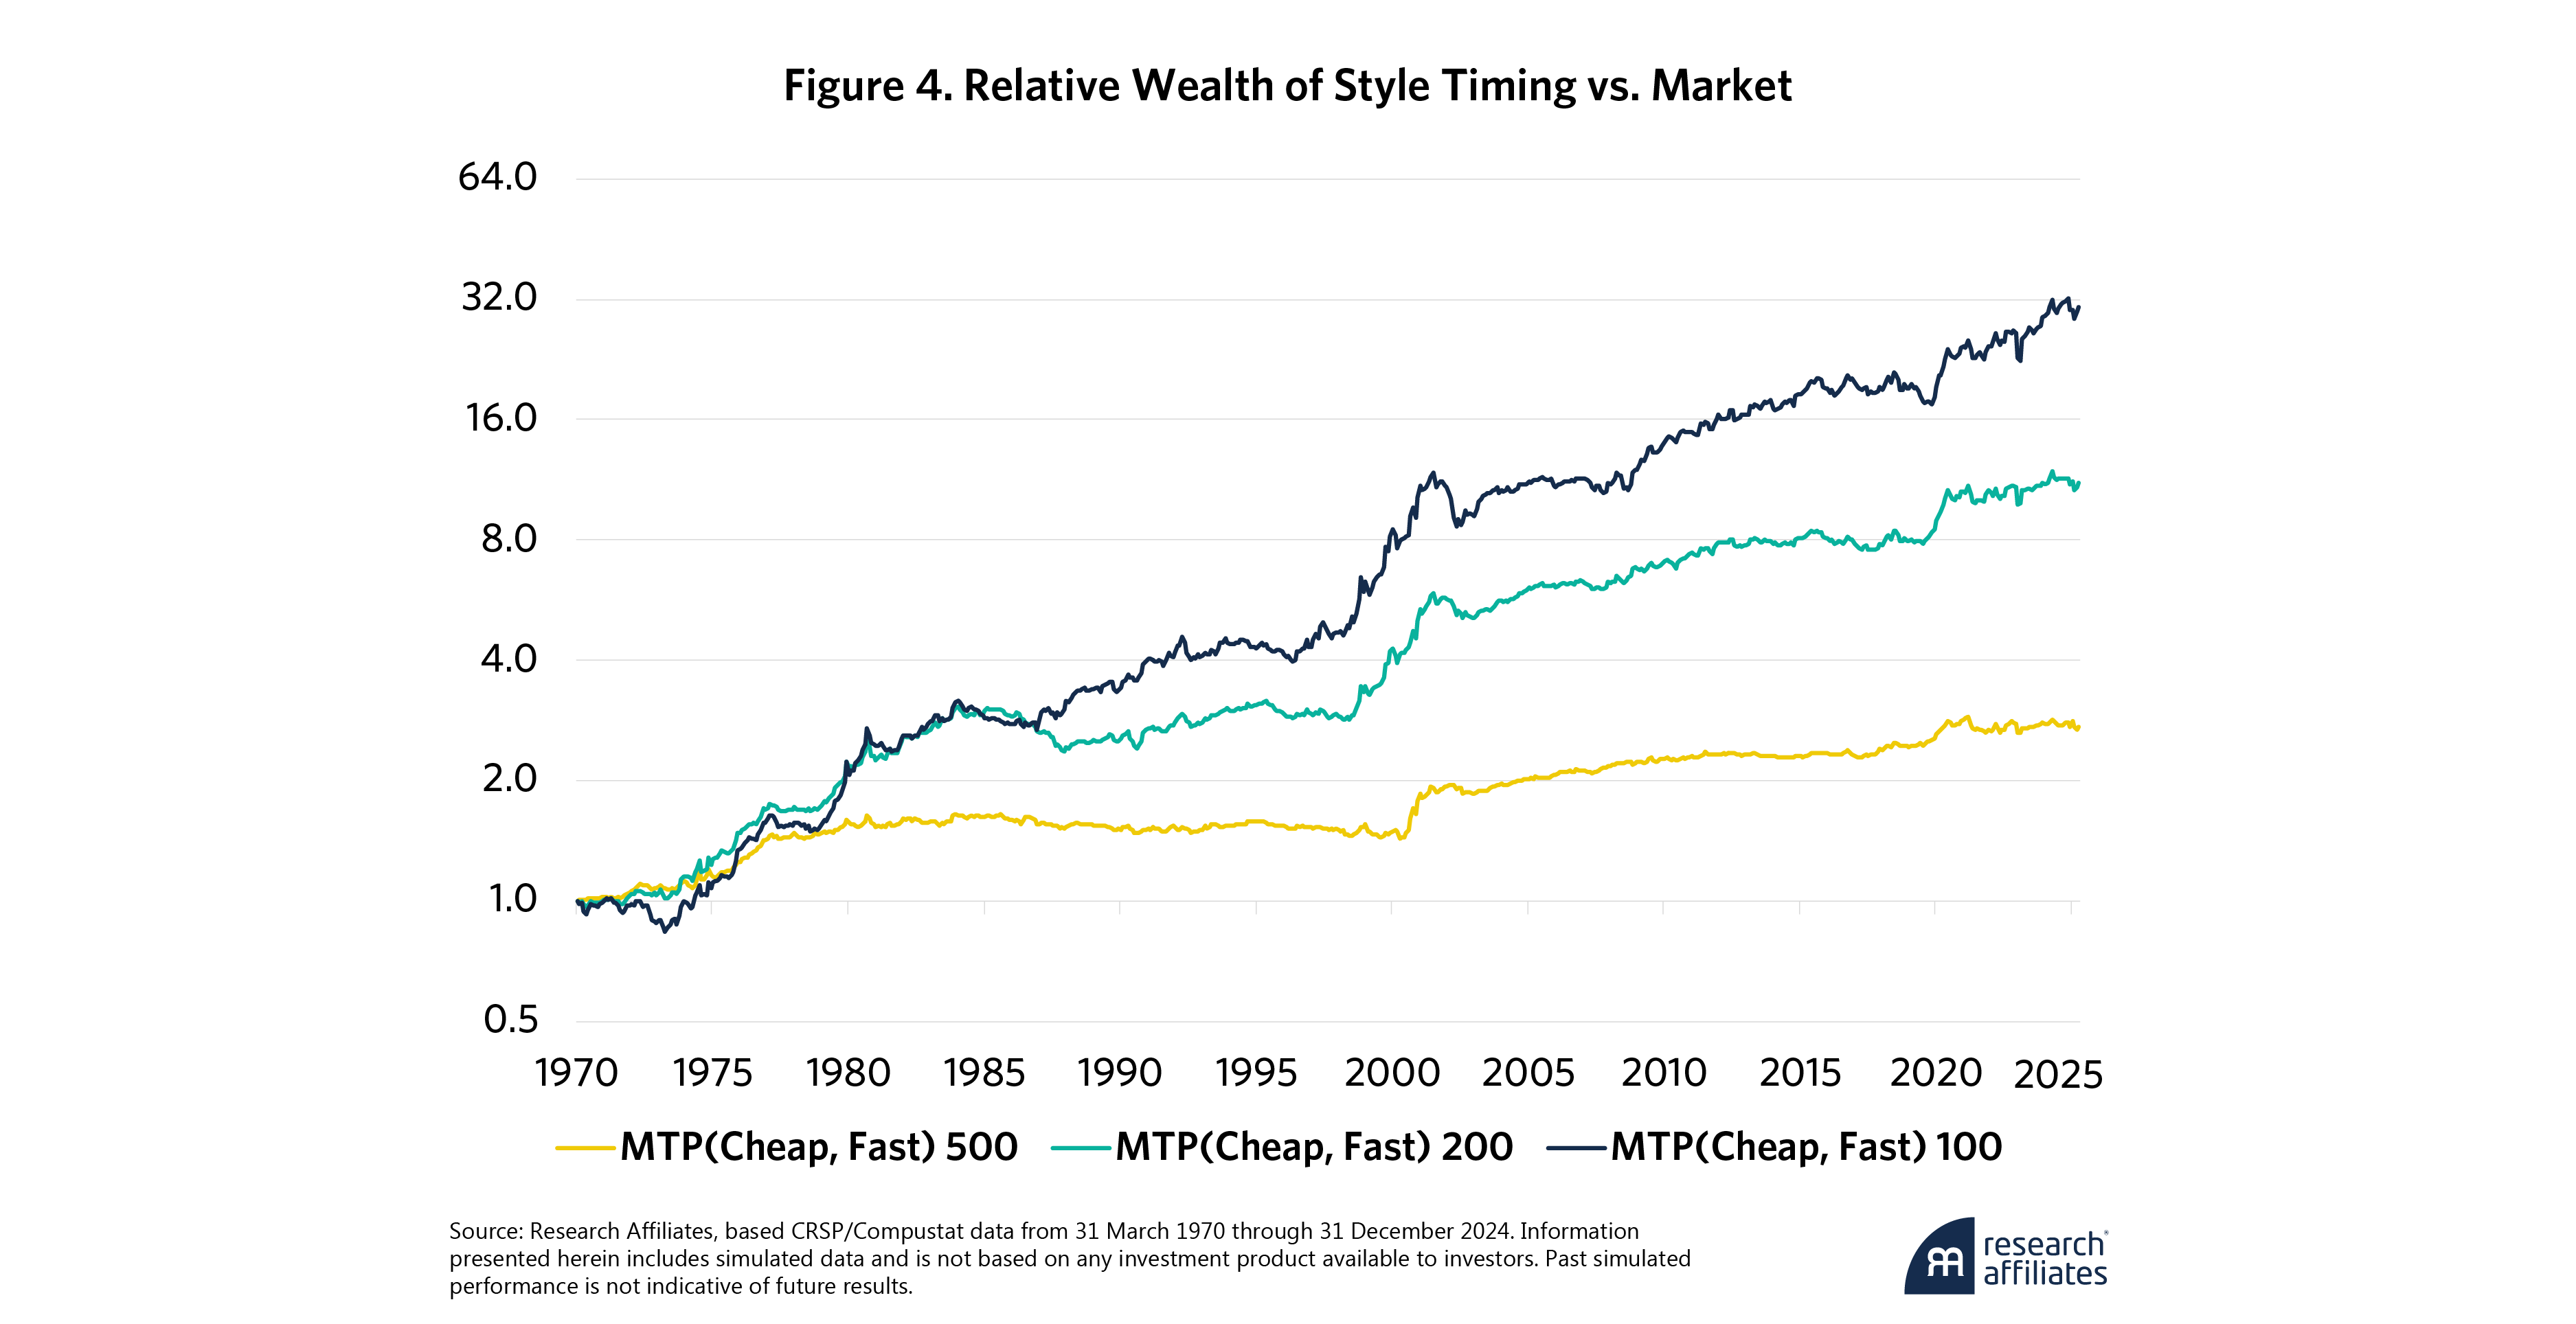
Figure 4 displays the time series of relative wealth (versus the market) of MTP-based style-timing portfolios at different levels of concentration. All portfolios steadily compounded relative wealth, with both excess returns and information ratios increasing with the level of concentration of the value and growth portfolios. The excess returns for the combination of Top 500 growth and value names was a statistically significant 2.0% with an information ratio of 0.5, and the more concentrated Top 100 version produced an excess return of 7.1%, with an impressive 0.7 information ratio.
Why Does This Opportunity Persist?
Traditional style indices are firmly embedded in today’s portfolio management structure. For asset managers, style funds are easy to explain, easy to create, and easy to sell. Moreover, once a fund sponsor has created and sold a fund with billions invested, they have a strong financial incentive to perpetuate it.
These structural incentives are reinforced by investor behavior. Many prefer familiar, household-name companies because they feel safer than less well-known names. Examples include mature consumer brands, long-established technology firms, and global industrial champions. Investors seek comfortable stocks so that they can sleep well at night.
Remove Expensive Slow-Growth Stocks
For investors seeking a sturdier style framework, the opportunity is compelling. Traditional style indices have a structural weakness. Both value and growth indices hold stocks that are neither value nor growth. We propose an improved design.
For investors seeking a sturdier style framework, the opportunity is compelling.
”By removing the structural weakness of expensive stocks of companies with slow or negative growth, we create a simple and powerful framework. Value sits on a solid foundation of cheap stocks, and growth rests on a robust foundation of rapid business expansion. Both approaches exclude the performance drag that results from inclusion of expensive slow-growth companies. Simulated portfolios combing value and growth constructed with this alternative architecture provide persistent and significant excess returns. Concentration improves historical performance. Style timing further enhances investor’s returns over our sample.
Please read our disclosures concurrent with this publication: https://www.researchaffiliates.com/legal/disclosures#investment-adviser-disclosure-and-disclaimers.


Appendix A: Estimating Assets Tracking Style Indices
This appendix provides an estimate of the total assets (AUM) in the U.S. equity market that track traditional value and growth style indices, combining data from public sources
The total capitalization of the U.S. equity market was about $62 trillion at year-end 2024 (World Bank 2025). According to the Investment Company Institute (2025 Fact Book), U.S.-registered investment companies held approximately $39 trillion in total net assets, with $19 trillion to $20 trillion in domestic equity mutual funds and ETFs representing nearly 30% of total market capitalization.
Morningstar (2024) classifies U.S. equity funds into value, blend, and growth categories, with roughly 55% of assets in value or growth funds, and reports that about 53% of mutual fund and ETF AUM is passively managed. Combining these reported proportions implies $10 trillion to $11 trillion of AUM in passive equity funds, of which an estimated $5 trillion to $6 trillion tracks style indices.
On the active side, FTSE Russell (2021) reported $5.7 trillion in active strategies and $466 billion in passive products benchmarked to the Russell U.S. Style Indexes as of 2019. Adjusting for the approximate 40% growth in U.S. market capitalization through 2024 yields an estimated $8 trillion to $9 trillion of actively managed AUM benchmarked to style indices.
The $5 trillion to $6 trillion in passive style funds together with the $8 trillion to $9 trillion of actively managed AUM benchmarked to style indices totals about $14 trillion. Thus, roughly 23% of the U.S. equity market tracks style indices. This approximate, publicly sourced estimate is necessarily imprecise. Even with a 10% or 25% margin of error, the scale of assets tied to these benchmarks is enormous.
Most of these assets follow standard style index families designed to ensure complete market coverage. As S&P notes, these indices provide “exhaustive style indices that provide broad exposure” (S&P Dow Jones Indices, 2023). Pure-style or alternative factor indices represent only a very small share. For example, the two largest ETFs tracking the traditional S&P 500 Growth Index together hold more than $110 billion while the largest ETF tracking the S&P 500 Pure Growth Index holds less than $4 billion.
Appendix References
FTSE Russell. 2021. Russell Growth and Value Indexes: the enduring utility of style.
FTSE Russell. 2025. “Russell US Equity Indexes”.
Investment Company Institute (ICI). 2025. Investment Company Fact Book.
Morningstar. 2024. Global Passive Fund Flows: Year-End Report.
MSCI. 2023. Global Equity Index Methodology.
S&P Dow Jones Indices. 2023. S&P U.S. Style Indices Methodology.
World Bank. 2025. Market Capitalization of listed domestic companies (Current US$).
Appendix B: Attribution across Value, Growth, and Turning-Point Regimes
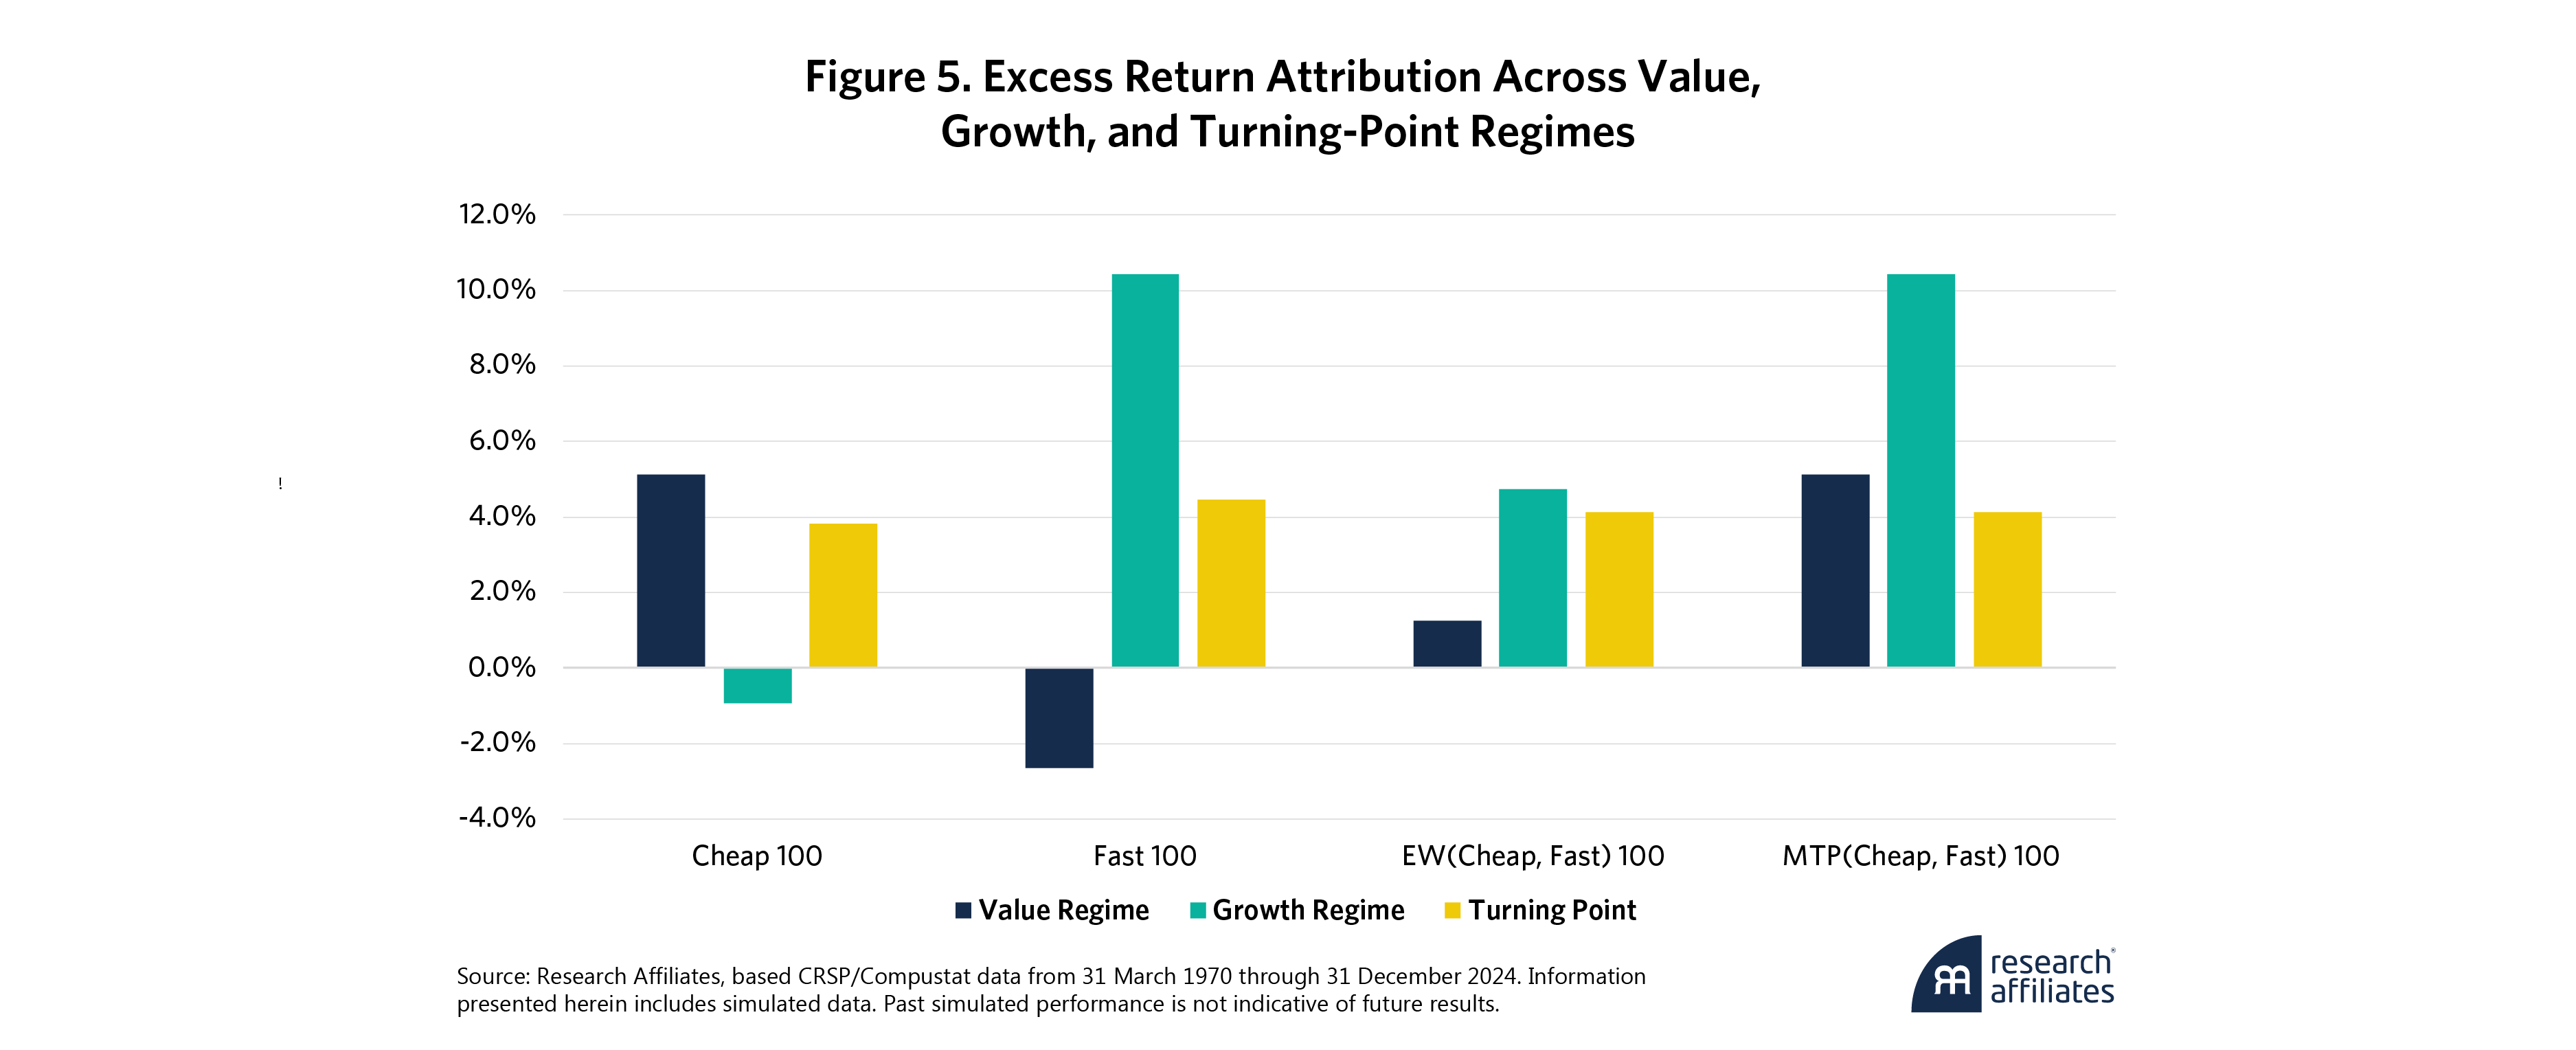
To examine the excess returns of value, growth, and combined portfolios during differing market environments, we attribute returns across value, growth, and turning-point regimes as measured by the MTP signal.
Figure 5 displays attribution between the Cheap 100 and Fast 100 portfolios across regimes. As expected, during value regimes, the Cheap 100 provided positive excess returns while the Fast 100 provided negative excess returns, and vice versa during growth regimes.
Exploiting this negative correlation between the value and growth portfolios, the equal-weighted combination portfolio added value in all three regimes. And the MTP combination, by switching between value and growth at turning points, added more in both value and growth regimes.
End Notes
1. For details, see FTSE Russell “FTSE Global Style Index Series v1.9” (July 2025); MSCI MSCI, “Global Investable Market Value And Growth Index Methodology” (May 2023); and S&P Dow Jones Indices, “US Style Indices Methodology” (June 2025).
2. In practice, both value and growth scores would combine multiple measures of each.
3. All data are from the CRSP/Compustat merged database, the standard source in academic finance for its breadth and consistency.
References
Arnott, R., C. Brightman, C. R. Harvey, Q. Nguyen, and O. Shakernia. 2025. “Fundamental Growth.” SSRN Working Paper, Research Affiliates.
Arnott, R. D., V. Kalesnik, and J. T. Linnainmaa. 2021. “Factor Momentum.” Review of Financial Studies 36(8): 3034–3070.
Asness, C. S., J. A. Friedman, R. J. Krail, and J. M. Liew. 2000. “Style Timing: Value versus Growth.” Journal of Portfolio Management 26(3): 50–60.
Baker, M., and J. Wurgler. 2006. “Investor Sentiment and the Cross-Section of Stock Returns.” Journal of Finance 61(4): 1645–1680.
Barberis, N., and A. Shleifer. 2003. “Style Investing.” Journal of Financial Economics 68(2): 161–199.
Carhart, Mark M. 1997. “On Persistence in Mutual Fund Performance.” The Journal of Finance 52(1): 57–82.
Fama, E. F., and K. R. French. 1993. “Common Risk Factors in the Returns on Stocks and Bonds.” Journal of Financial Economics 33(1): 3–56.
Goulding, C. L., C. R. Harvey, and M. G. Mazzoleni. 2023. “Momentum Turning Points.” Journal of Financial Economics 149(3): 378–406.
Lakonishok, J., A. Shleifer, and R. W. Vishny. 1994. “Contrarian Investment, Extrapolation, and Risk.” Journal of Finance 49(5): 1541–1578.
Rosenberg, B., K. Reid, and R. Lanstein. 1985. “Persuasive Evidence of Market Inefficiency.” Journal of Portfolio Management 11(3): 9–16.
