Expanding the commodity universe beyond the traditional index constituents can substantially improve risk-adjusted returns for both long-only and long-short factor portfolio constructions.
These improvements can be attributed to the higher roll yields and liquidity premia offered by the additional commodities as well as diversification returns at the portfolio level.
For practical implementation, investors should examine which commodities to include in their portfolio against capacity and tradability requirements based on expected portfolio size and apply trading constraints.
For good reasons, many investors have a love-hate relationship with commodity investments. Operationally, the annoying K-1 form complicates tax filing, although thankfully the industry has started to launch “no K-1” funds.1 However, for meaningful returns, most investors would be happy to deal with the inconvenience of the K-1.
Create your free account or log in to keep reading.
Register or Log in
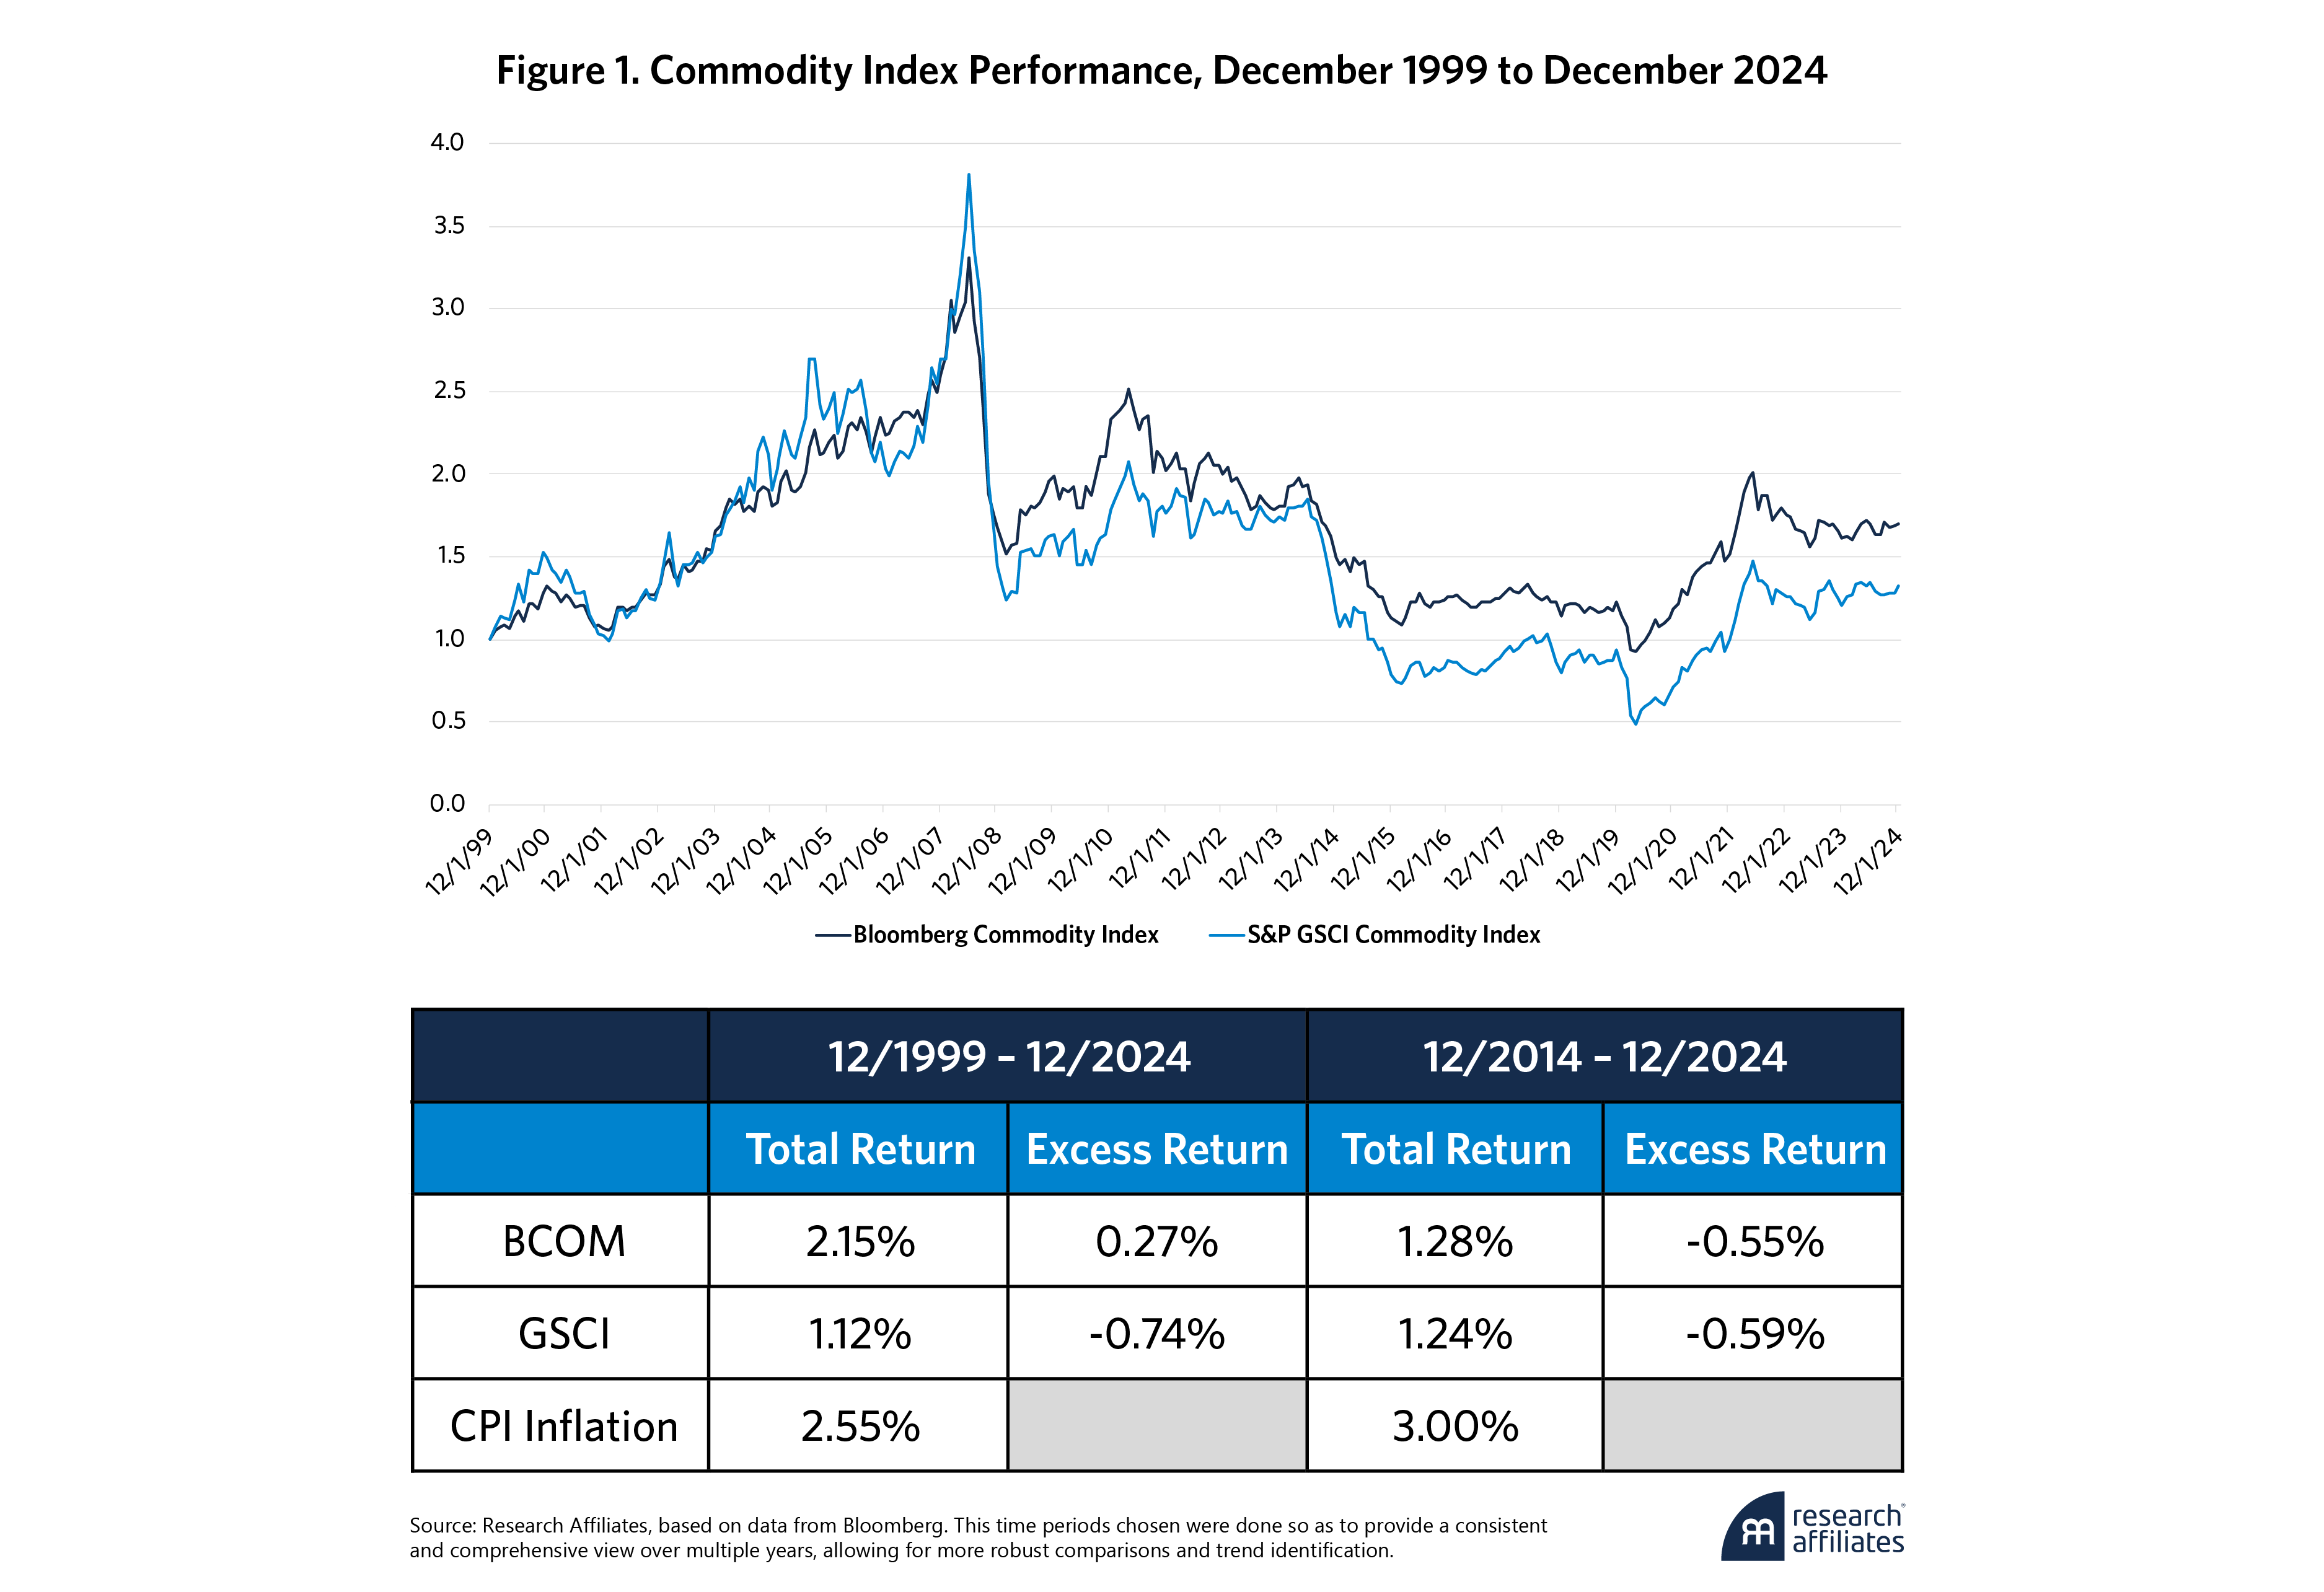
Unfortunately, those returns haven’t materialized. From the start of the century through year-end 2024, the two most popular commodities-tracking indices, the Bloomberg Commodity Index (BCOM) and the S&P GSCI Index (GSCI), yielded minuscule 2.15% and 1.12% annualized returns, respectively, as Figure 1 shows. Most of those returns came from cash collateral (total return) and not the commodity futures investments themselves (excess return). Neither index has kept up with CPI inflation, and since they both maintain volatilities in the mid-to-upper teens, their risk-adjusted returns have been paltry. The last decade has not been any better.
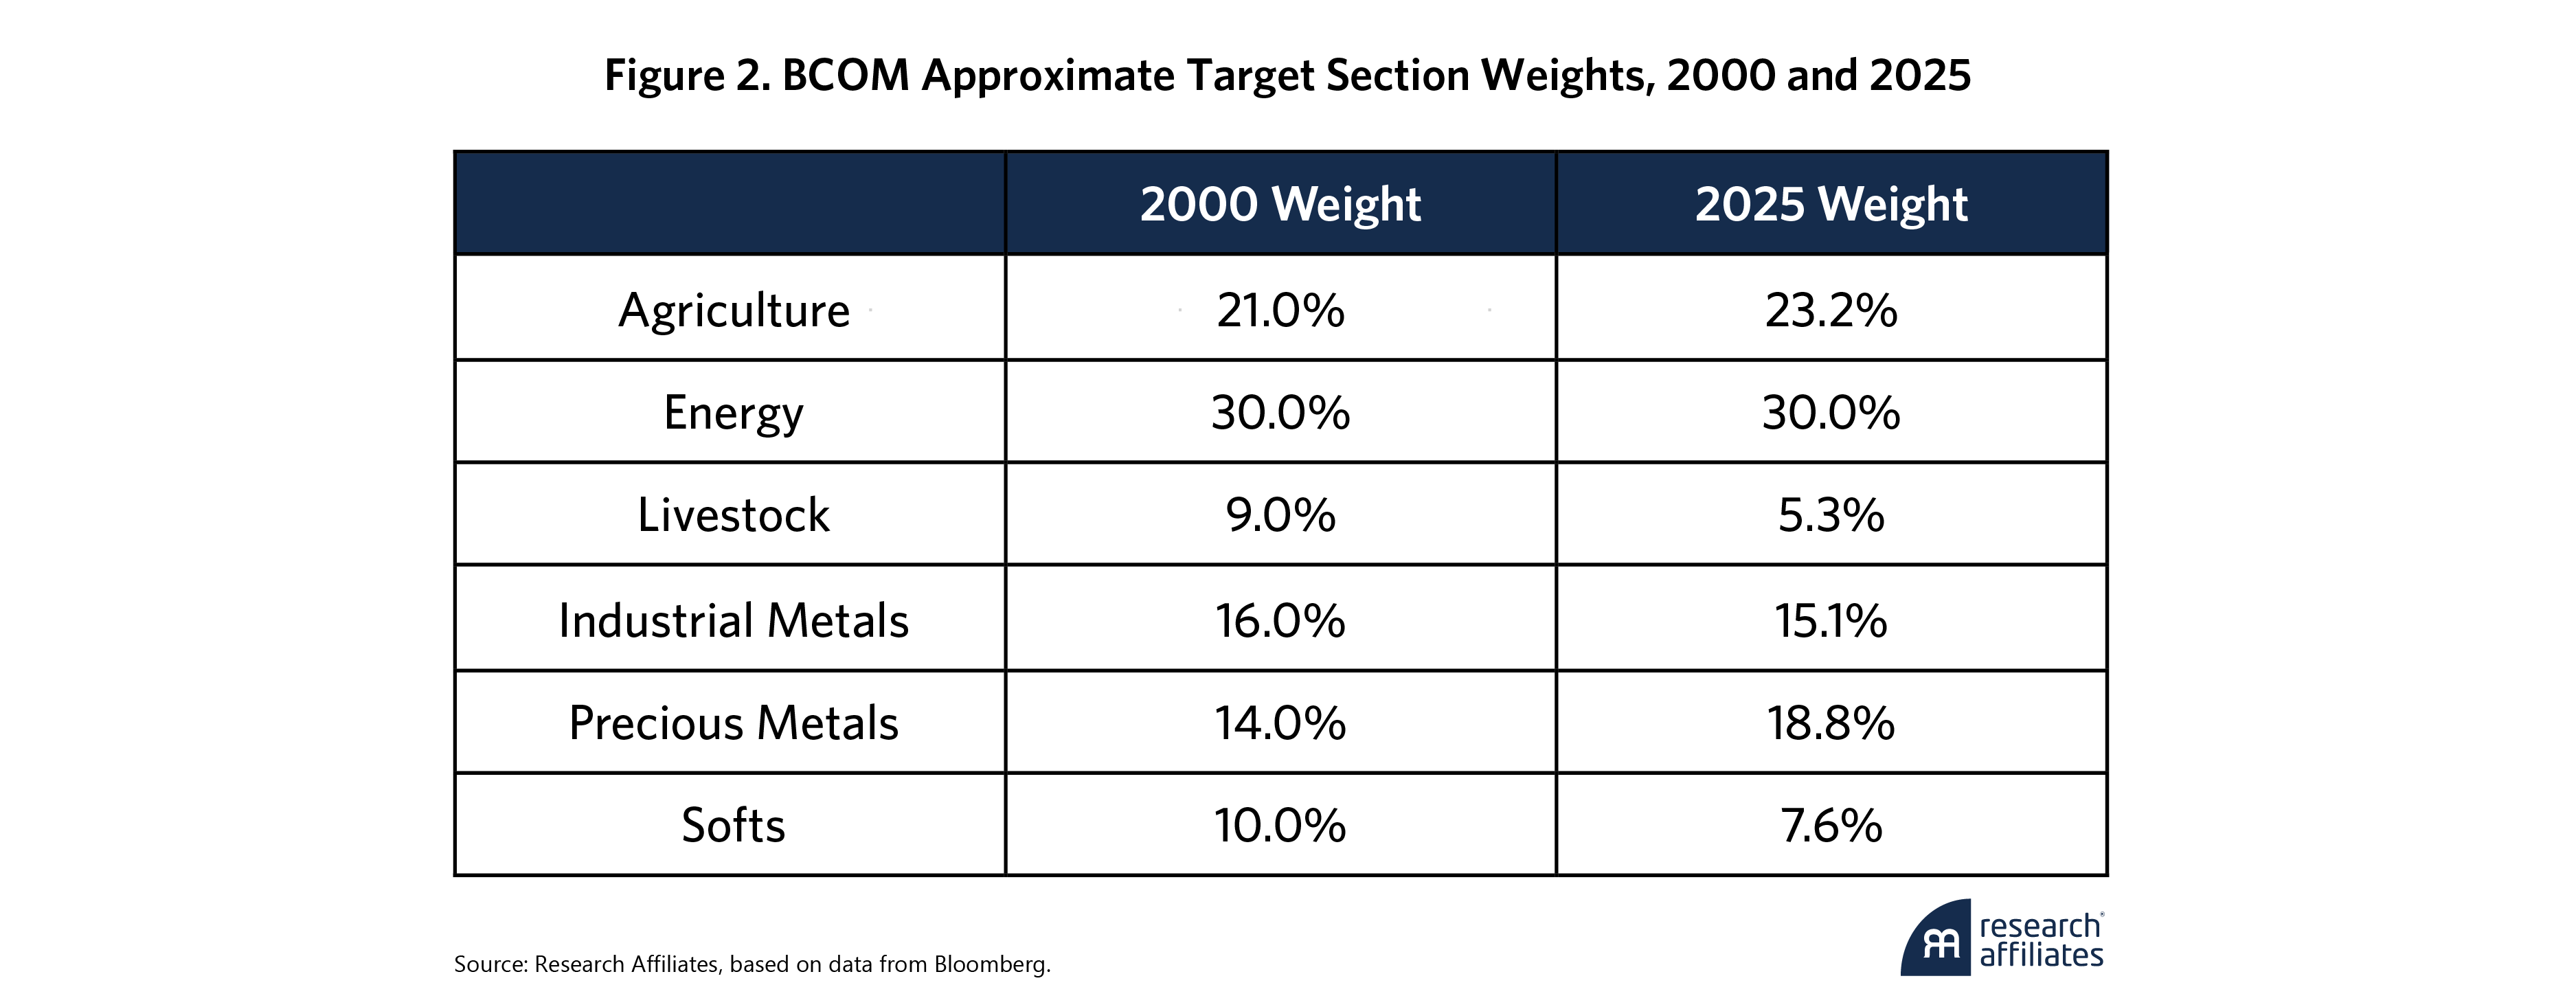
Not only has their performance underwhelmed, these particular indices have hardly evolved over the last 25 years.2 Take the BCOM. Although the index has added a few instruments since 2000, Lead and Low Sulphur Gasoil, for example, Figure 2 shows its overall sector weights, by construction, have barely budged from those a quarter-century ago.
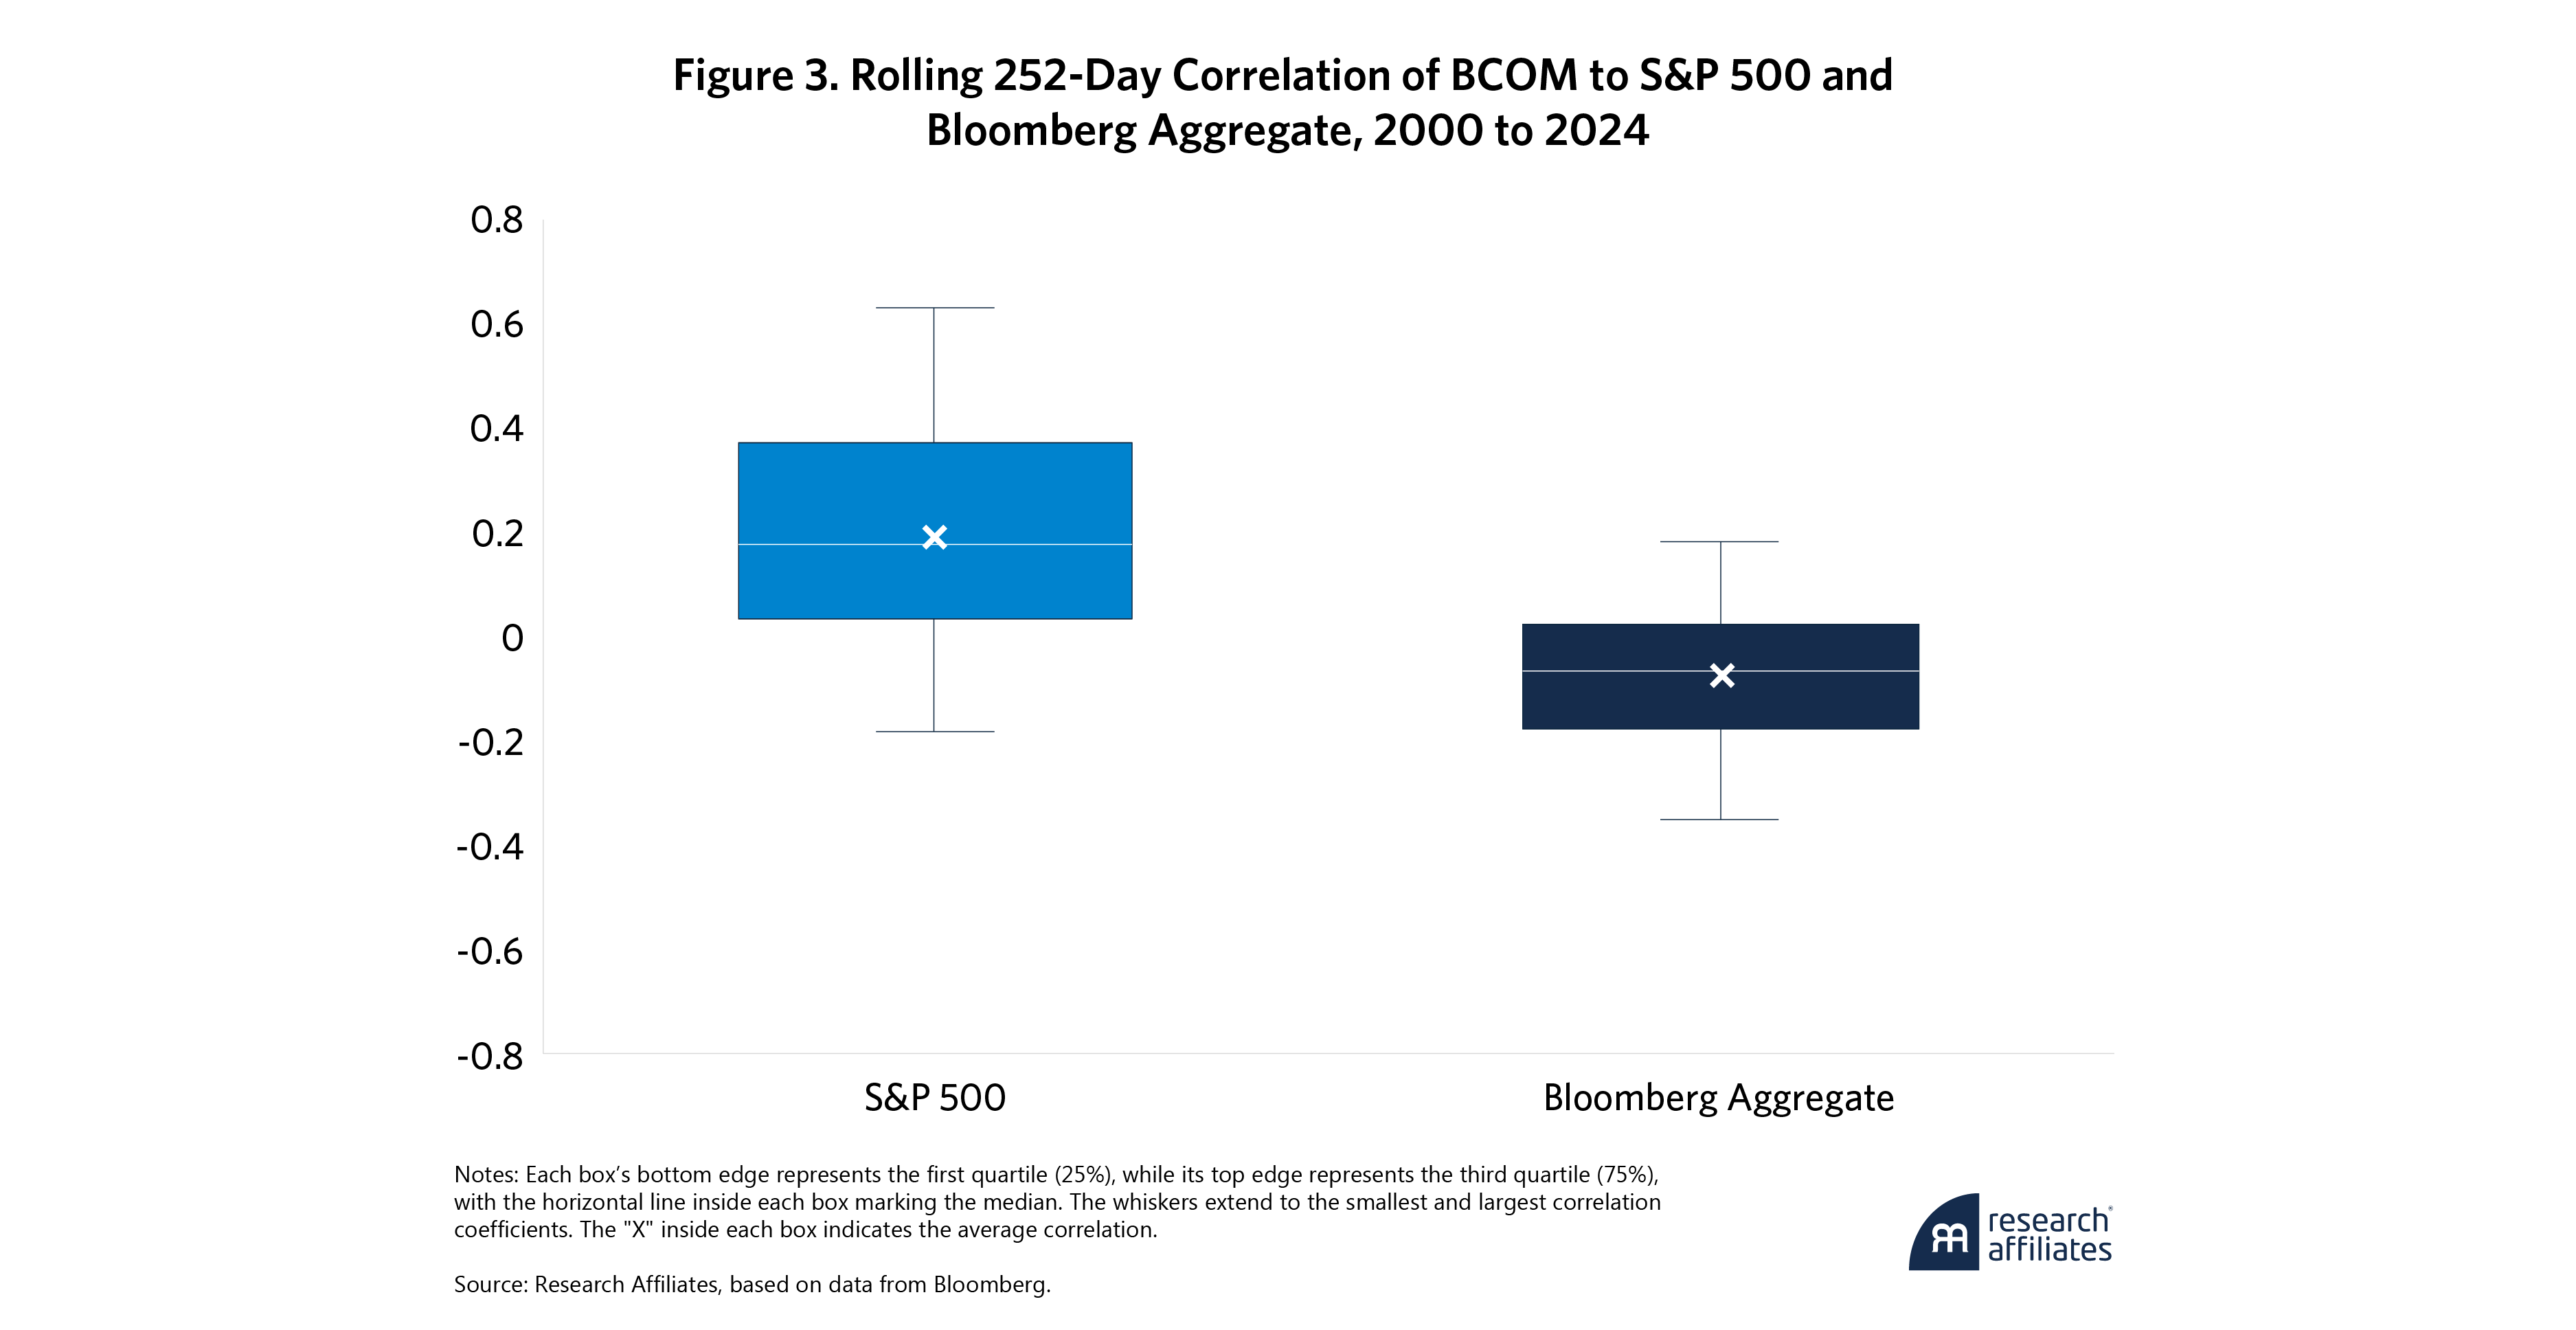
To be fair, although commodity indices haven’t delivered the performance one would have liked over these 25 years, they have provided diversification to stocks and bonds. Look no further than 2022, when the S&P 500 and Bloomberg Aggregate fell 18% and 13%, respectively, while the BCOM rose 16% and the GSCI was up 26% due to its higher allocation to Oil. As Figure 3 shows, relatively low rolling annual correlations between commodities and both stocks and bonds reflect the diversification coming from commodities.
Given the mixed reviews for commodity investing, in this article, we address a simple question: Can we do better by expanding the universe of commodities available for investment, paying particular attention to the investability of the expanded universe? While many hedge funds and commodity trading advisors (CTAs) recognize the benefits such an expanded universe brings, most of the assets aren’t currently known to the broader mass of investors.
The rest of this paper is laid out as follows: The first section describes the data, the second analyzes the tradability of the expanded universe, the third looks at adding these new commodities to a long-only portfolio, the fourth examines long-short factor portfolios, the fifth provides intuition into the sources of the benefits, and then we conclude.
1. Data Overview
As we look to grow the opportunity set of available commodities, we use the current universe of the BCOM and GSCI indices to evaluate the pros and cons of the expanded universe. For the purpose of this article, we evaluate all commodities based on the nearest-to-mature contract.3
Figure 4 displays the BCOM and GSCI universe (hereafter referred to as the liquid universe), as well as the expanded universe in gray (hereafter referred to the PLUS universe). The 10 additional commodities not currently part of the BCOM or GSCI universe include Canola, Milling Wheat, Rapeseed, UK Natural Gas,4 Tin, Palladium, Platinum, Robusta Coffee, Frozen Concentrated Orange Juice (FCOJ), and White Sugar.
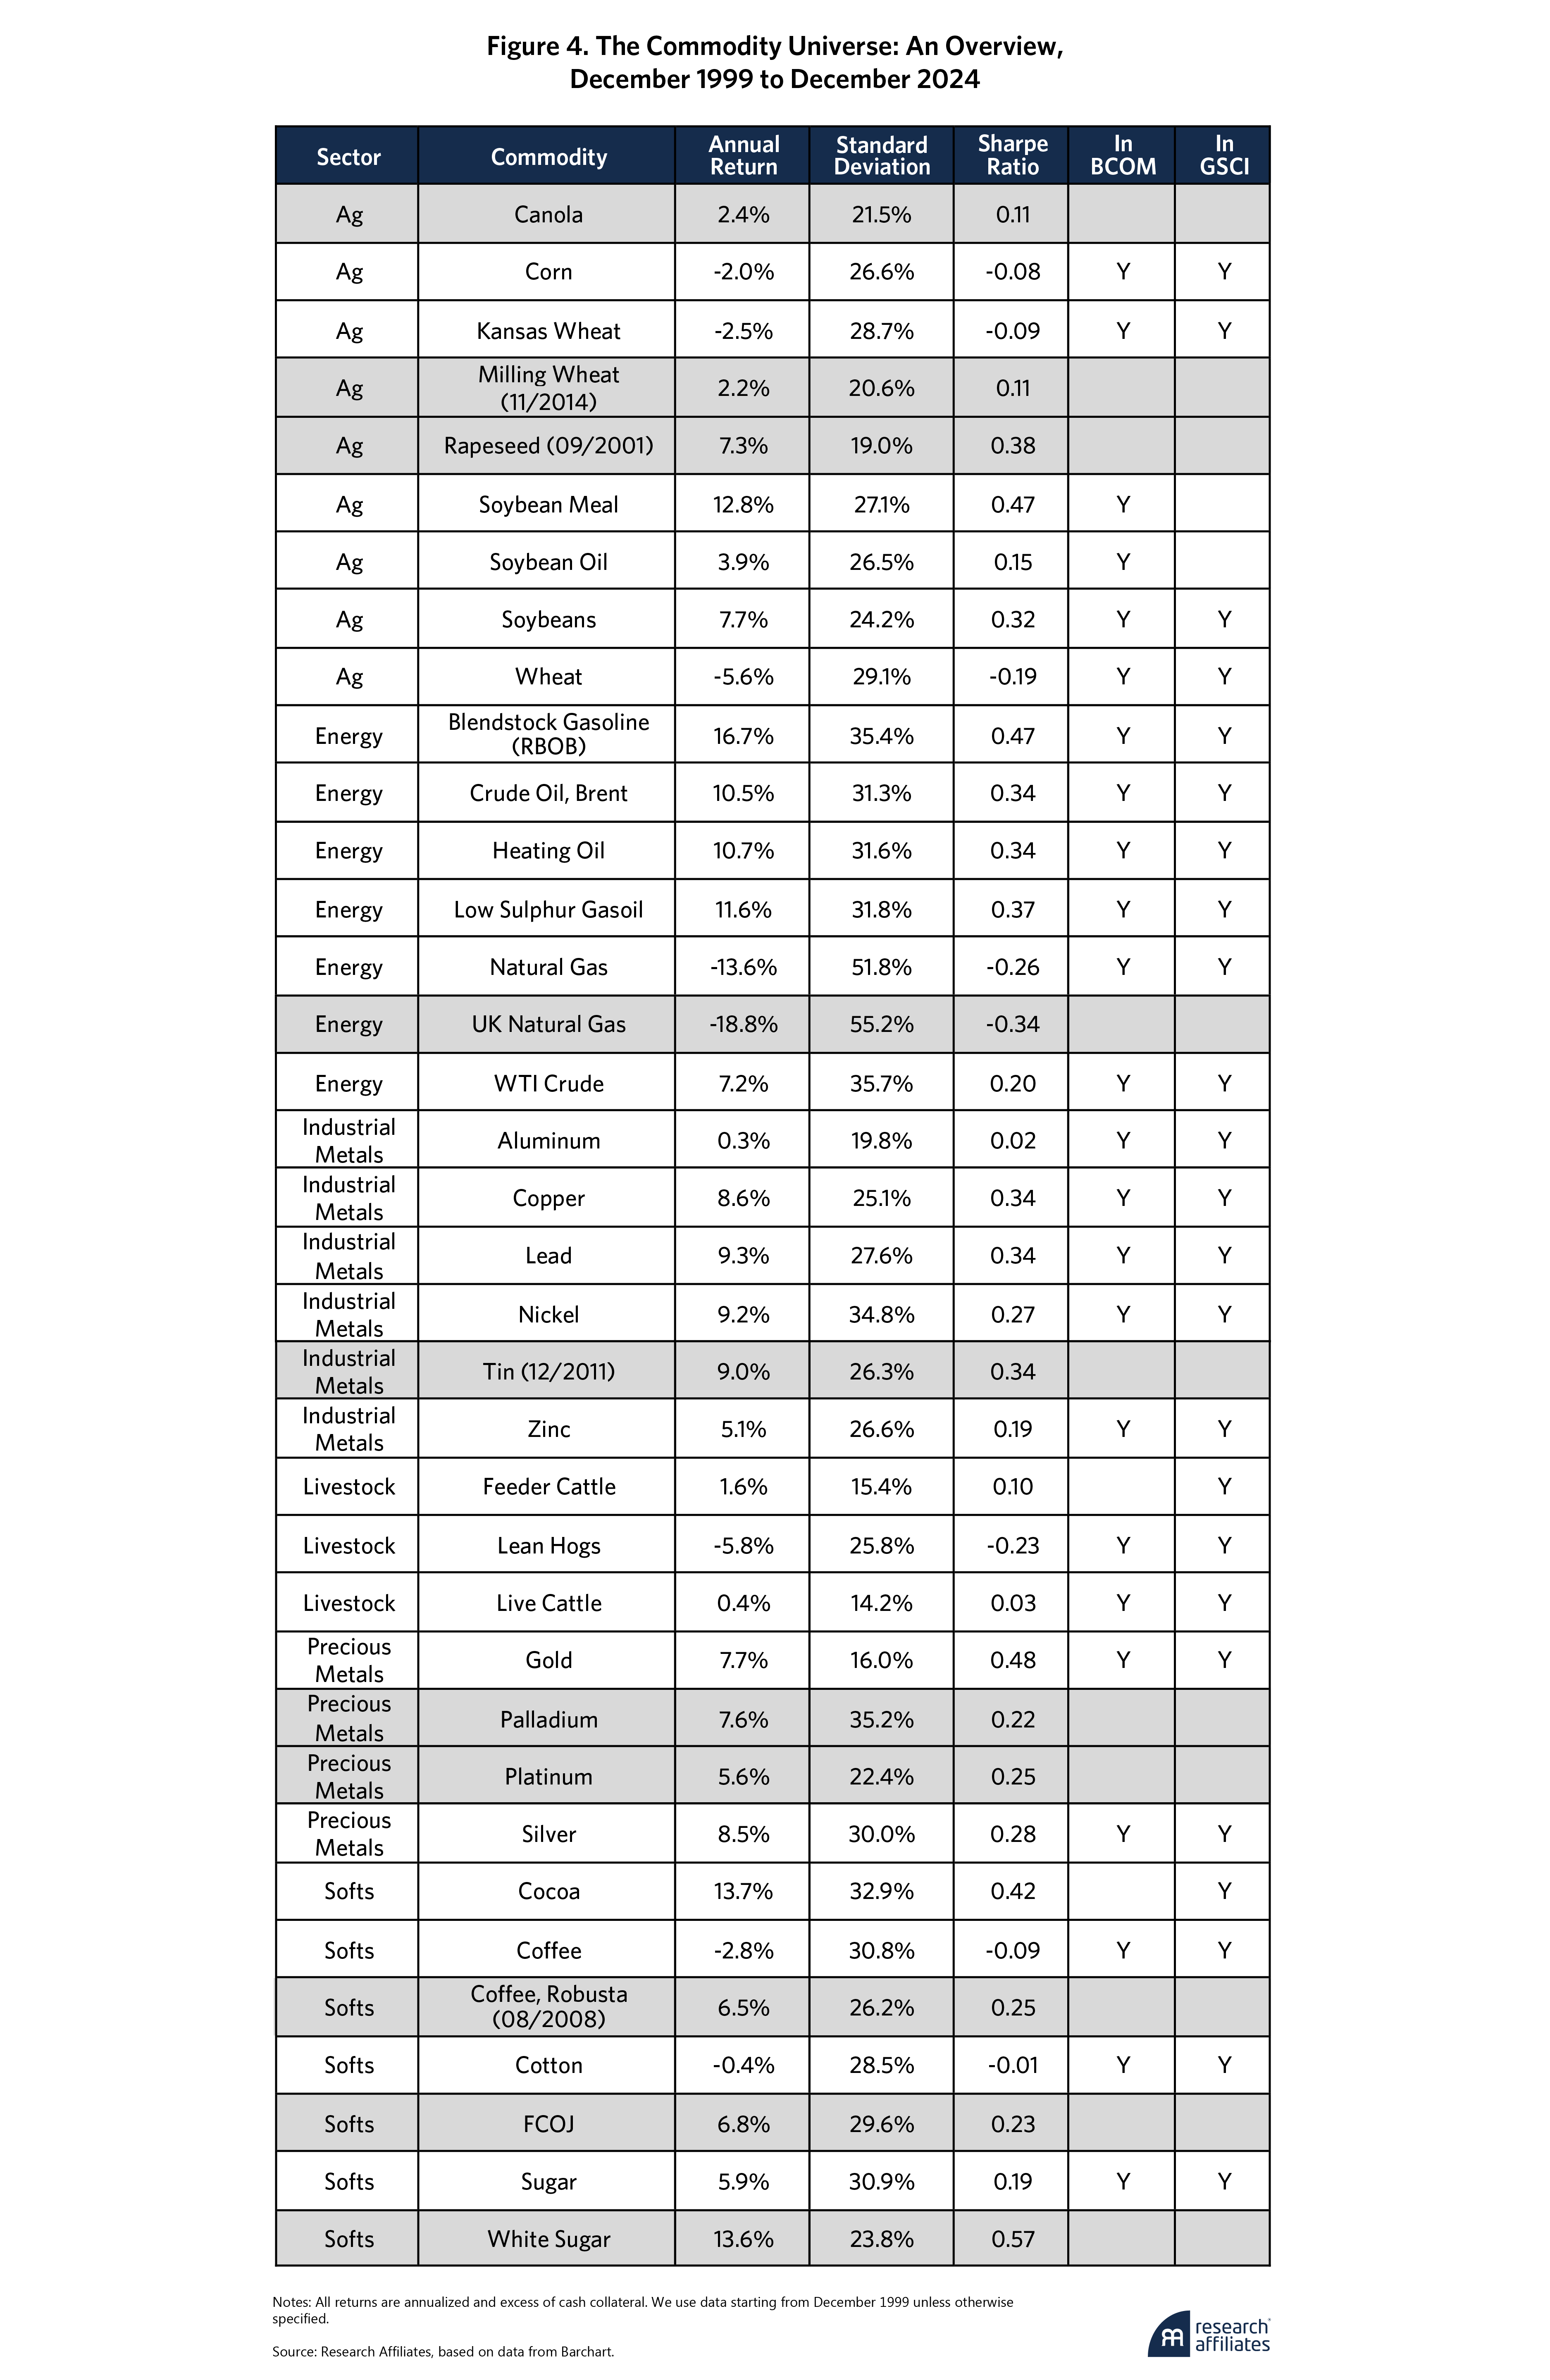
While our augmented list of commodities is by no means exhaustive, by adding 10 to the initial set of 26, we’ve already expanded the universe by close to 40%, which is more than sufficient for this study.
In choosing the commodities to add to our expanded universe, we focus on tradability and liquidity, which we discuss later, as well as the exchange on which the assets trade. We avoid exchanges that are hard for the average investor to access, including onshore Chinese commodities.
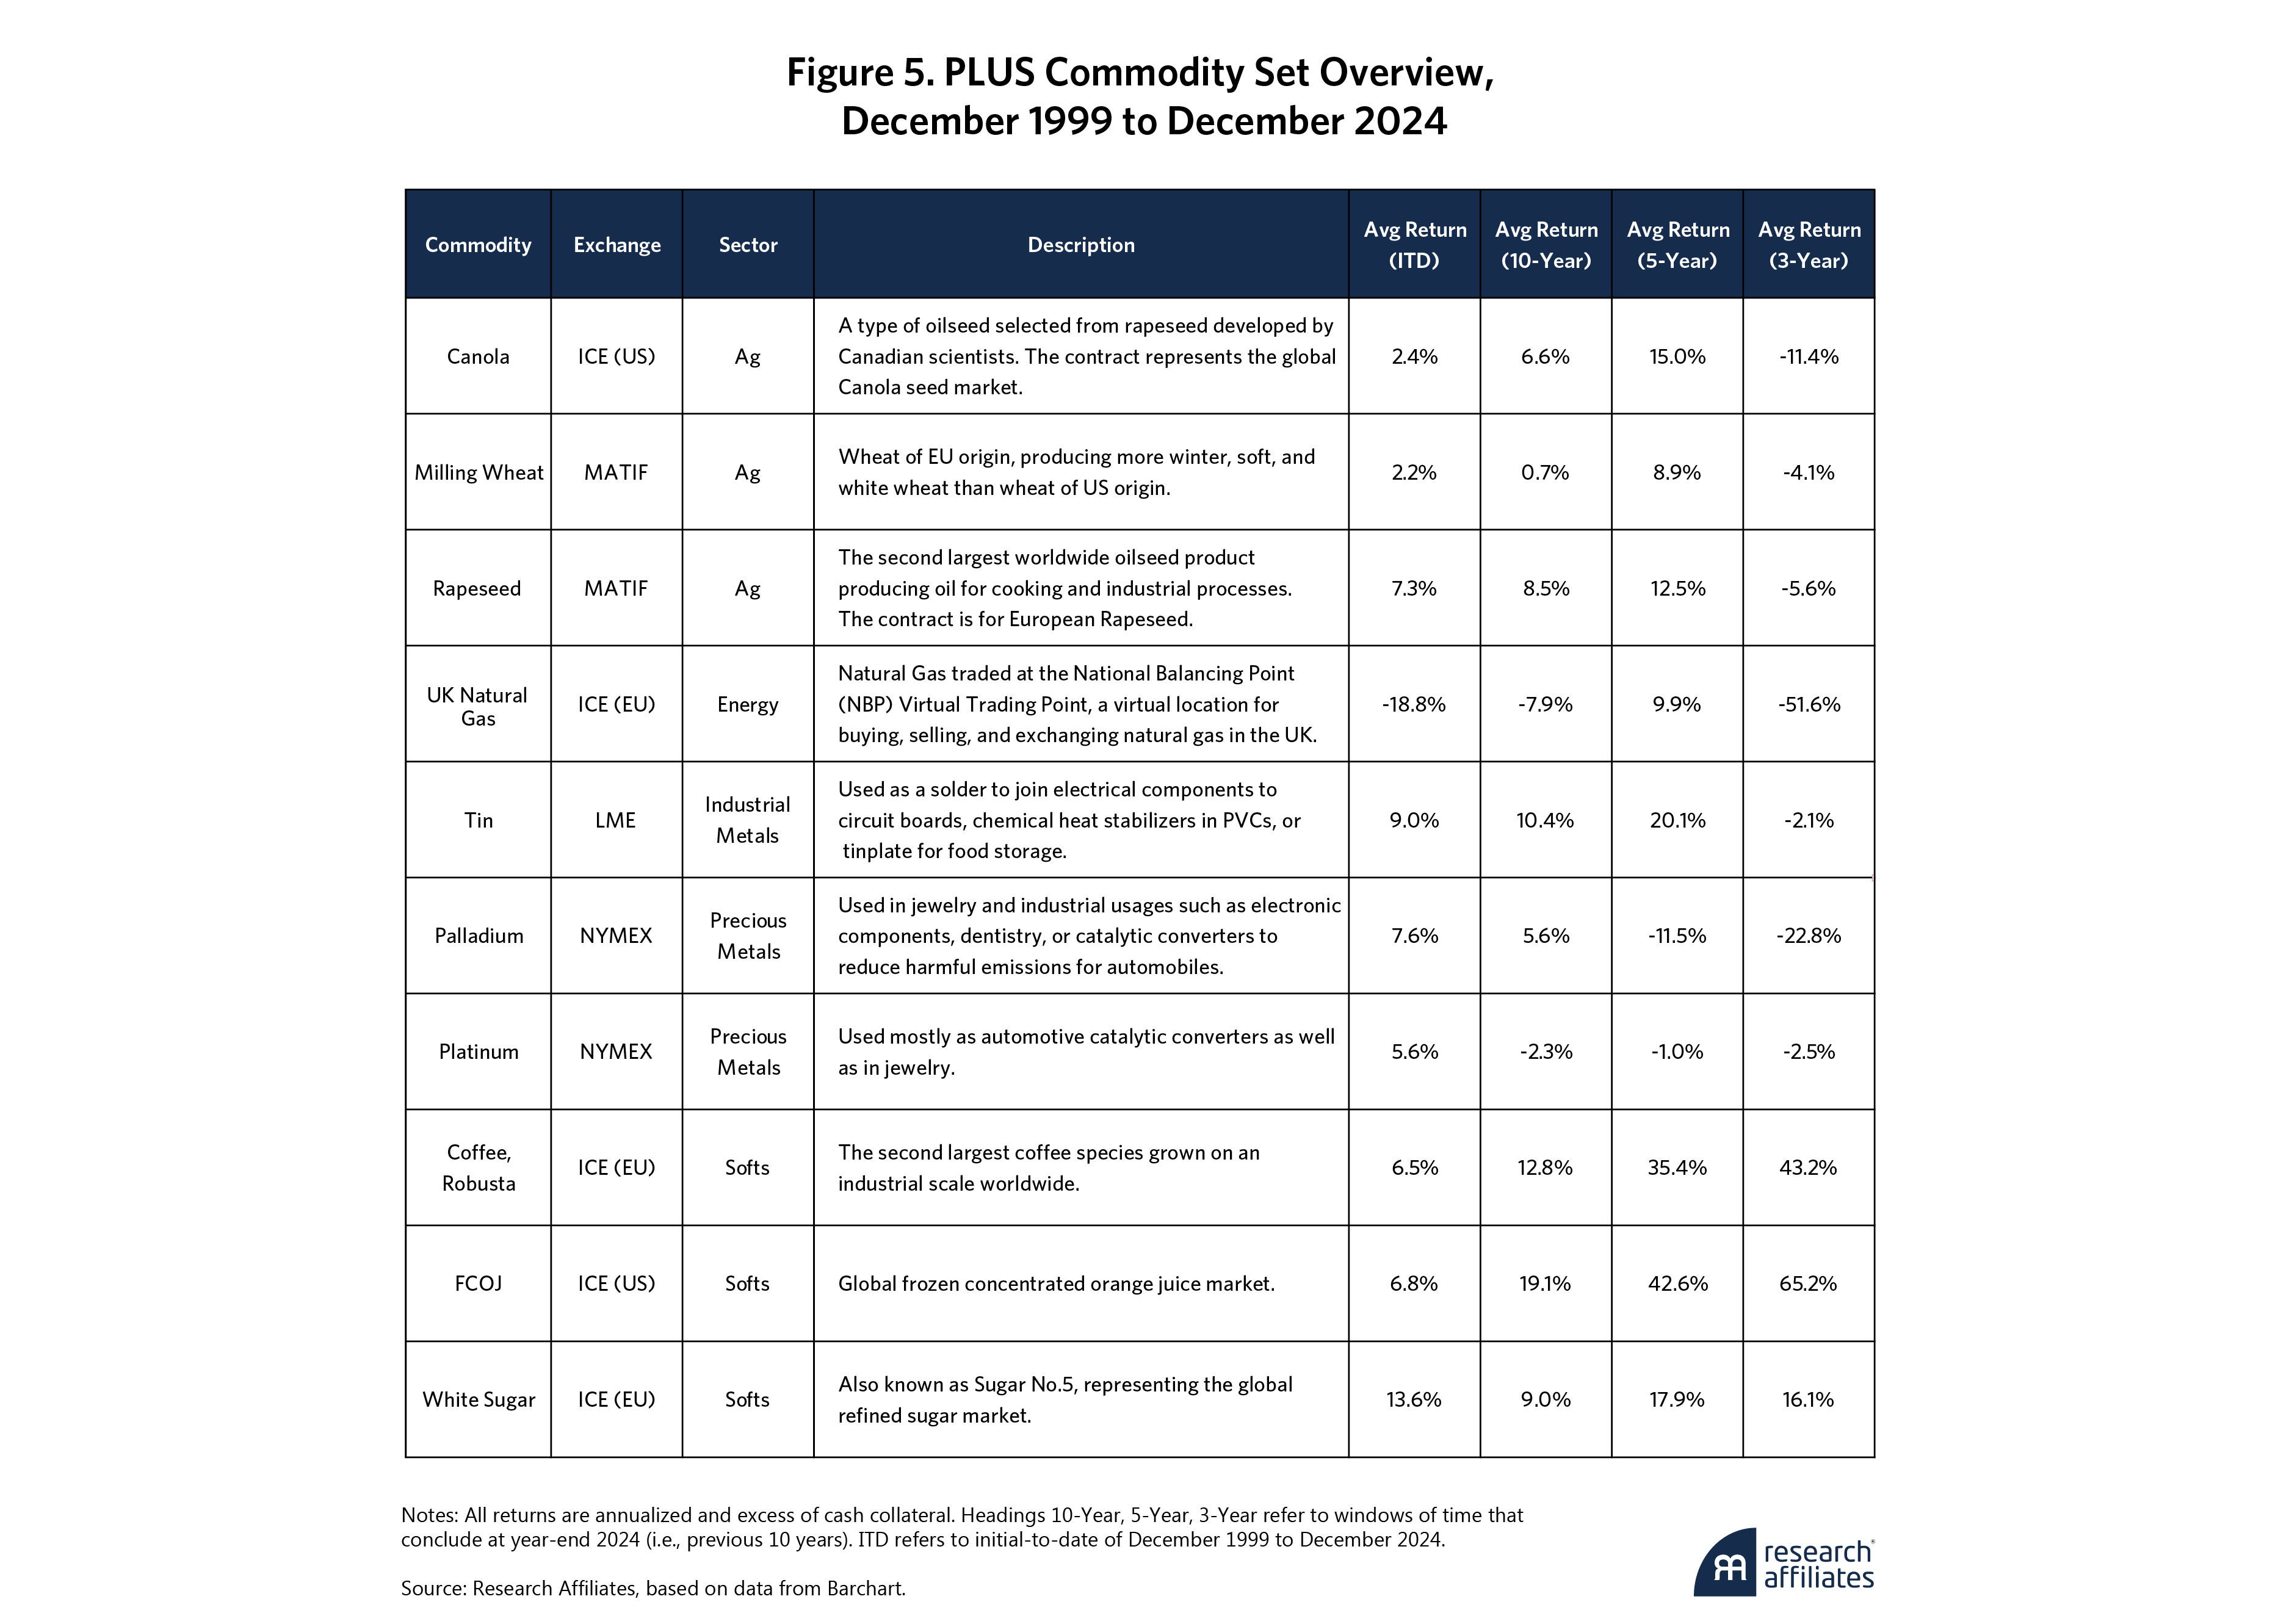
It is also important to recognize the volatility inherent in individual commodities. Therefore, we do not recommend investing in individual PLUS commodities or, for that matter, individual liquid commodities. For example, Figure 5 shows Natural Gas and UK Natural Gas have annual returns of –13% and –18%, respectively, over the past quarter century, while Cocoa and White Sugar have returned more than 13% each. On a forward basis, we can’t be sure which will be the next Cocoa or White Sugar, so with commodities, diversification is our friend.
2. PLUS Commodities: Capacity and Tradability
Two important considerations in expanding our commodity universe are the capacity and the tradability of those additional instruments. Capacity relates to investor needs and whether there is sufficient volume, on average, over long periods of time, relative to the investor’s expected portfolio size. Tradability refers to if open contracts are actively changing hands in the market over relatively short periods.
Two important considerations in expanding our commodity universe are the capacity and the tradability of those additional instruments.
”Defined as the average daily dollar volume over the past three years, capacity provides a direct measure of how much can be allocated to each instrument. To avoid setting capacity constraints that could absorb the entire capacity of the asset, we first apply an 80% haircut (20% cap) in estimating each asset’s capacity requirement for our portfolio.
Once we calculate the capacity requirement for each asset, we convert that dollar amount to the allowable exposure in our portfolio based on the target notional amount of our portfolio and a 50-basis-point minimum exposure amount. Any instrument that cannot handle at least 50 basis points (bps) of exposure we classify as too small to be meaningful.
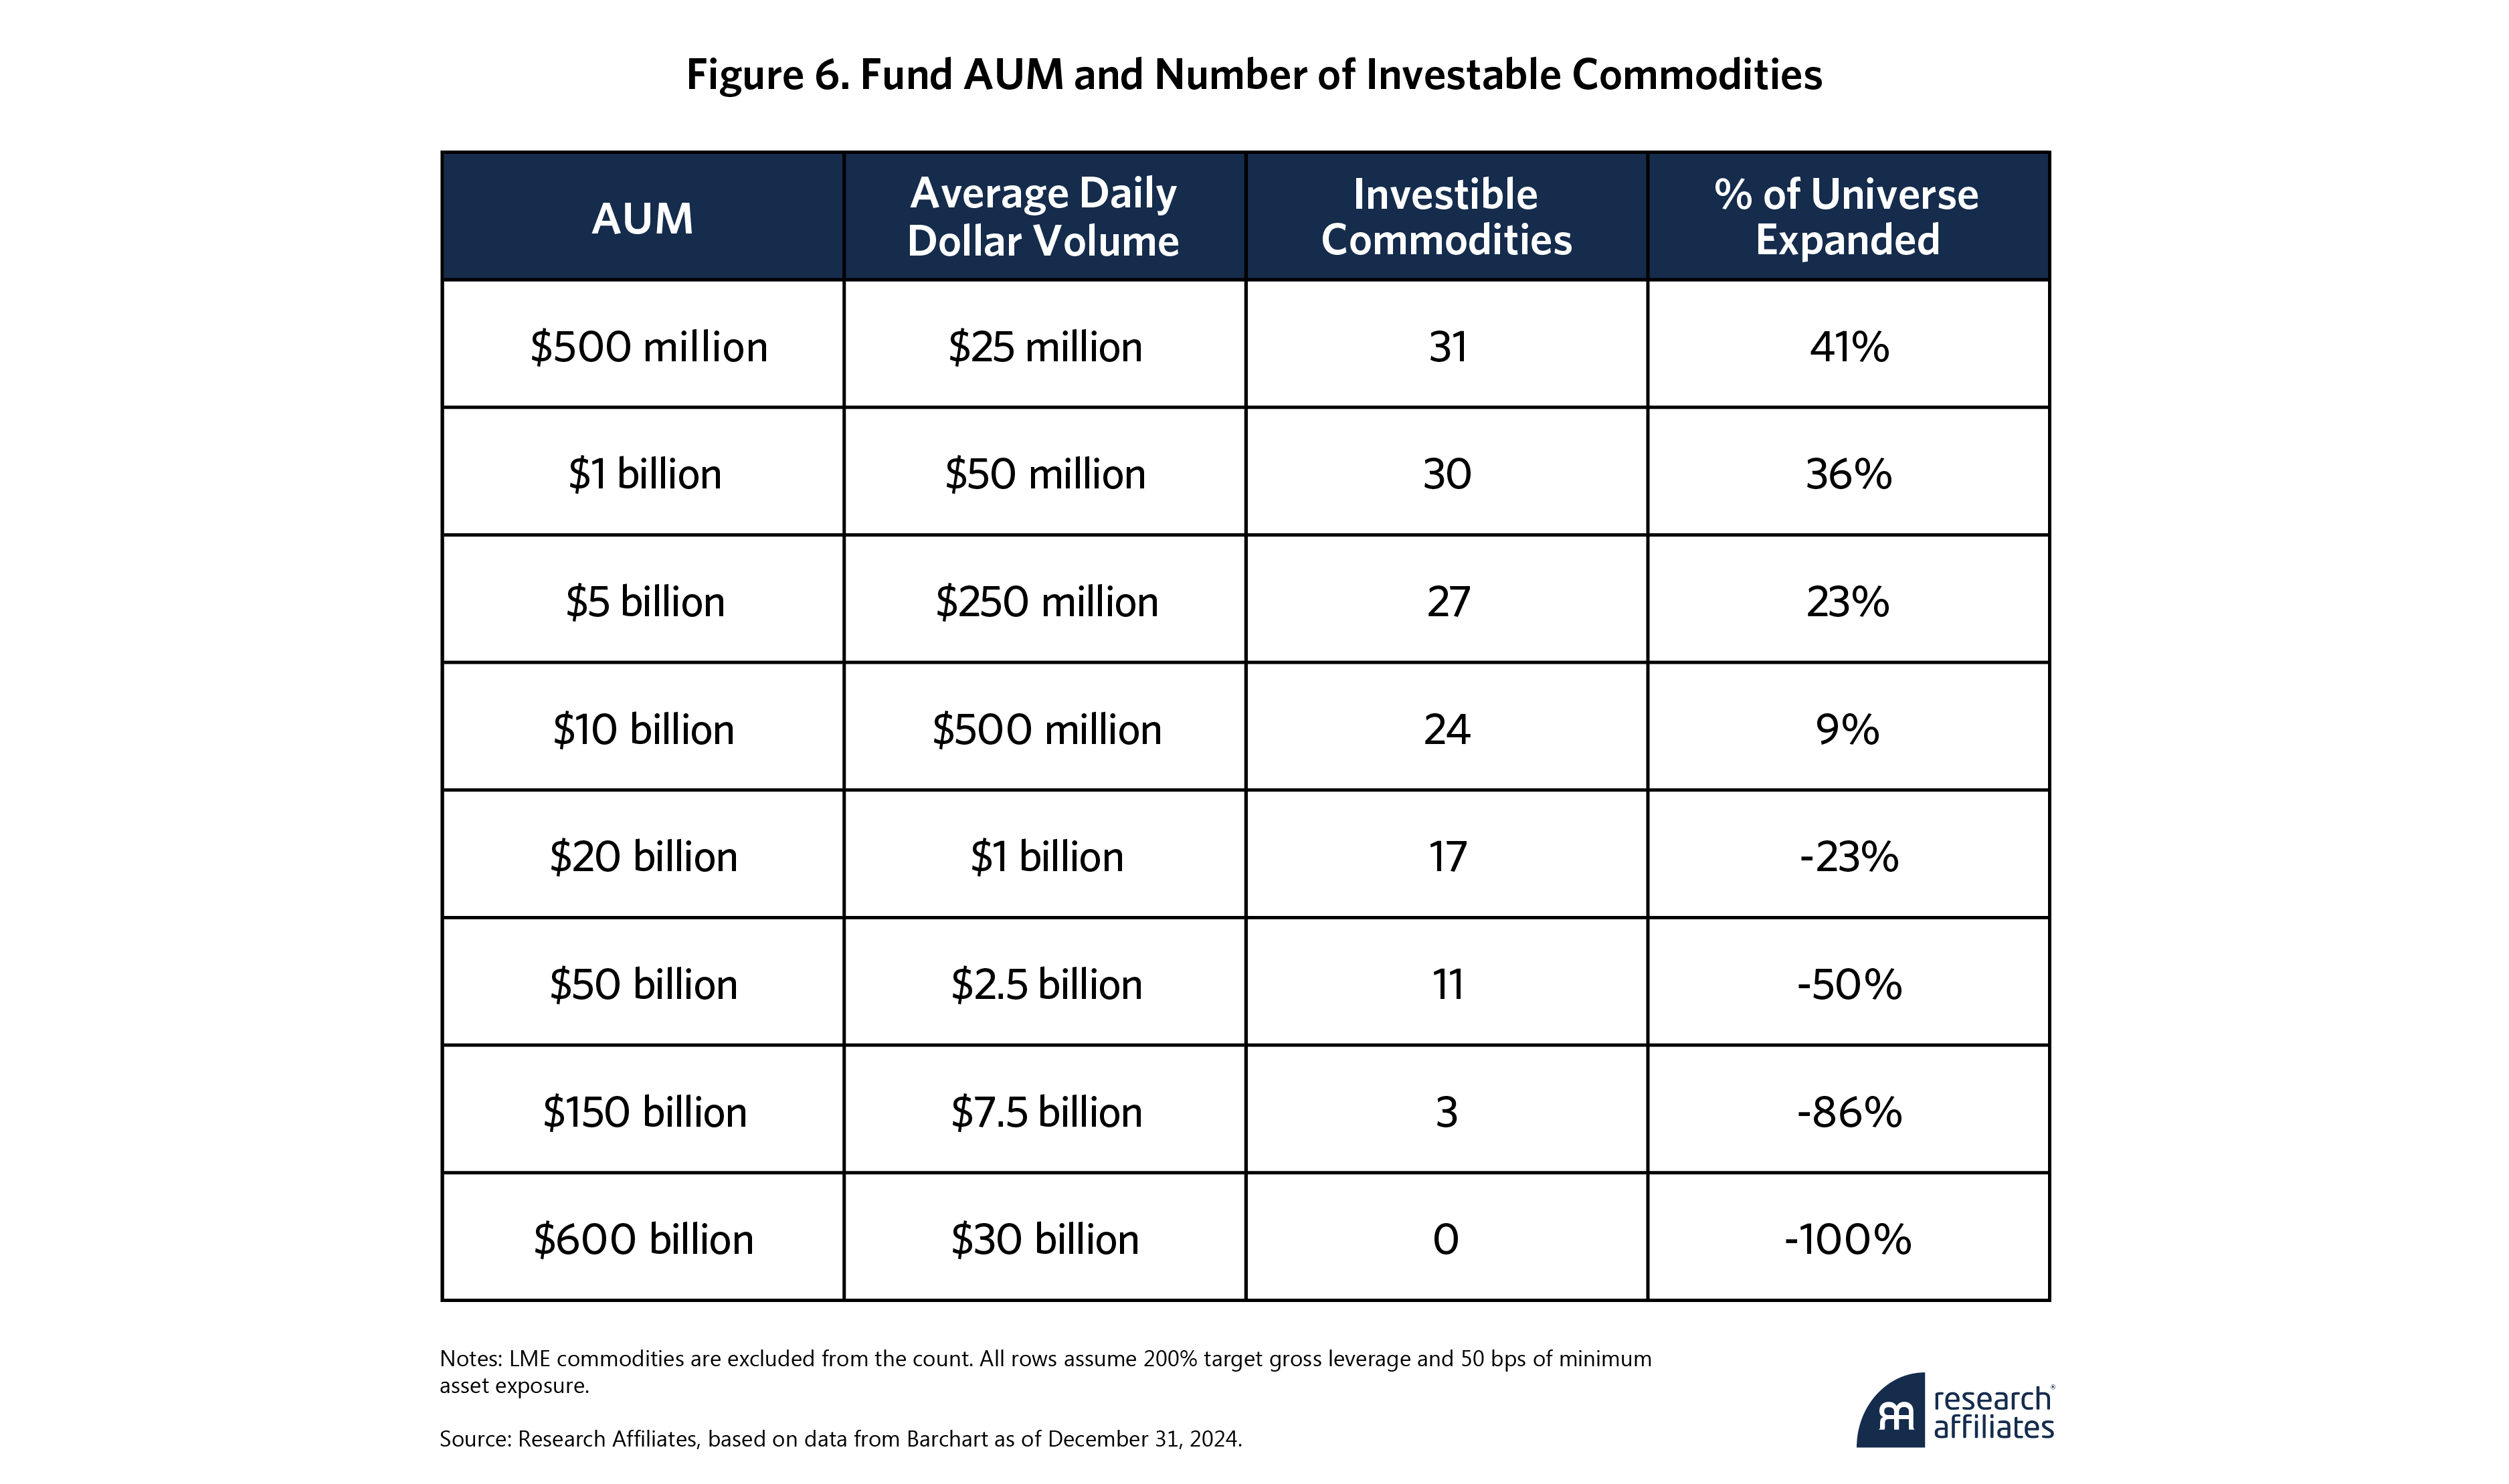
For example, consider a commodity fund with $500 million in allocated capital and a 200% average gross leverage target (i.e., $1-billion total notional amount). An asset with allowable exposure of 50 bps would need a daily dollar capacity requirement of $5 million, or an average dollar daily volume of $25 million.
This capacity requirement constraint implies that the ability to expand the commodity universe depends on the fund's committed capital, gross leverage target, and minimum asset exposure threshold, or, in our example, $500 million, 200%, and 50 bps, respectively. We apply these parameters throughout this paper. As Figure 6 shows, under these starting values, we can expand the universe by 41%, from 22 to 31 assets.5 Further, our analysis suggests that at least one PLUS commodity can be included in the universe for up to a $16-billion fund size, which exceeds the typical assets under management (AUM) of most active commodity funds in the current market.
We assess the tradability liquidity consideration as average daily volume relative to open interest over a relatively short 21-day period, indicating whether the market is sufficiently active, independent of any specific investor needs.
Our tradability criterion requires that instruments consistently maintain tradability above 5% over the past three years. Commodities that fail to meet this threshold would have experienced at least one month over the past three years when less than 5% of open contracts were actively traded. A stale market introduces liquidity risk in the form of difficulty in trading, increased transaction costs, poor execution pricing, or some combination thereof.
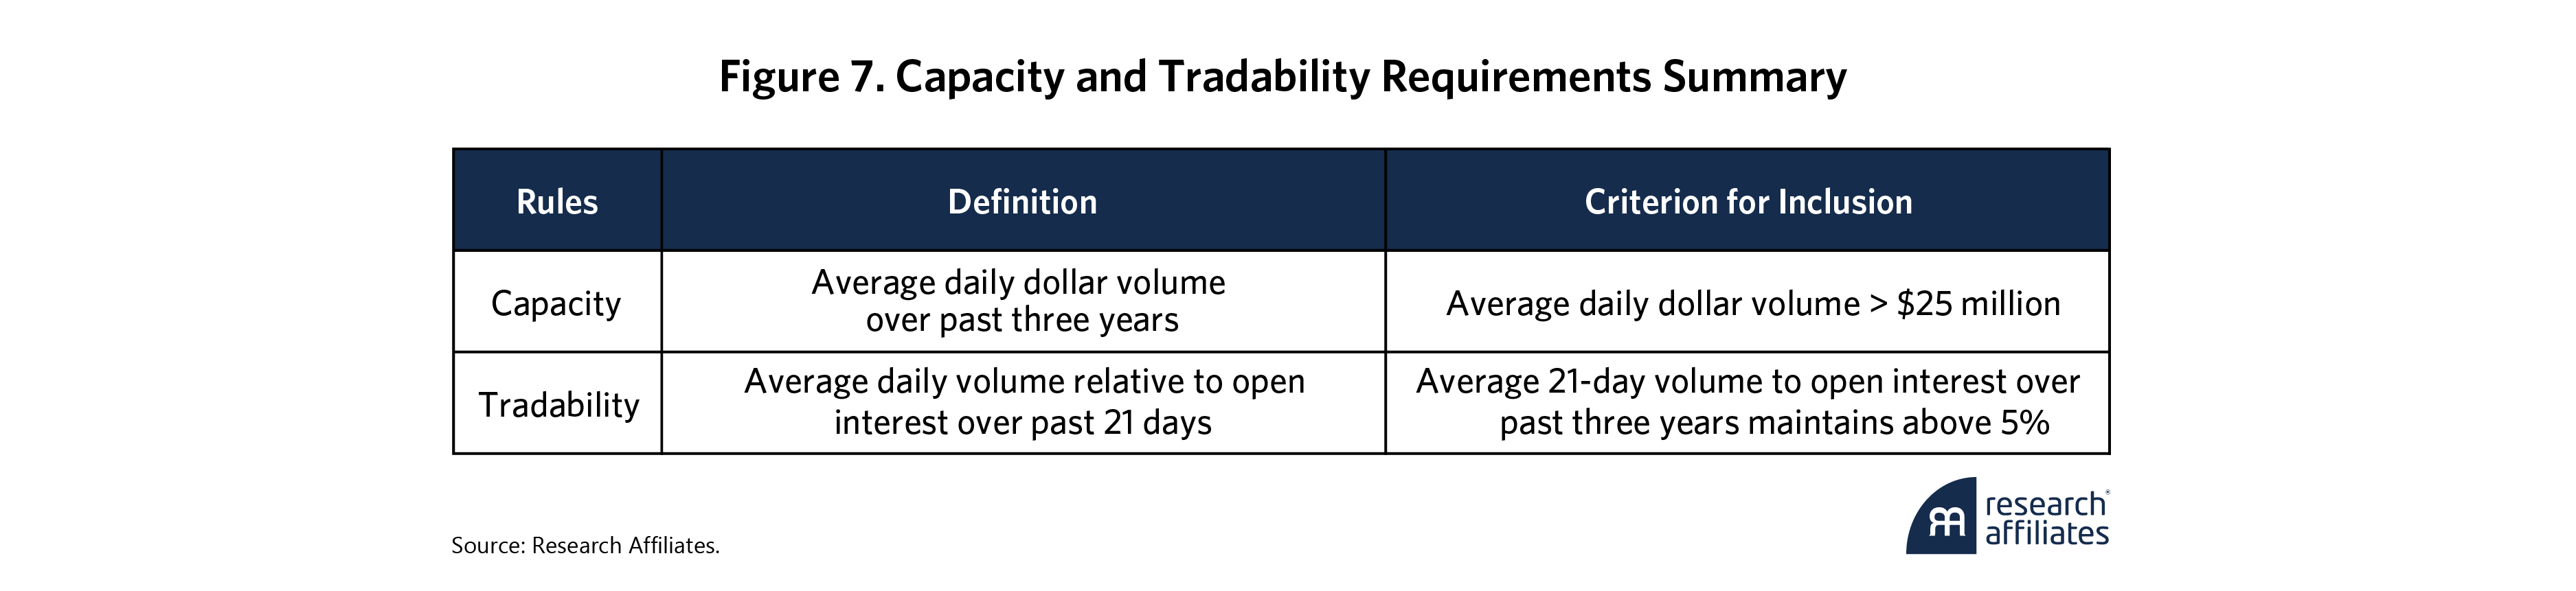
Applying the rules and levels summarized in Figure 7 to examine our commodity universe, with data as of year-end 2024, we unsurprisingly find that liquid universe commodities comfortably meet both the capacity and tradability criteria, reflecting their selection to BCOM and GSCI. While most PLUS commodities exhibit considerably lower capacity and tradability than their liquid universe counterparts, all still satisfy both requirements.6 Our analysis of historical data shows the year when the various PLUS commodities began meeting both trading criteria: Canola, 2007; Milling Wheat, 2014; Rapeseed, 2009; UK Natural Gas, 2007; Palladium, 2007; Platinum, 2005; Robusta Coffee, 2011; FCOJ, 2006; and White Sugar, 2005.
Defining and measuring the best capacity and tradability levels is as much art as it is science. As a check, in Figure 8, we rank the full set of commodities by our capacity metric and compare them to the rank order of the BCOM’s 2025 allocation weights. The Spearman rank-order correlation is statistically significant (p-value < 0.001) at nearly 0.7. That we see significant overlap between the two sets of ranks, with the exception of a few energy commodities, adds further credence to our measure. Quantica Capital (2025) also shows similar results, with fewer than 30 of 69 commodities accounting for 90% of the total portfolio risk for a $5-billion trend fund.
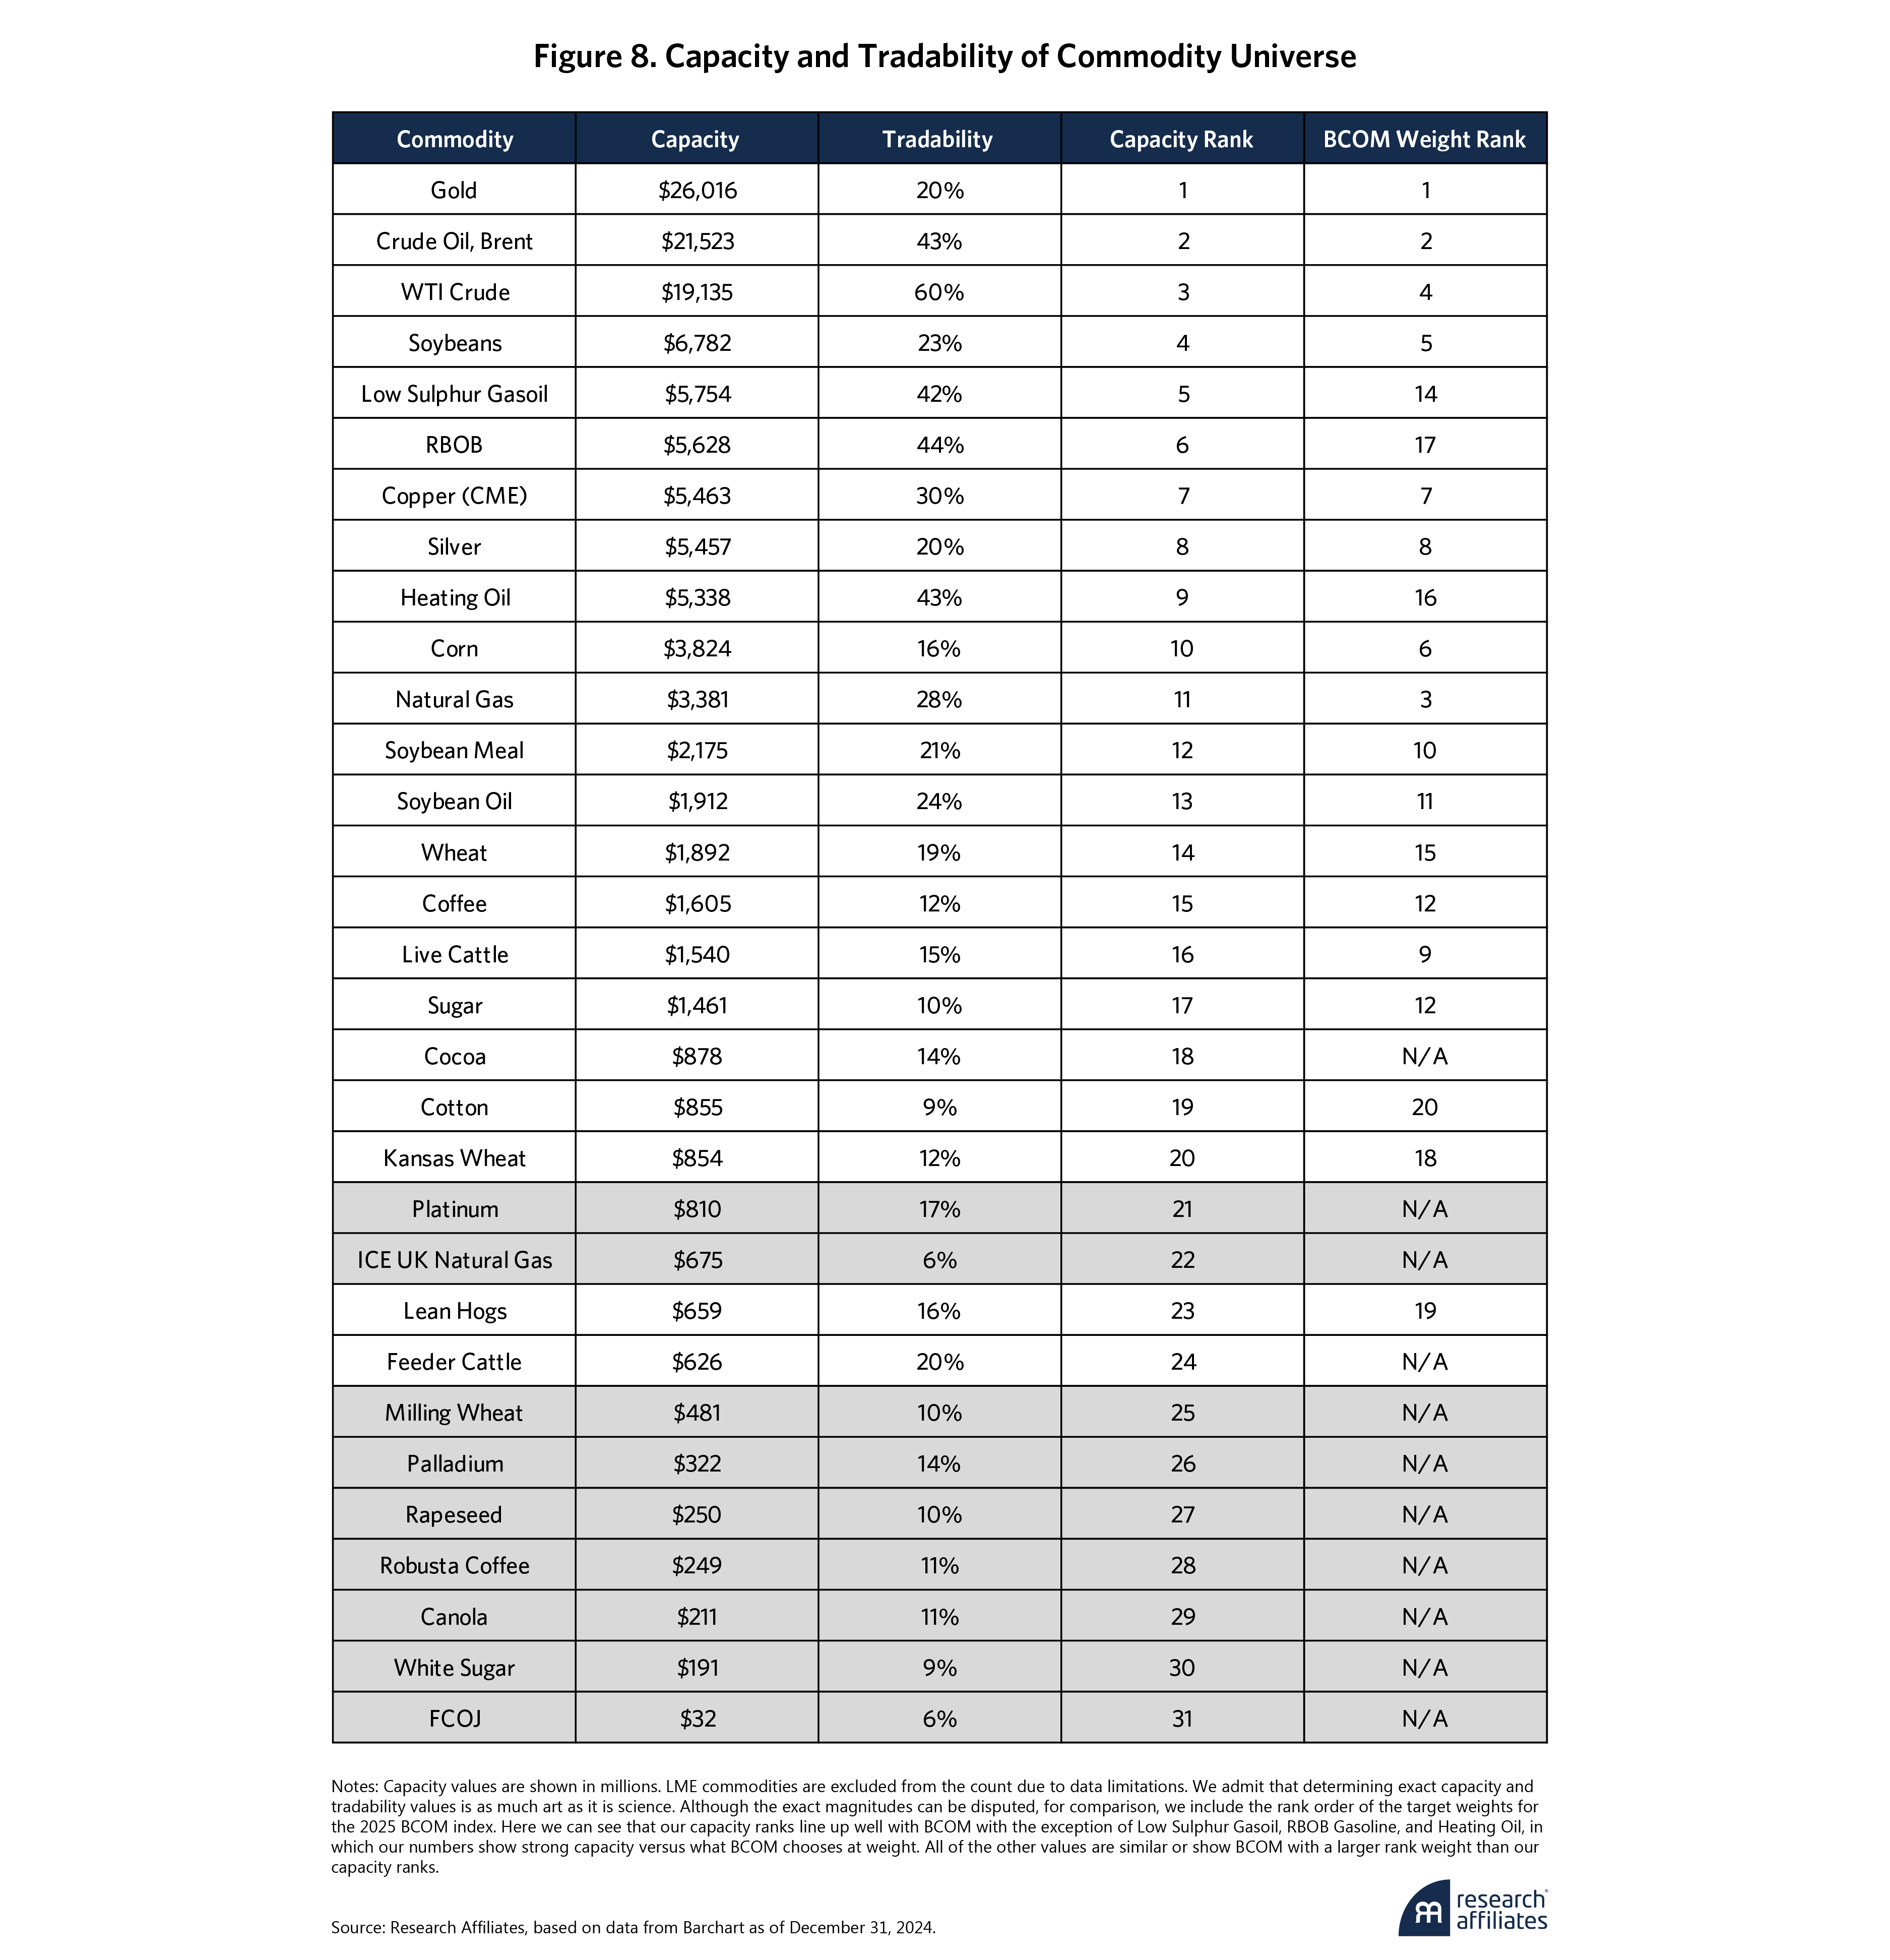
Defining and measuring the best capacity and tradability levels is as much art as it is science.
”Having established that the expanded universe offers adequate capacity and tradability, let’s move on to determine if adding these assets is accretive to portfolio performance.
3. PLUS Commodities in Long-Only Portfolios
We first compare the performance of long-only portfolios constructed from three universes: liquid, PLUS, and combined liquid + PLUS. To ensure comparability, all three portfolios have the same portfolio construction methodology—equal volatility weighted7 rebalancing monthly—as opposed to directly using BCOM or GSCI methodology. This eliminates the differences attributable to specific index creation rules and isolates the performance impact of the PLUS commodities.
Figure 9 shows the results over the past 25 years. The PLUS portfolio exhibits better performance relative to the liquid portfolio, with higher average returns,8 improved Sharpe ratio, reduced maximum drawdown, and less negative skew. The combined portfolio also demonstrates the same improvements compared to the liquid portfolio, though to a lesser extent, since the liquid commodities represent around 75% of the portfolio allocation over time (PLUS commodities are 25% of the total allocation).
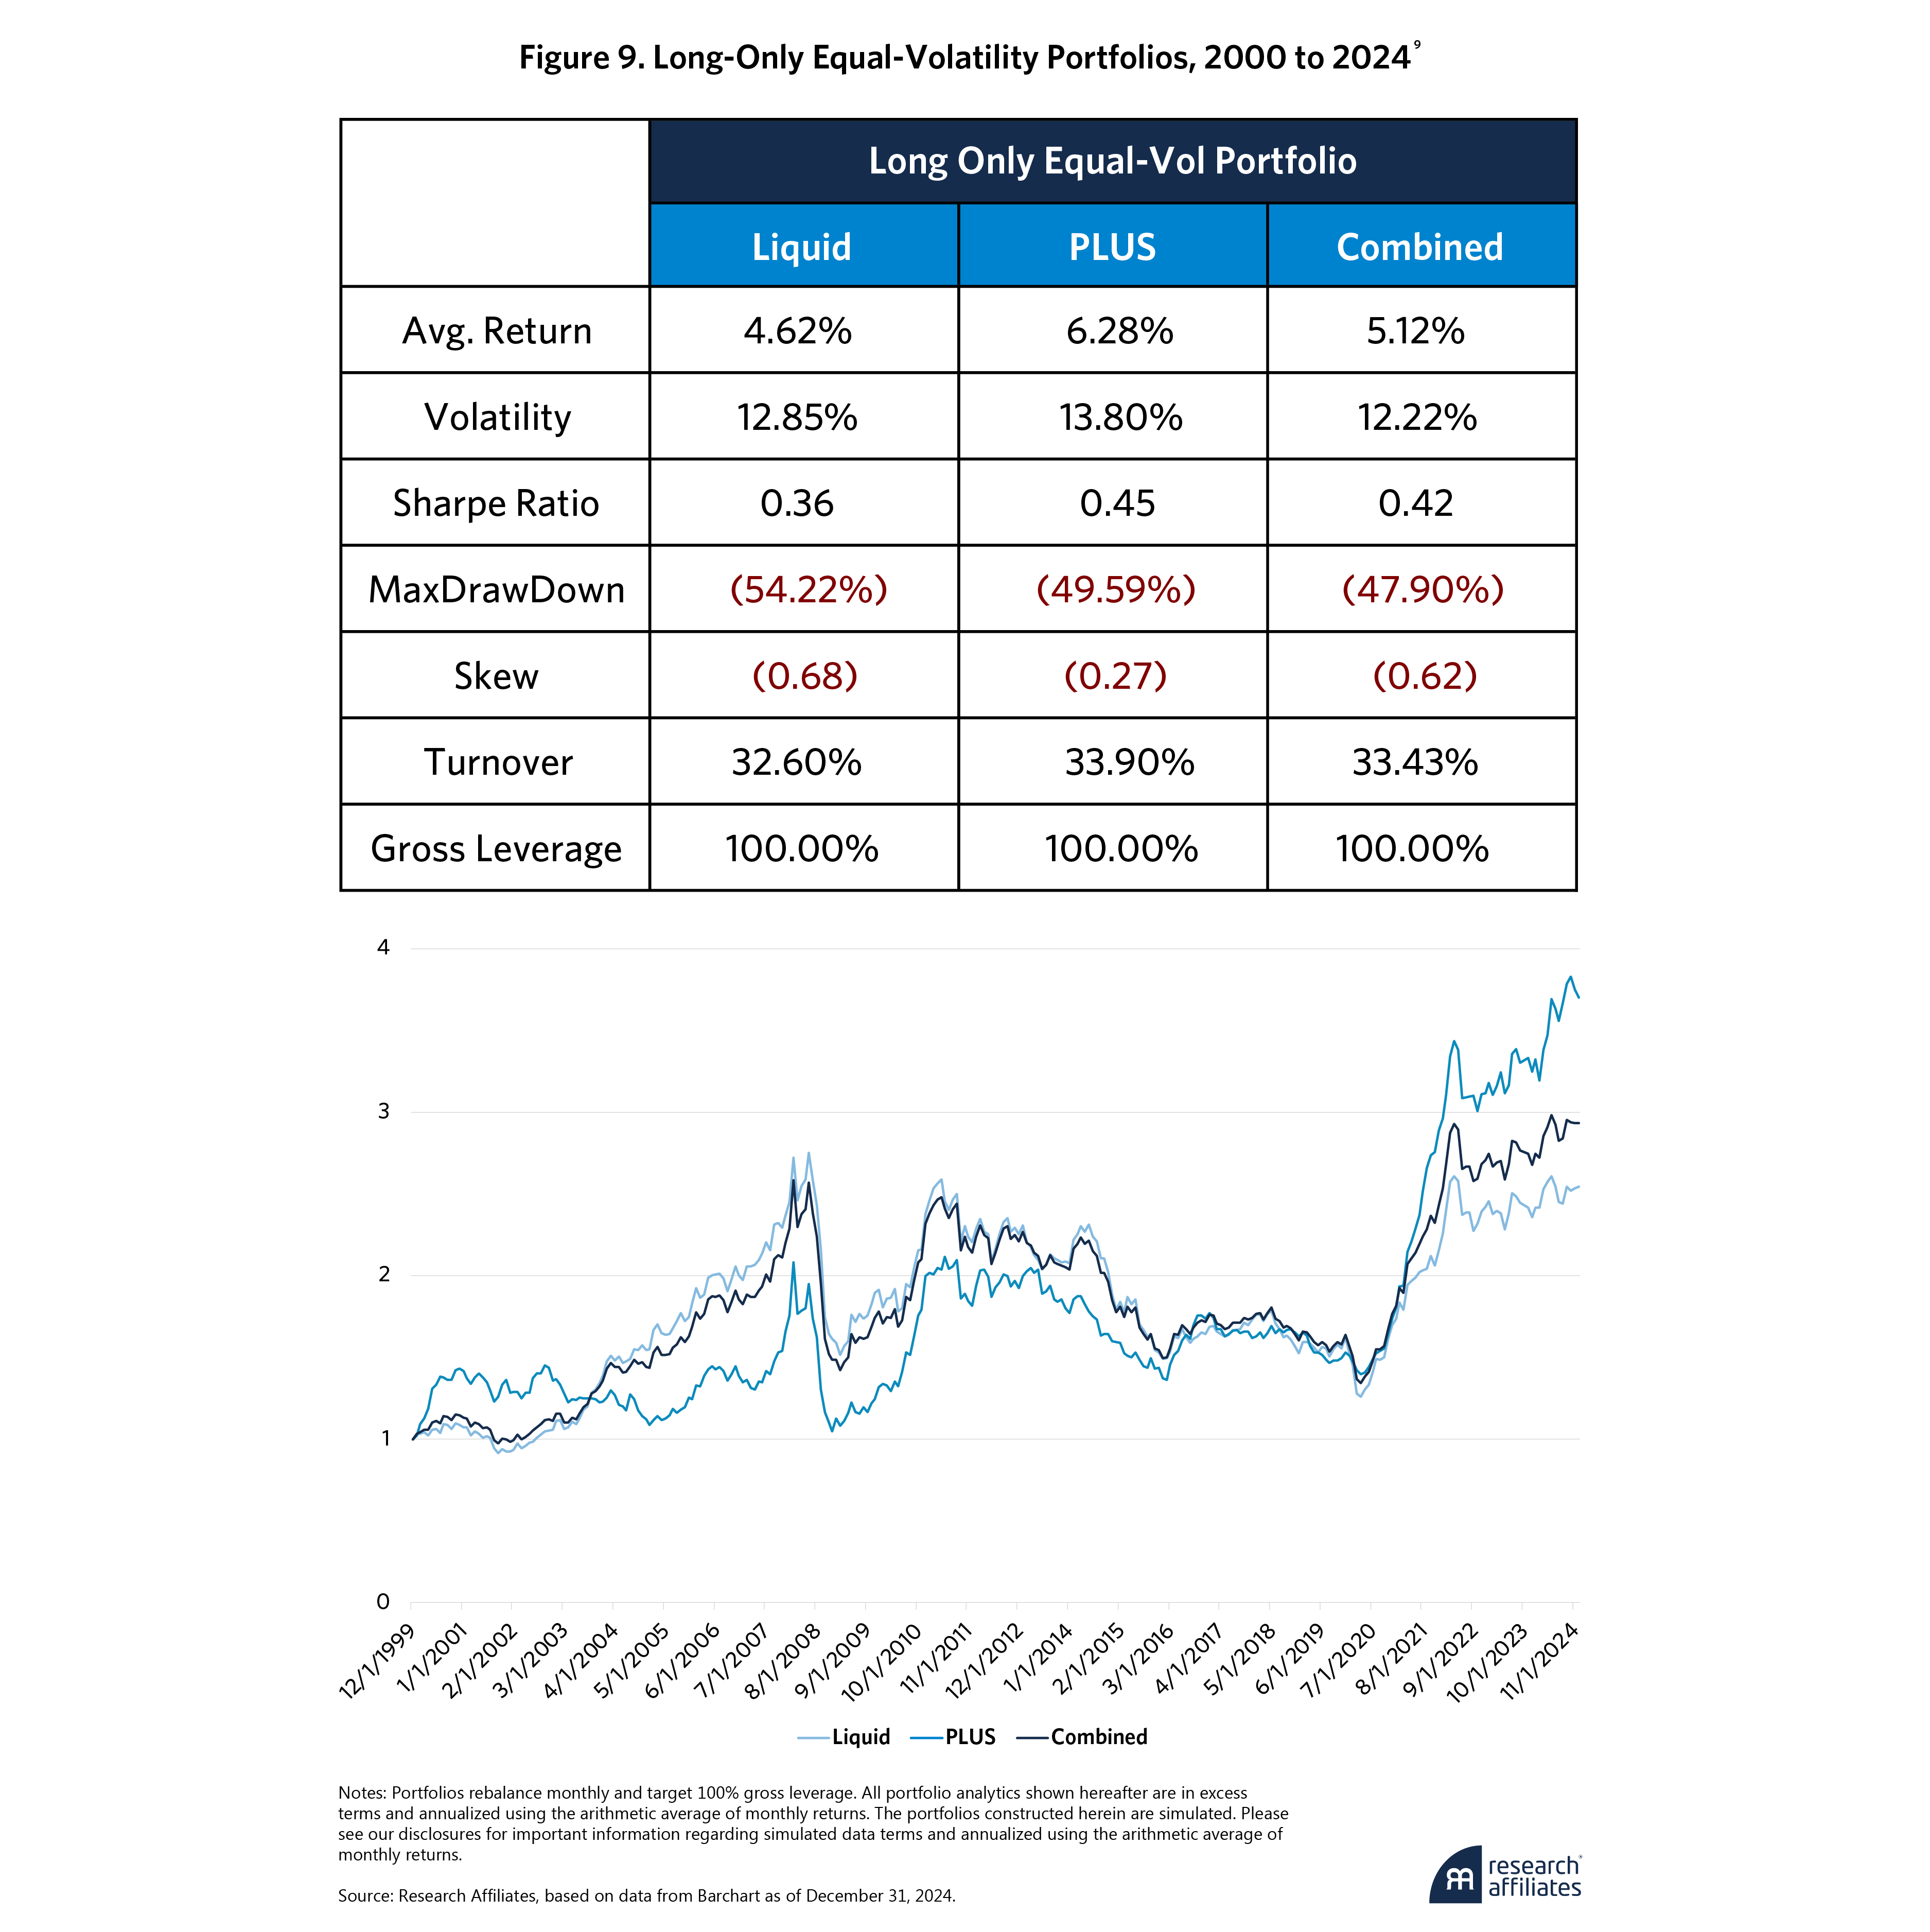
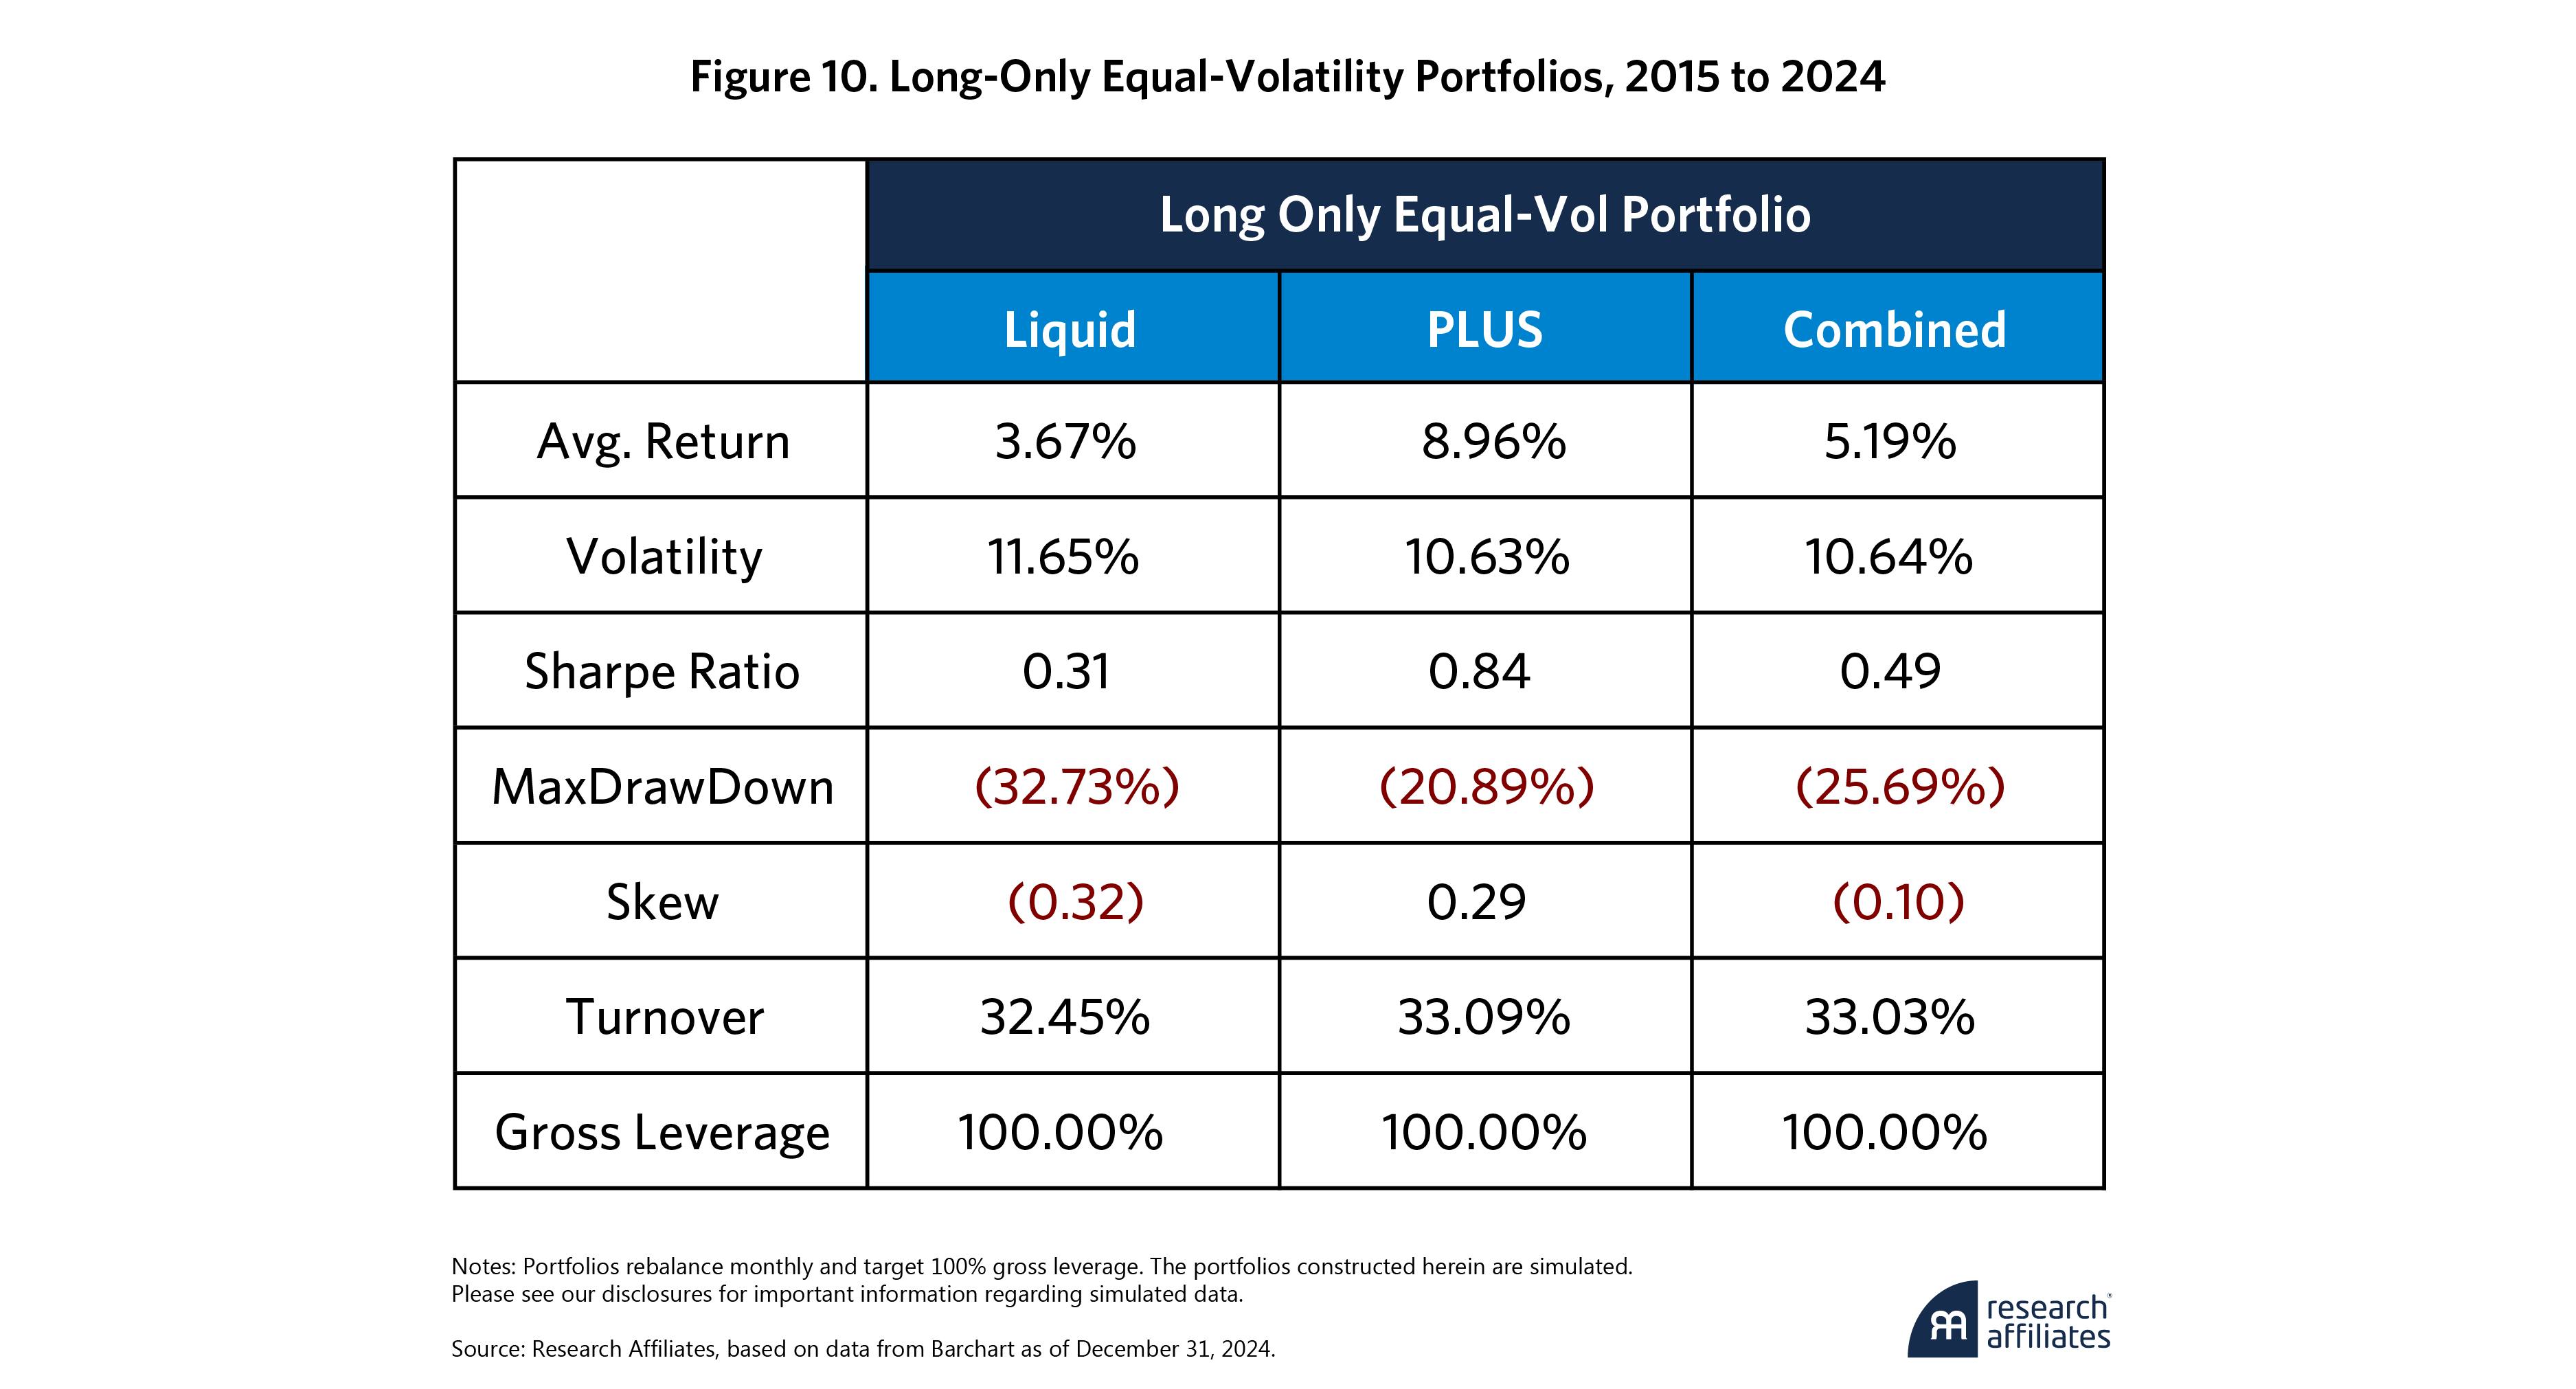
As markets have evolved and deepened over time, we know less trading was conducted in the PLUS commodities in the early years relative to the end of our sample period. To ensure our results aren’t biased by early performance, we next look at only the last 10 years, from 2015 to 2024.
Figure 10 shows the results over the most recent decade have even more outperformance in the PLUS portfolio compared to the liquid portfolio, with a significantly higher average return and Sharpe ratio as well as meaningfully reduced maximum drawdown and positive skew. The performance of the combined portfolio, even at 25% allocation to PLUS commodities, demonstrates improvement over the liquid universe alone.
In the next section, we investigate whether the performance improvement from the PLUS universe could also be captured through a cross-sectional, long-short portfolio construction.
4. Long-Short Portfolio Performance
As previously discussed, the risk-adjusted returns of the long-only commodity indices, BCOM and GSCI, have been modest over time. Fortunately, since commodity investing is implemented via derivatives—specifically commodity futures—we have a couple of dials that we can adjust. First is the ability to obtain leverage without having to explicitly borrow capital at a fee. This allows us to magnify the returns, albeit with higher volatility. Second is the ability to obtain short exposure to a commodity without the high borrowing costs that affect equities, providing us with a cost-effective means of capturing profits when asset prices fall. Finally, an extensive and growing literature documents various factor-based investing approaches in the commodity space, illustrating the mechanism to systematically capture various sources of return. See, for example, Erb and Harvey (2006), Koijen et al. (2018), Asness et al. (2013), and Fernandez-Perez et al. (2018).
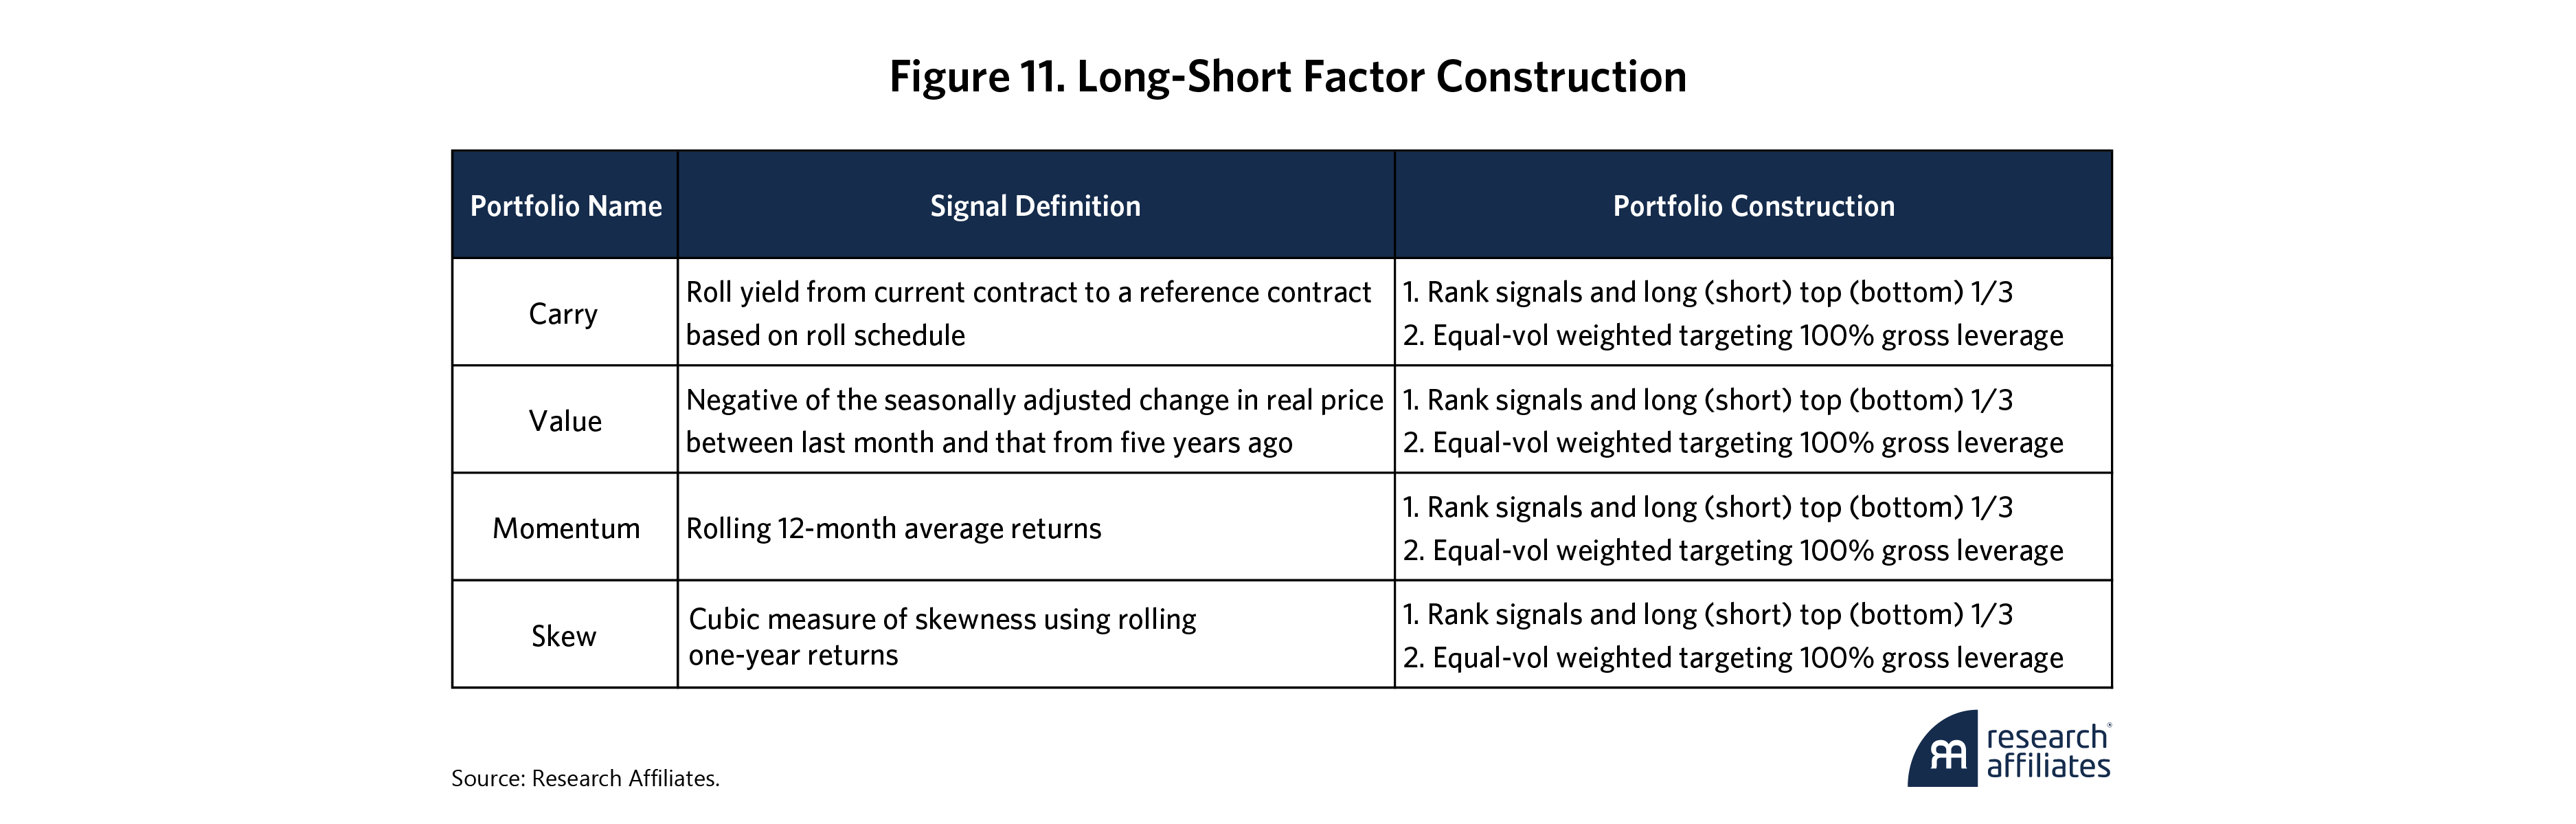
To assess the effects of including the PLUS commodities, we select four well-documented factors, as Figure 11 shows. For consistency, we create the factor portfolios in the same way, which may differ from the original literature; however, since we focus on the relative benefits of introducing the PLUS commodities to the liquid universe of assets, any changes in construction will not impact our findings. To avoid imposing ex-ante views on the relative performance of these factors, we aggregate them into a long-short portfolio such that they contribute the same expected portfolio volatility. To account for the lower liquidity of PLUS commodities and to mitigate portfolio concentration risk, we apply exposure and exposure change trading constraints to each commodity at each monthly rebalance.10 These constraints are critical for evaluating the PLUS commodity effects in a more realistic, implementable framework.
Over the past 25 years, as Figure 12 shows, PLUS commodities have significantly enhanced the performance of the multi-factor long-short portfolio. We observe a 0.4 increase in Sharpe ratio and a nearly 50% reduction in max drawdown. More importantly, the performance improvement persists even after applying trading constraints, though at a lower magnitude given the overall exposure limits to the PLUS commodities. Furthermore, the trading costs do not materially detract from the benefits observed.11
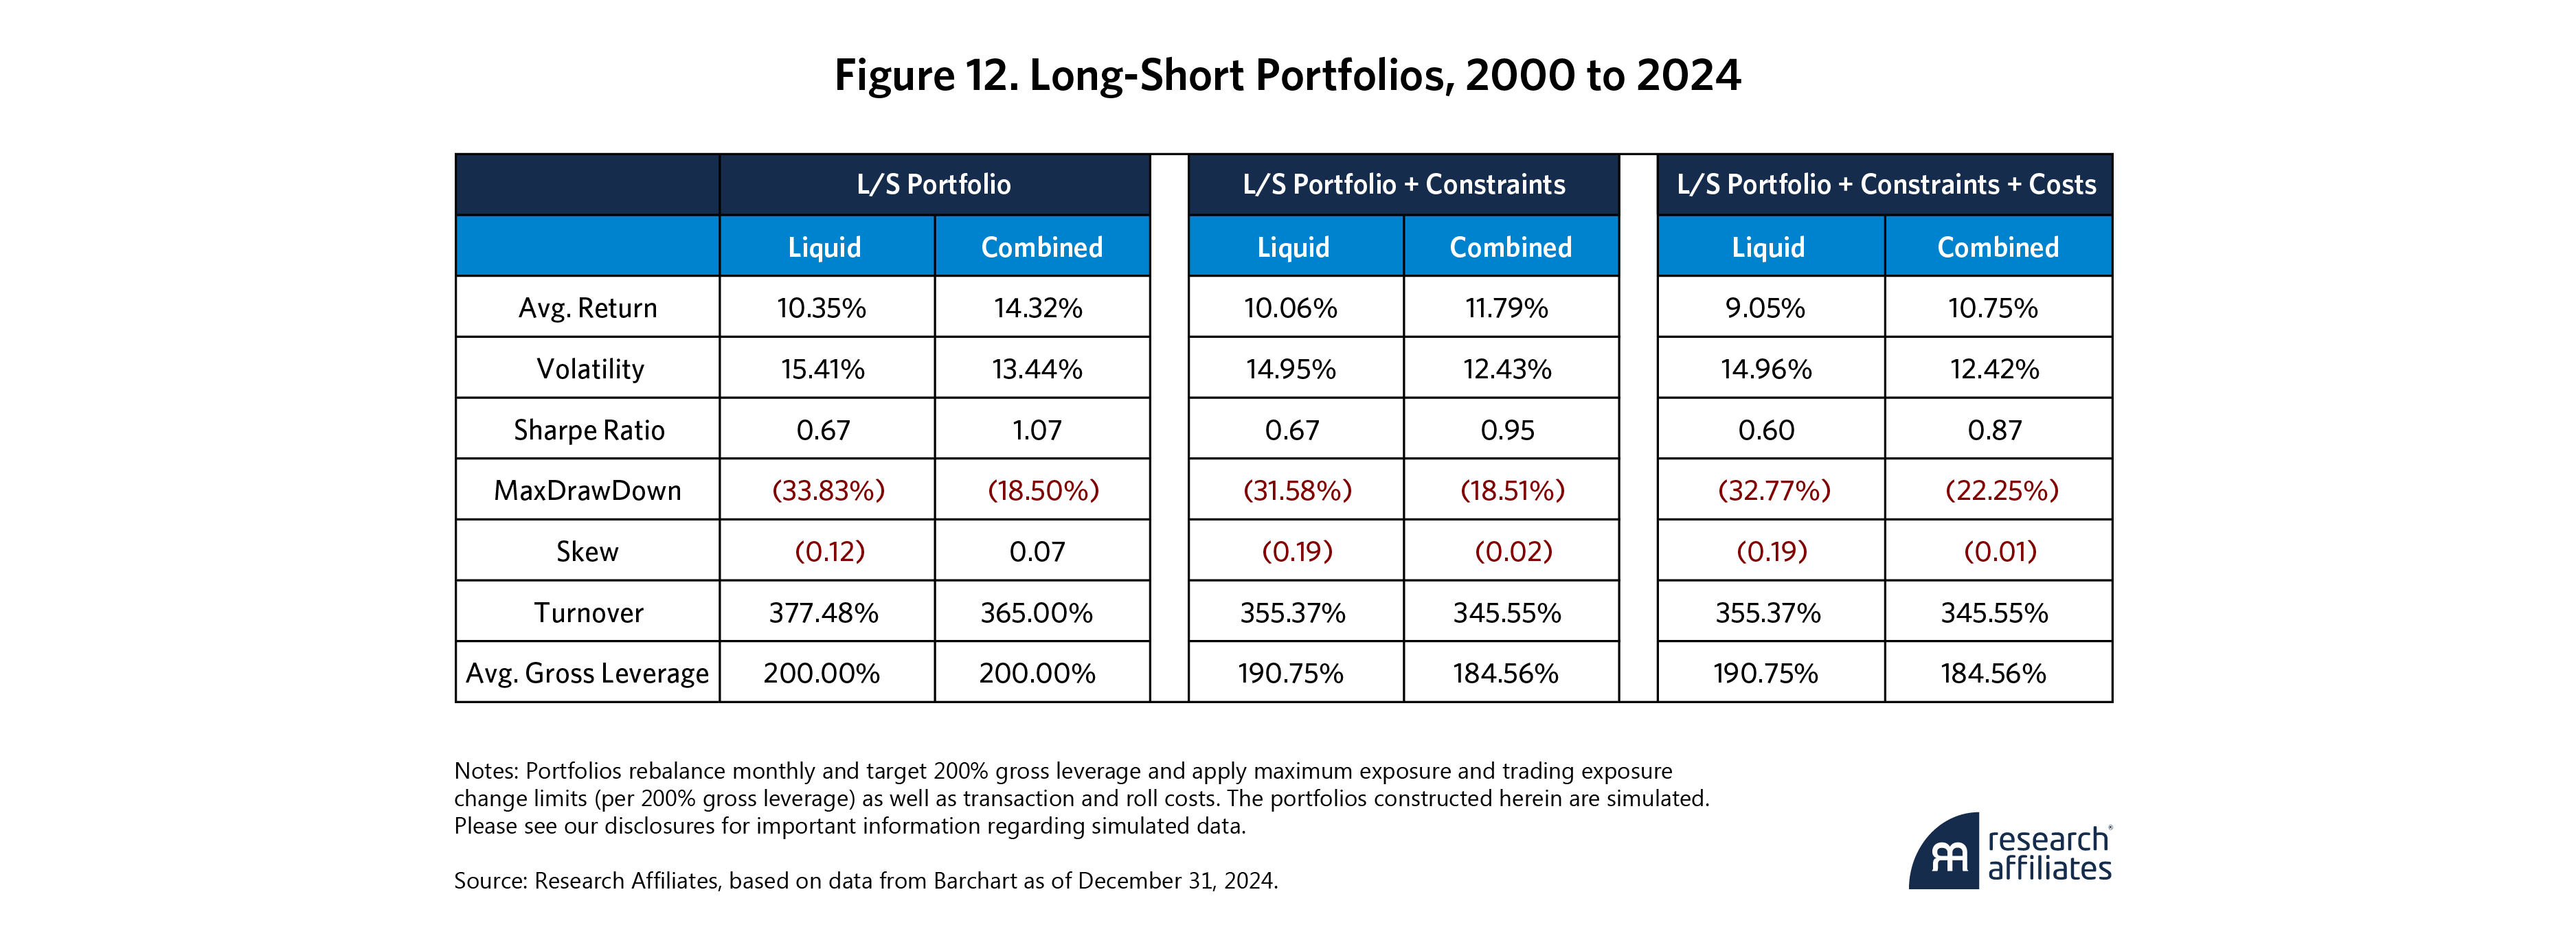
Notably, the return contribution from the PLUS commodities is about 40% of the overall performance while also accounting for about 40% of the total gross leverage (200%). All PLUS commodities positively contribute to the overall performance with the exception of Platinum.12 Given the inclusion of the PLUS commodities is determined solely by liquidity and fundamental criteria, these findings provide empirical support for the value of expanding the commodity universe.
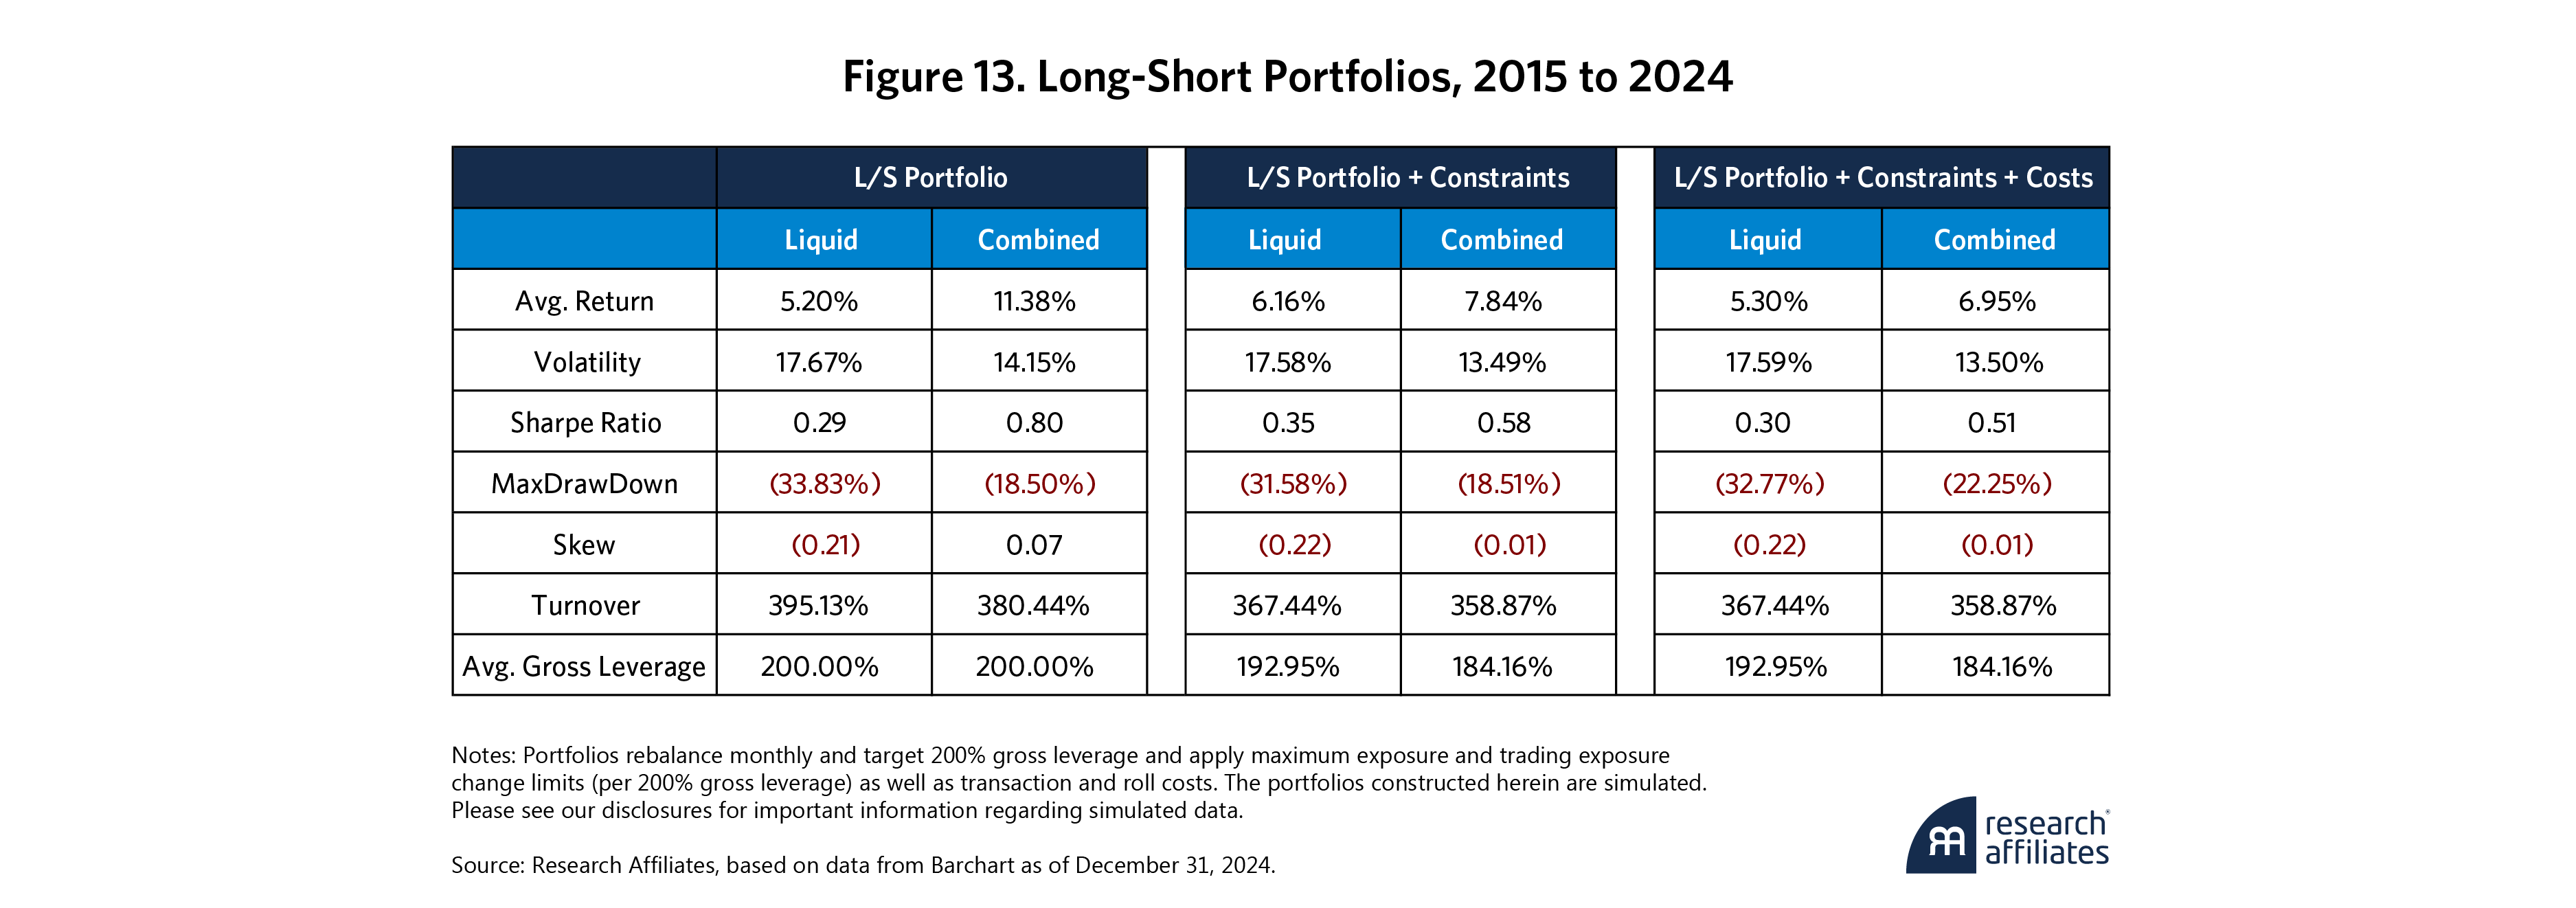
However, to be fair, we didn’t have the data to know these 10 PLUS commodities would have the necessary capacity and tradability to include in our long-short portfolios in 2000, but we would have had that information by 2015. Figure 13 shows similar improvements in performance over the last 10 years across all portfolio analytics, while trading constraints and costs still do not eliminate the benefits of incorporating the PLUS commodities.
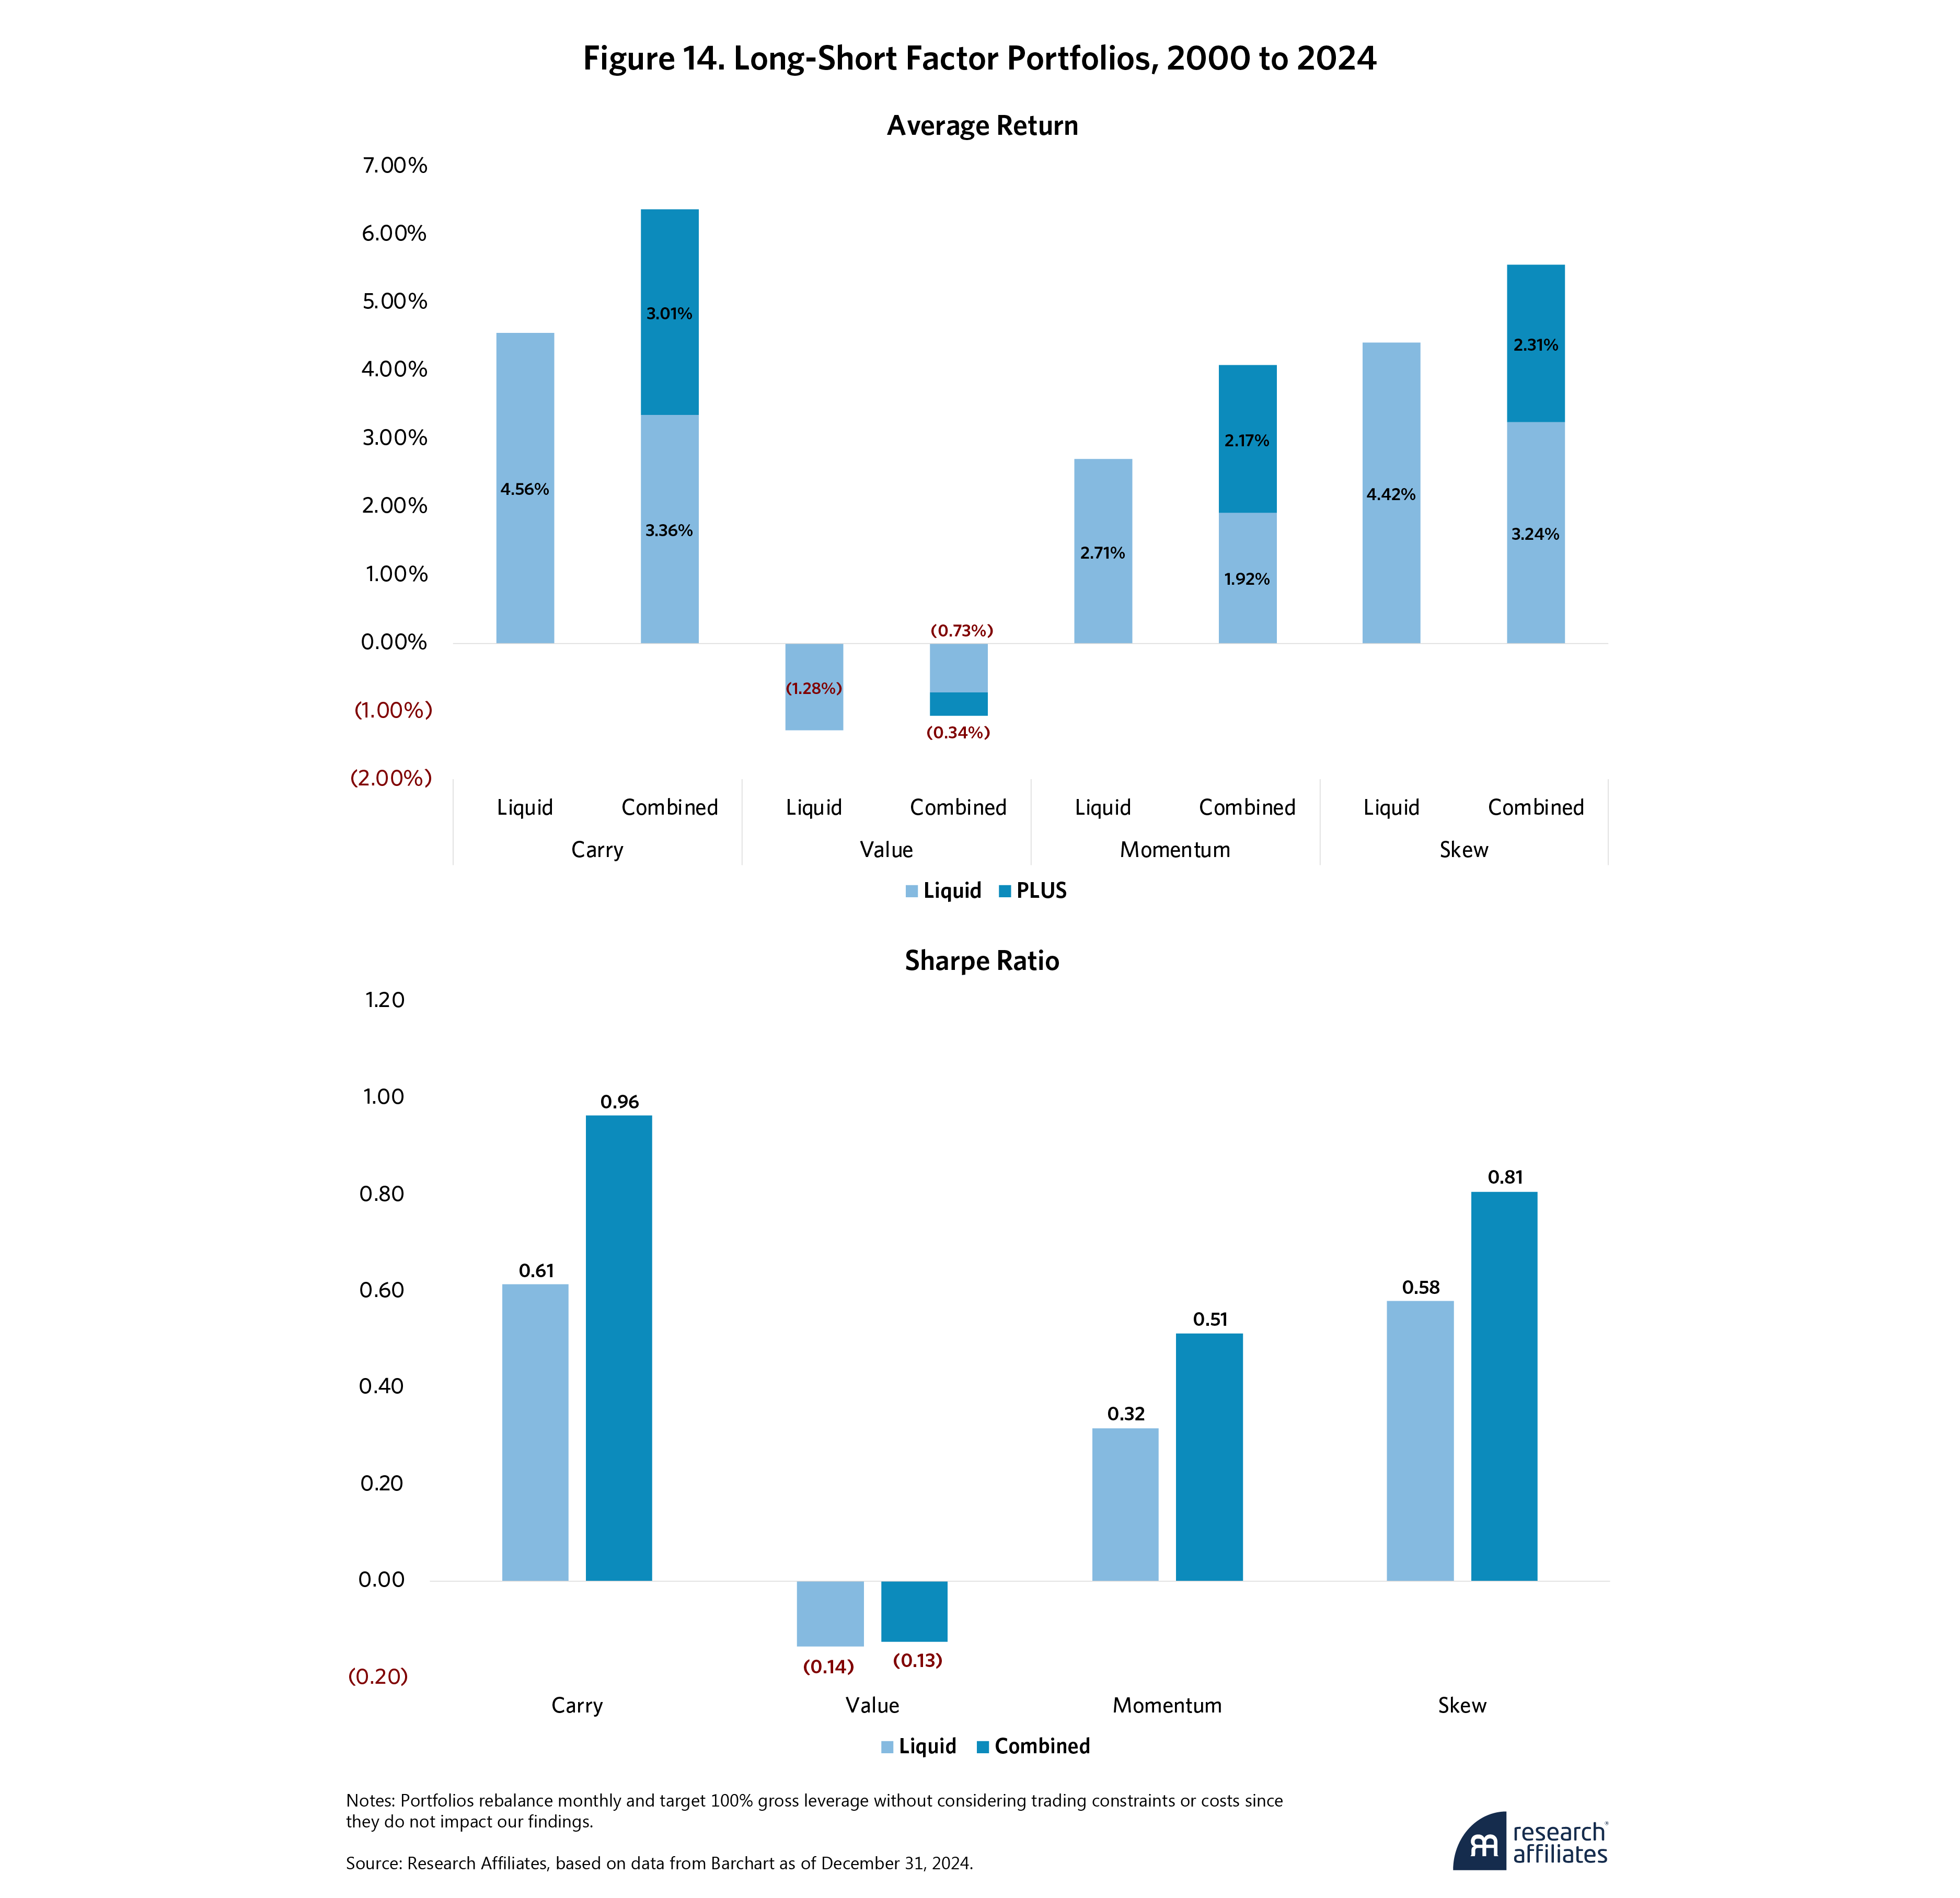
Finally, to further validate the robustness of these results, in Figure 14, we compare the average return of each individual factor portfolio constructed on the liquid universe to one created with the combined universe and also decompose the performance of the portfolios constructed on the combined universe into liquid and PLUS commodities. Across all four factor portfolios, including the PLUS commodities consistently results in higher average returns and improved Sharpe ratios. In portfolios with positive overall performance, the return contribution from PLUS commodities is comparable to that from liquid commodities despite accounting for only ~25% of the total gross leverage (100%).
Although these results are encouraging, we need to dive deeper to better understand the drivers of these findings to ascertain whether they have the potential for continuation in the future.
5. Drivers of Performance Improvement
Both the long-only and the long-short factor strategies provide evidence of the value of adding the PLUS commodities to a portfolio. Before concluding, we conduct a cursory peeling back of the onion to examine different characteristics and assess whether they are potential sources of the excess performance. Specifically, we look at three such drivers—the roll yield and liquidity premium at the asset level and the diversification return at the portfolio level.
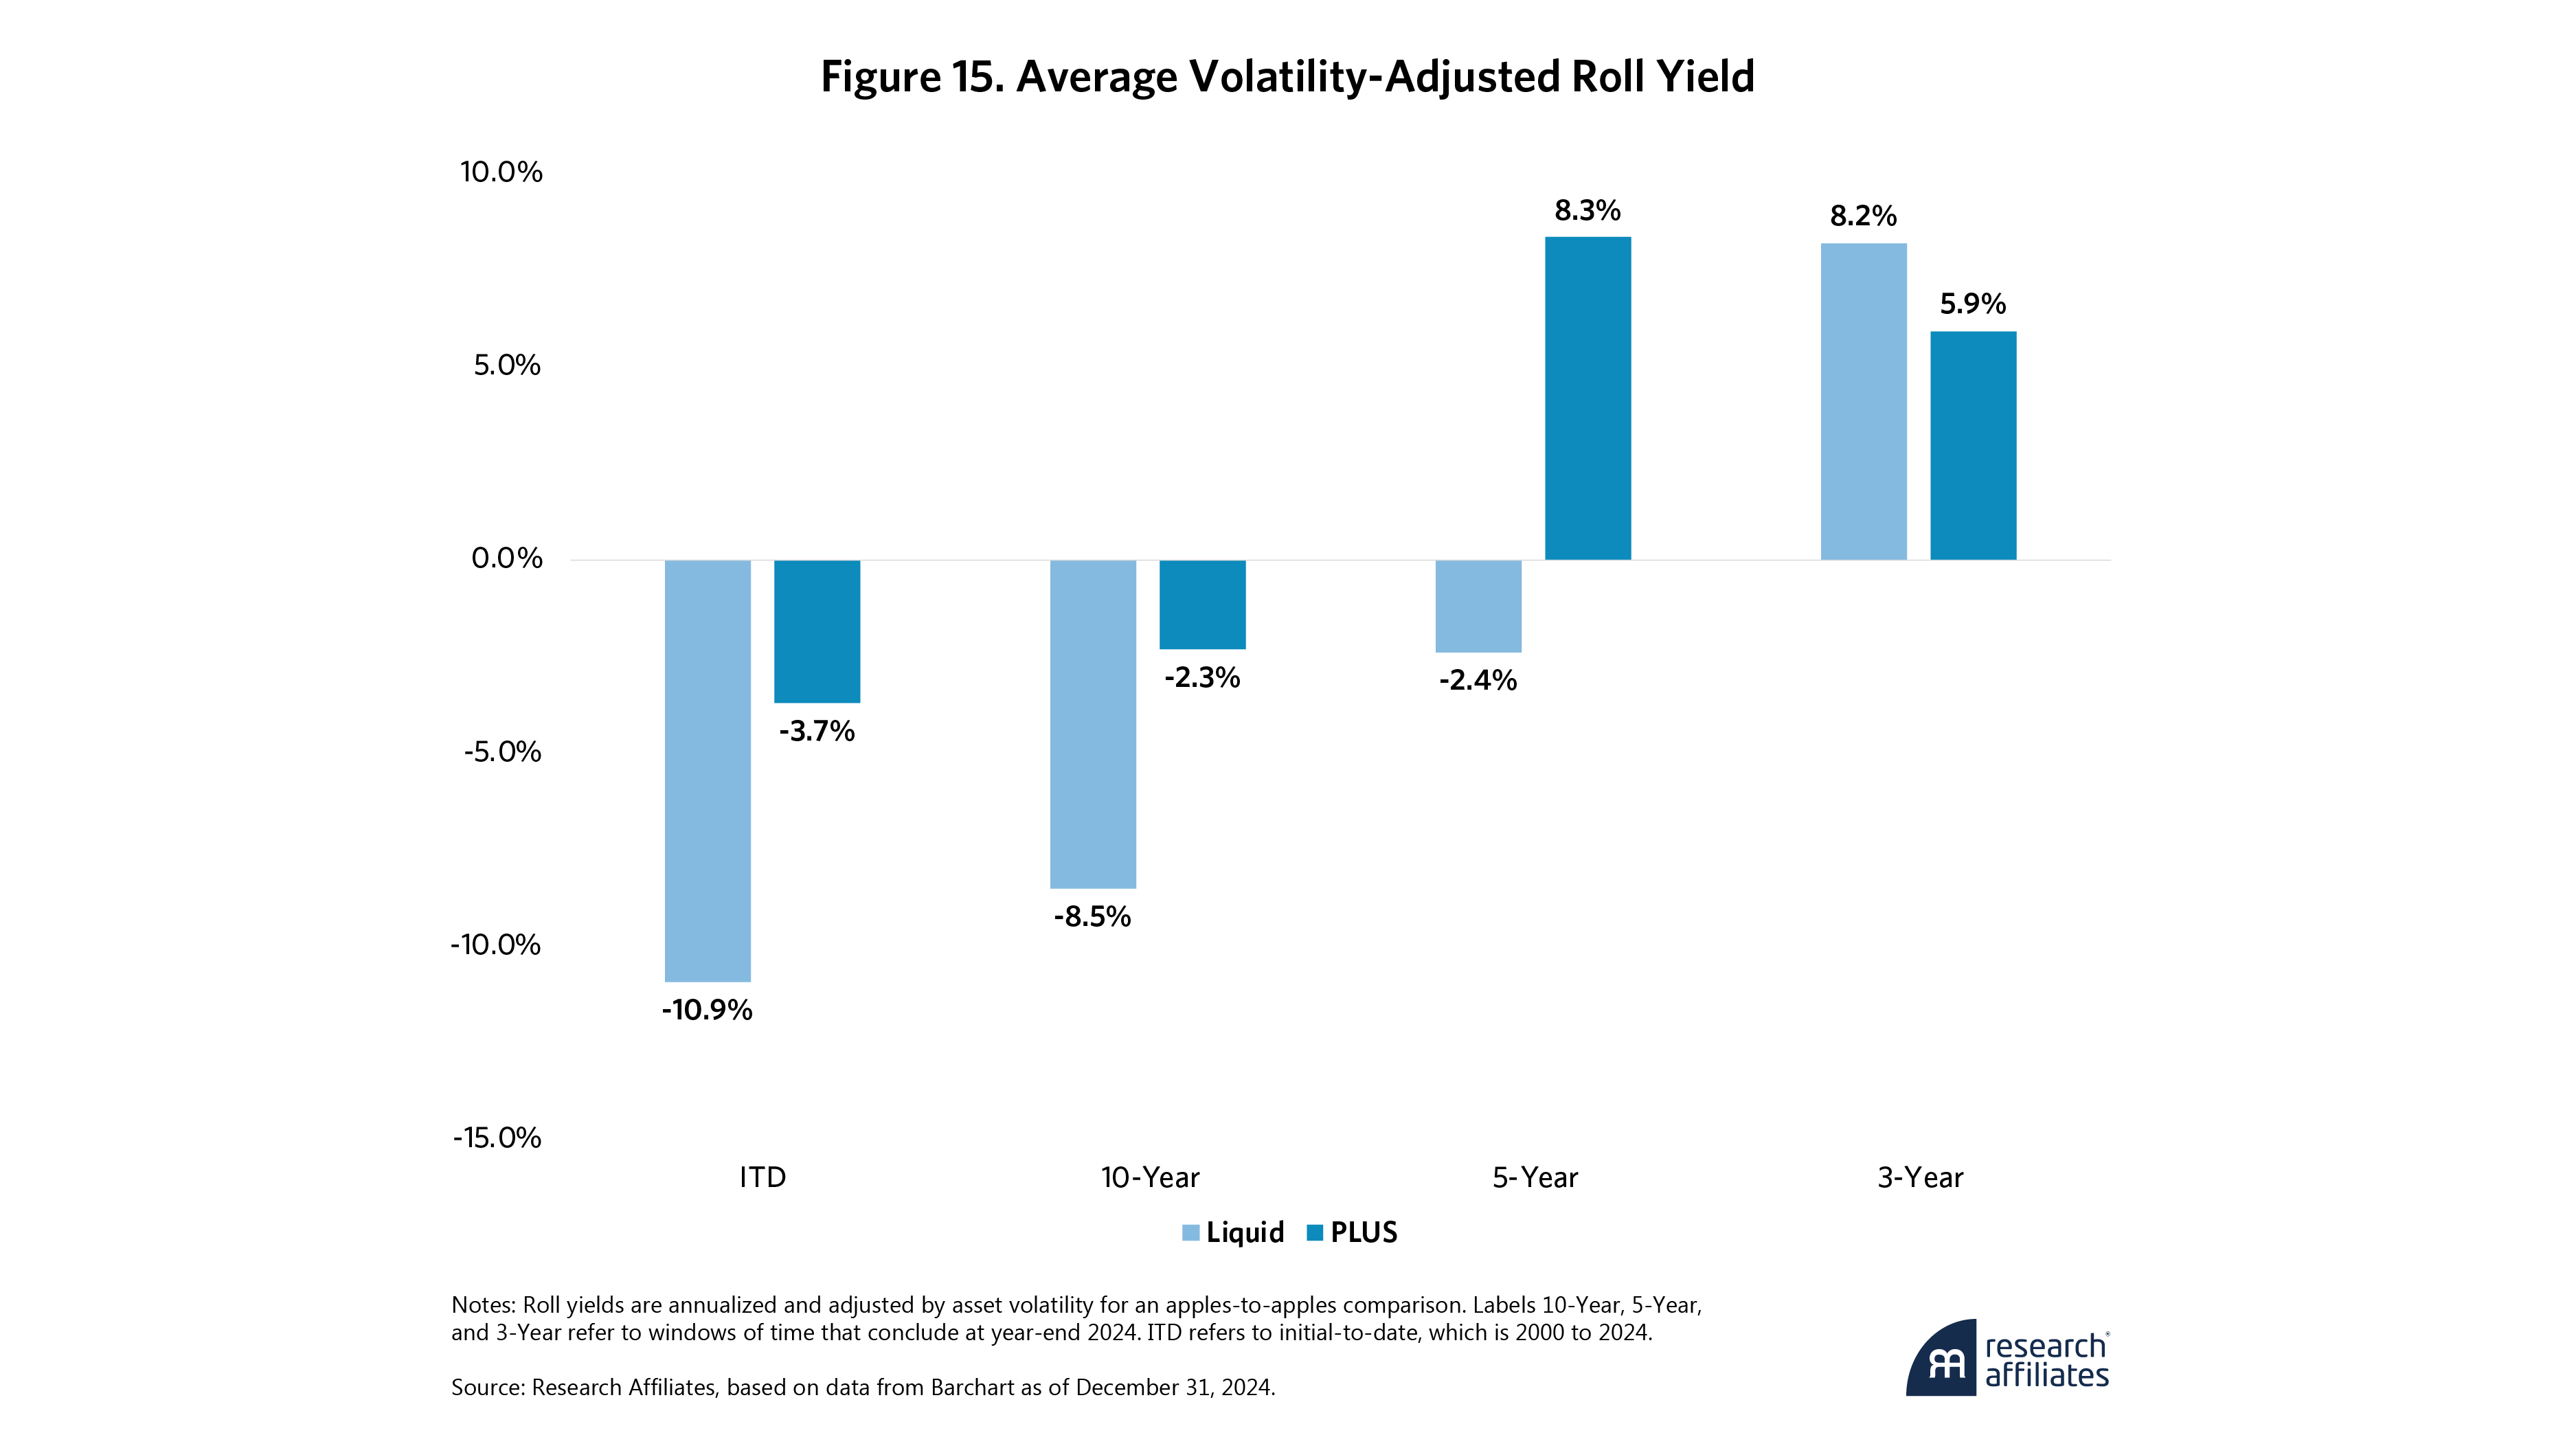
First, the return of a commodity future can be decomposed into the roll yield, also known as carry, which accounts for the change in the price of the derivative as it approaches maturity, and the return due to changes in the spot price of the underlying commodity. Figure 15 shows that across multiple horizons—other than the most recent three-year period, which is significantly distorted by UK Natural Gas13—PLUS commodities consistently demonstrate higher average volatility-adjusted roll yields, suggesting higher average returns.
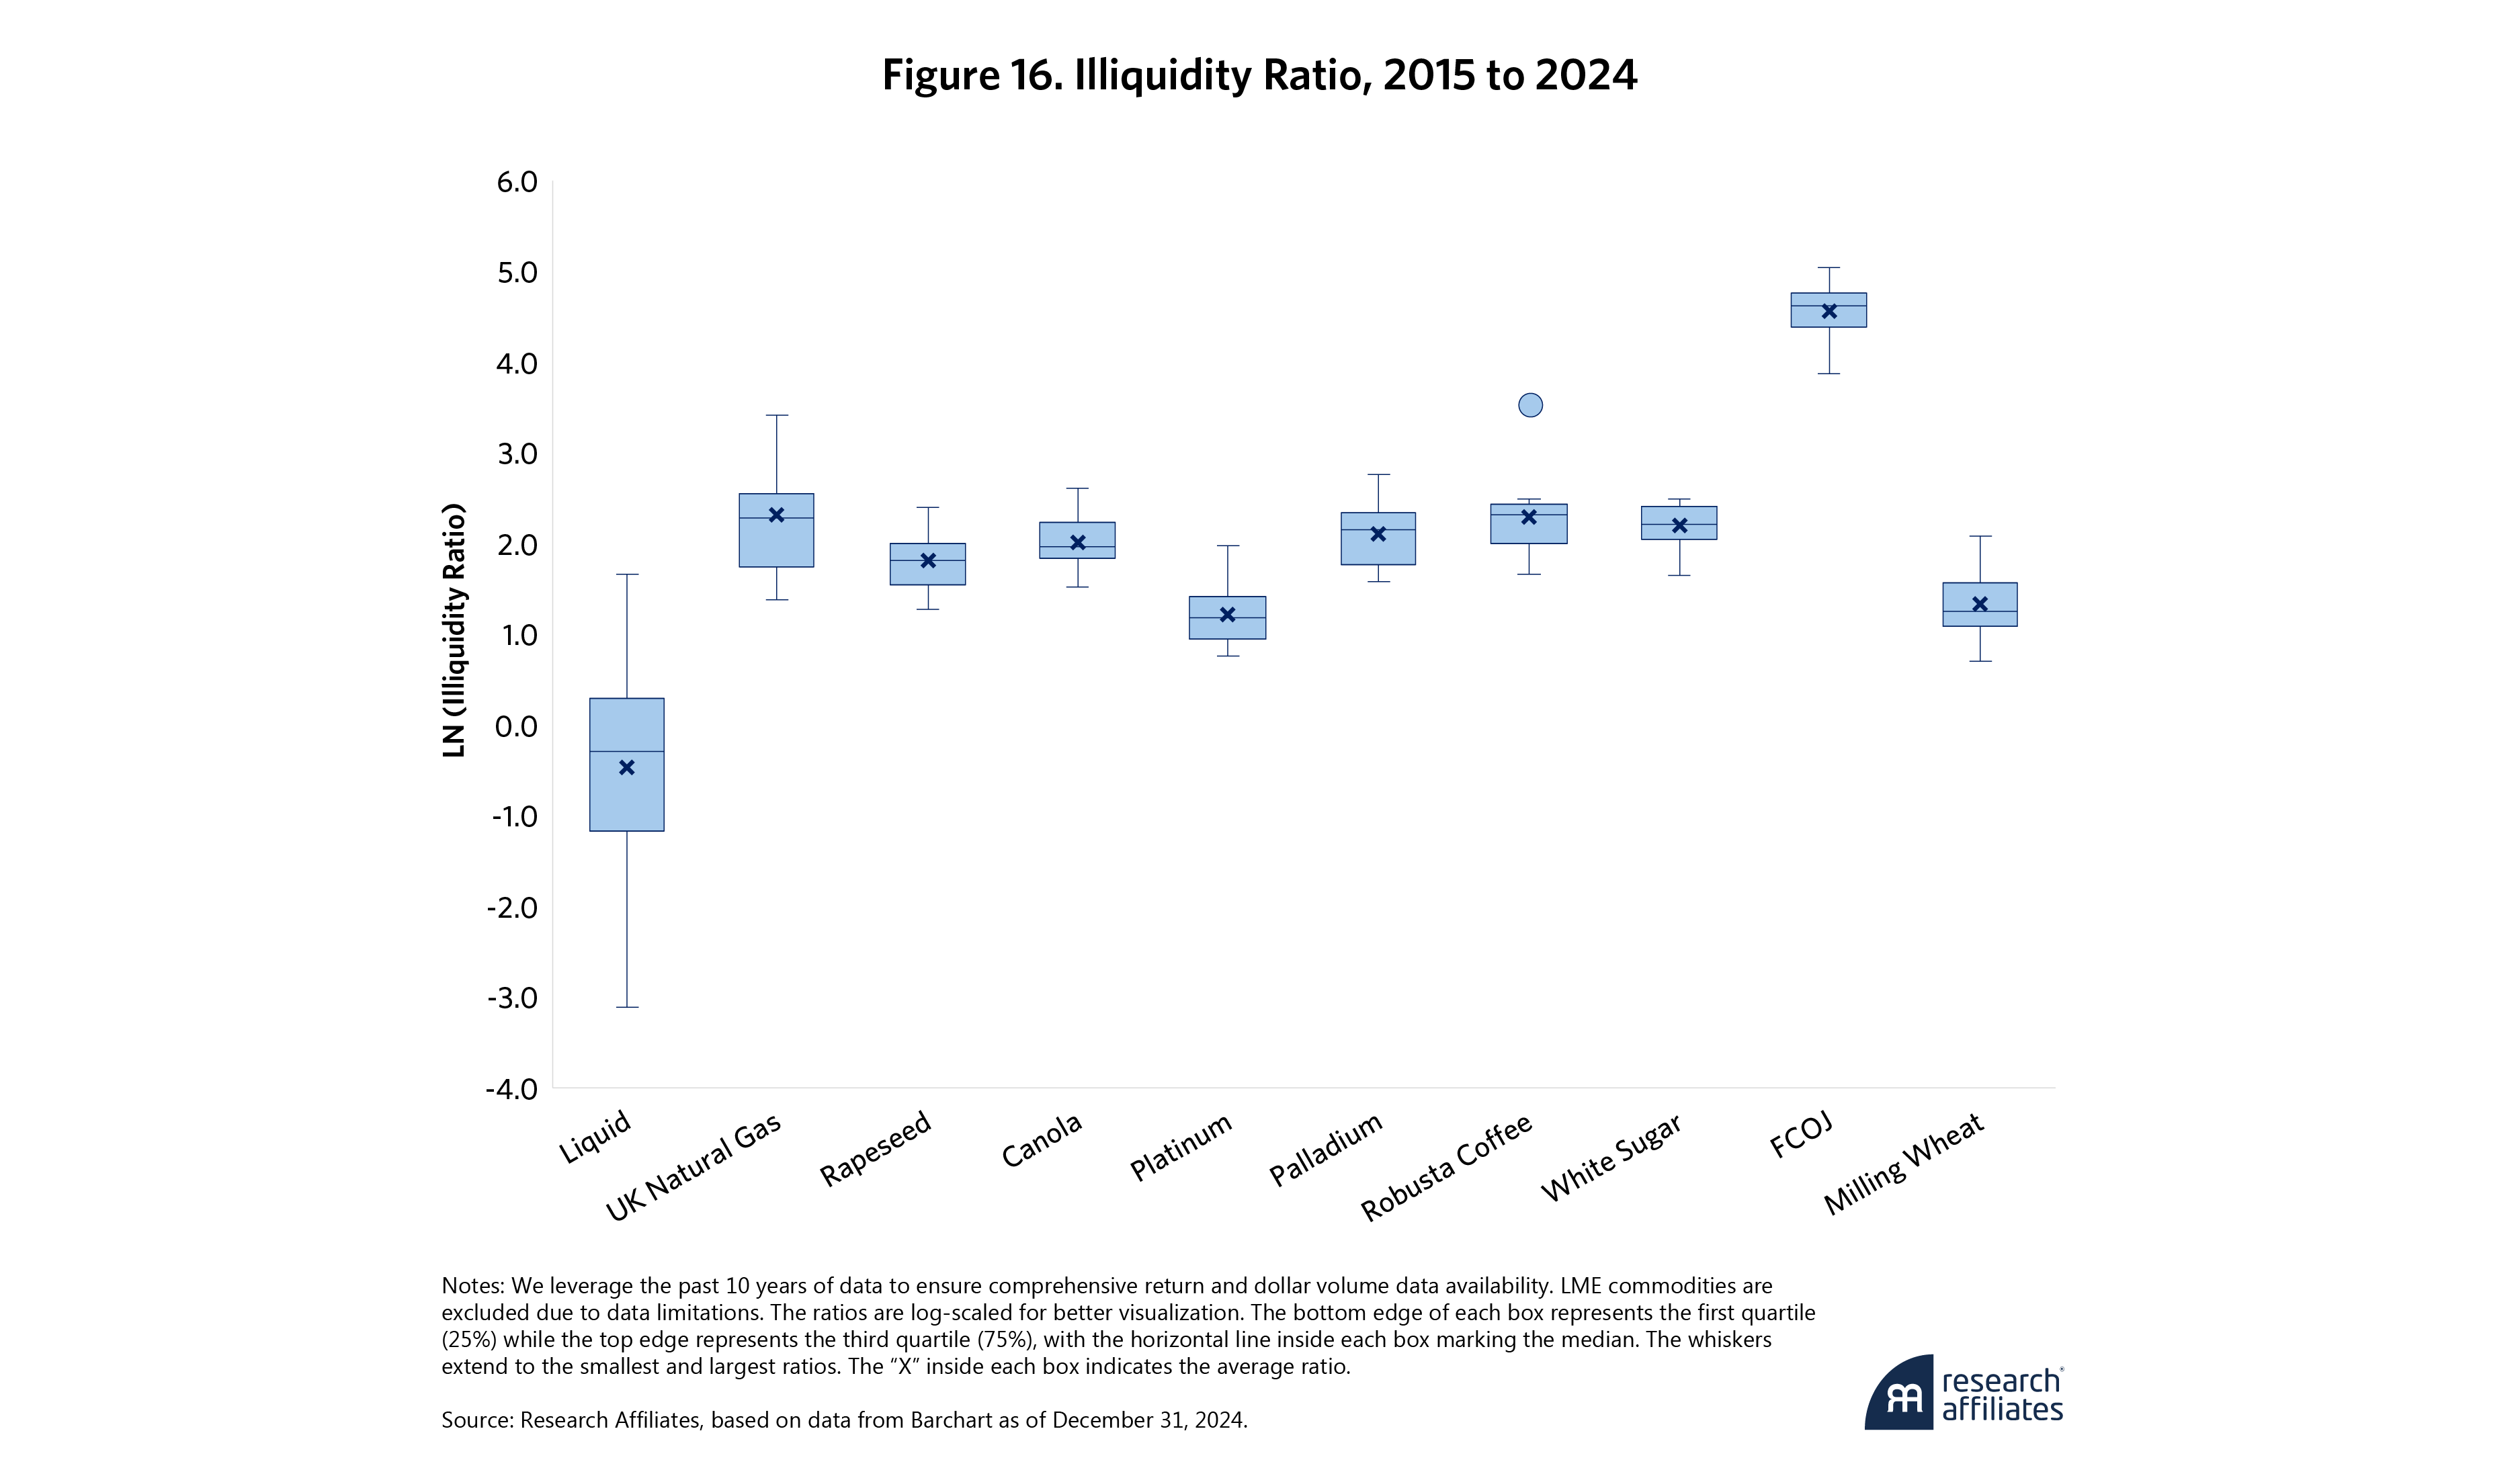
Second, although the PLUS commodities meet our capacity and tradability thresholds, they do have lower liquidity than their liquid universe counterparts and therefore may command a higher return premium to compensate for liquidity risk. To measure this, we use the Amihud (2002) illiquidity ratio, which compares an asset’s absolute daily return to its daily dollar volume, averaged over one year, indicating an asset’s price reaction to a dollar of trading volume over time. Larger values imply more price impact per dollar traded, or a more illiquid asset. Figure 16 shows that all PLUS commodities have higher illiquidity measurements than liquid commodities.
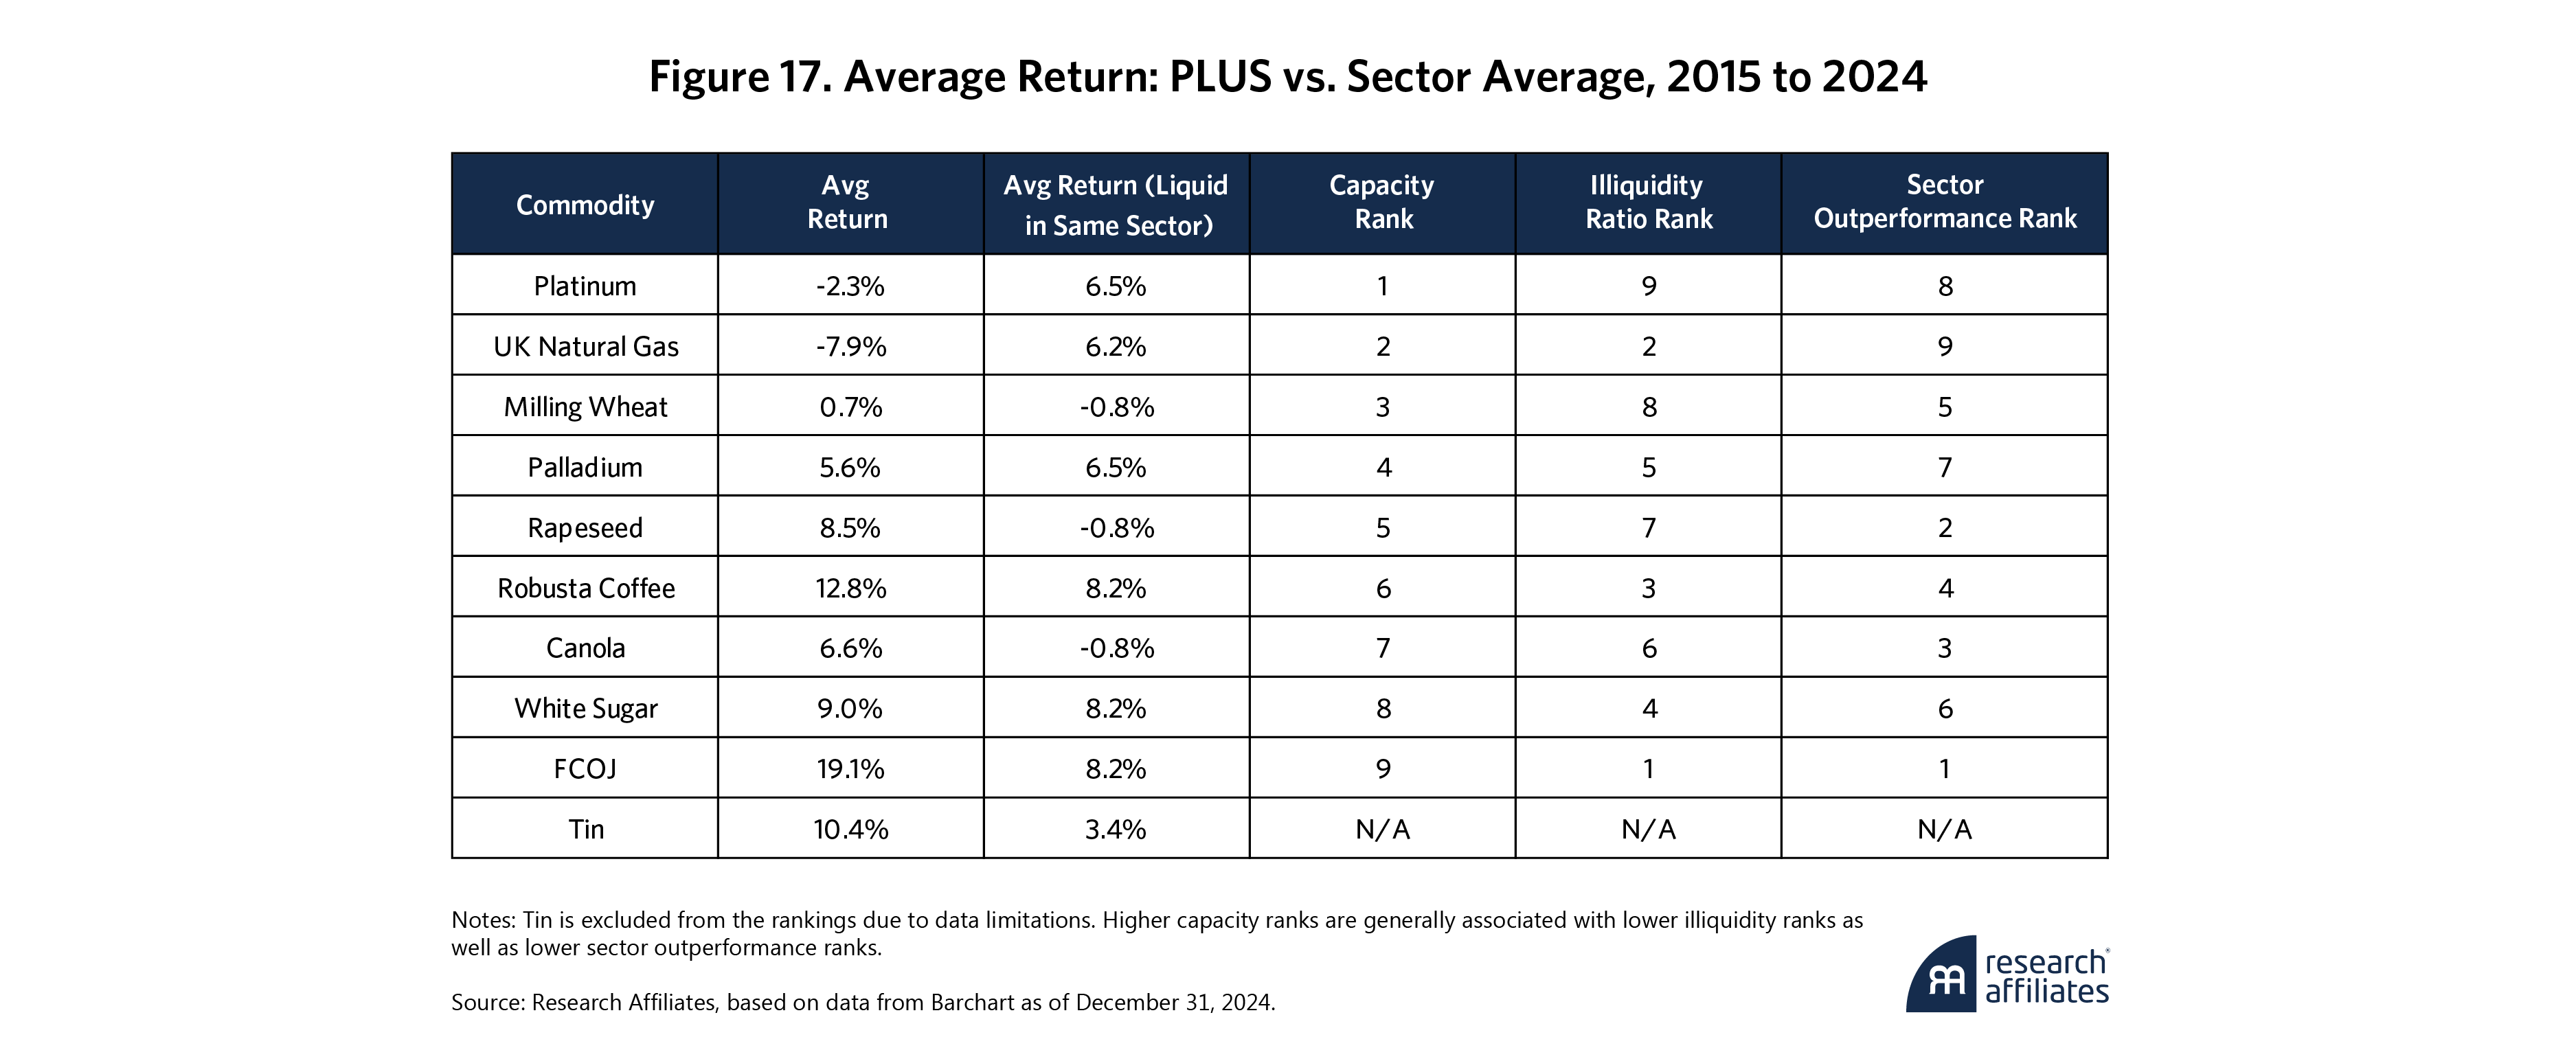
Comparing the average returns of the PLUS commodities over the last 10 years and the average return of the liquid universe grouped by sector, we find that seven of the 10 PLUS commodities outperform their sector’s average return, as Figure 17 shows. Tying this back to measures of illiquidity, there seems to be a positive relationship between the magnitude of the outperformance and the instrument’s illiquidity ratio. In general, the higher the illiquidity ratio rank, the higher the outperformance rank. This suggests that the excess performance of PLUS over liquid is at least partially attributable to a liquidity premium.
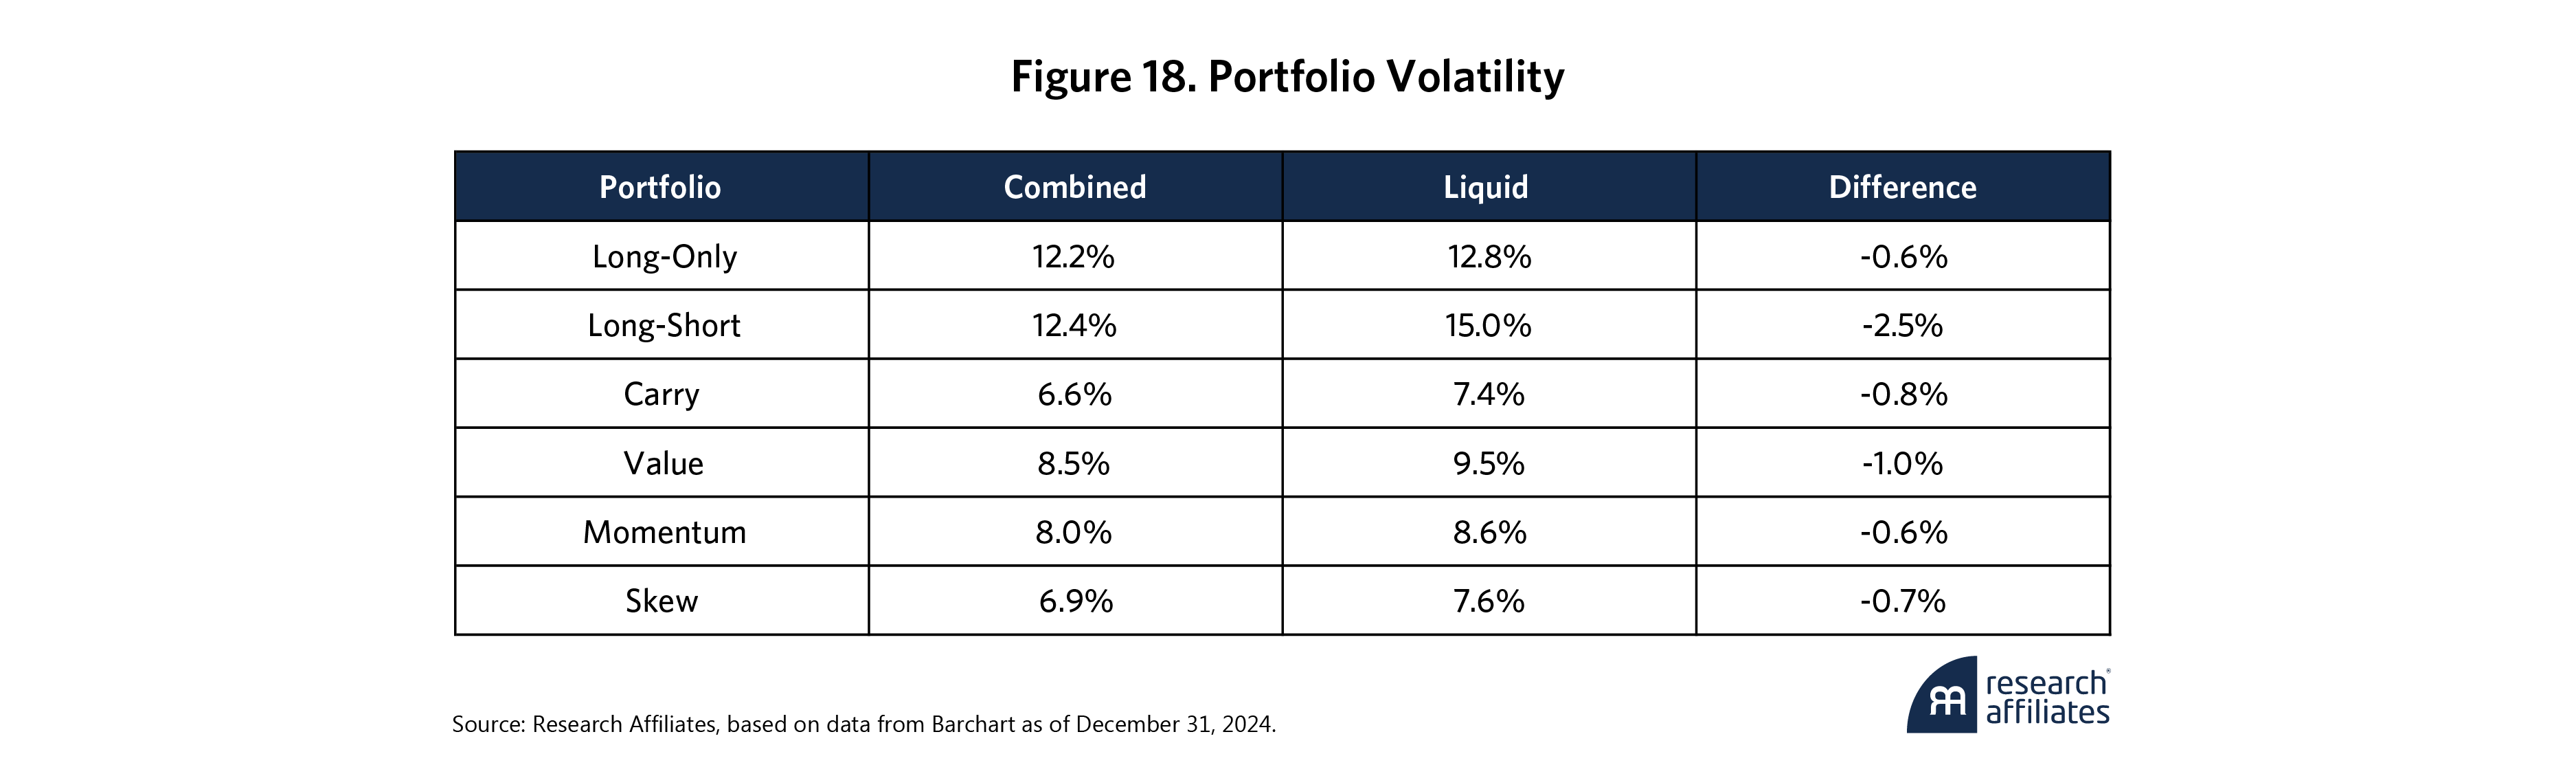
Third, incorporating PLUS commodities into all portfolios discussed in the previous sections reduces overall portfolio volatility,14 as Figure 18 shows, despite these commodities not exhibiting materially lower volatility on average compared to the liquid universe (28.0% vs. 28.4%). This implies diversification benefits through lower pairwise correlation between PLUS and liquid commodities.
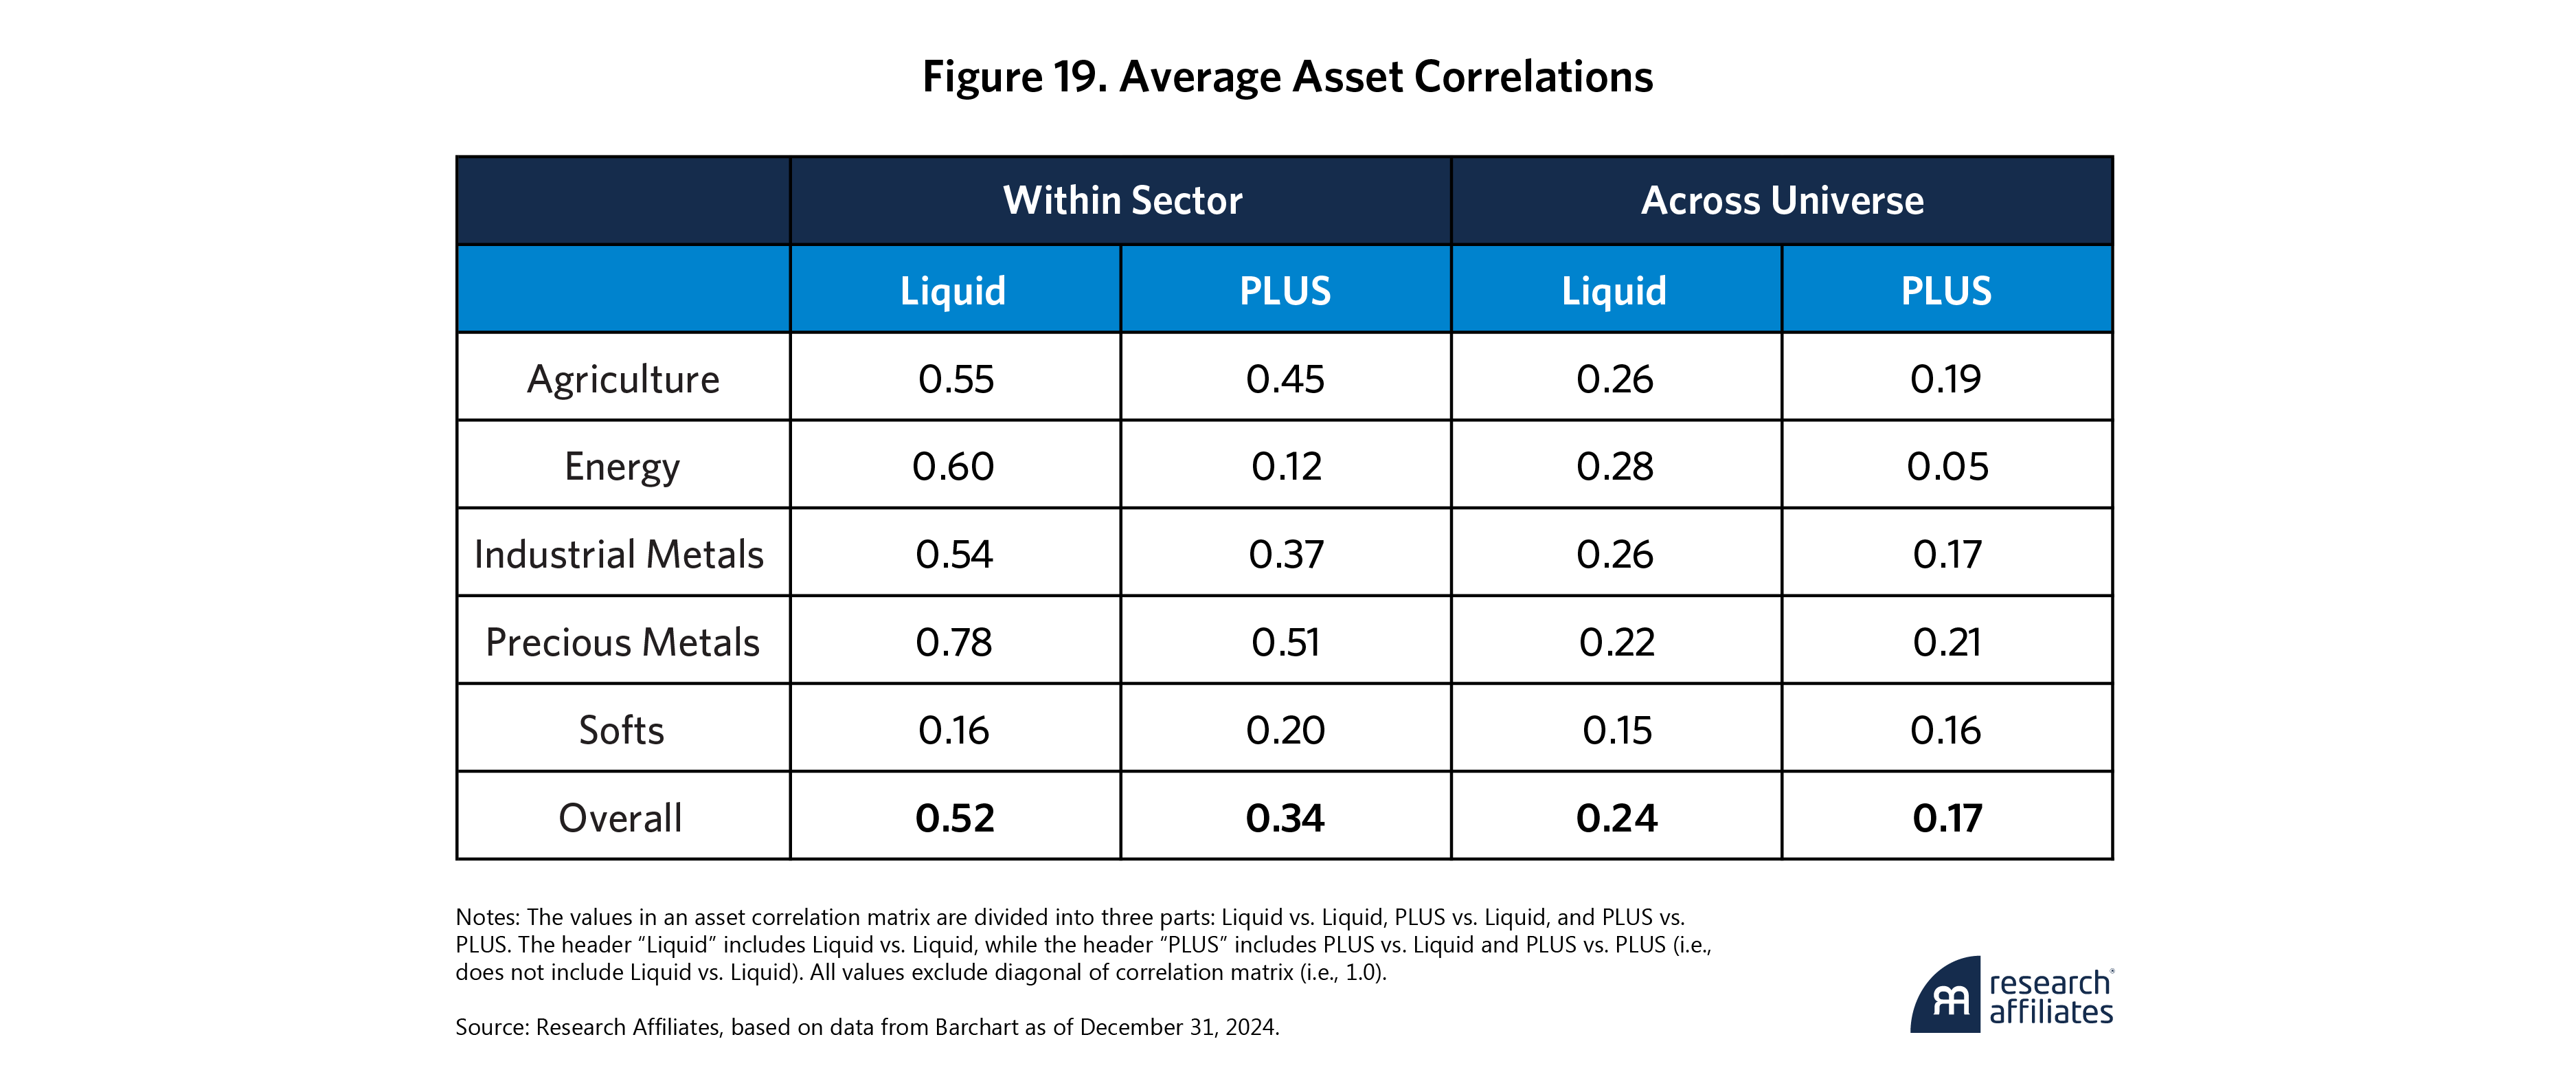
Indeed, Figure 19 shows the overall average asset correlations are lower for PLUS commodities than for liquid commodities both within sector and across the entire universe, with the exception of Softs, driven by higher correlations between Robusta Coffee vs. Coffee and White Sugar vs. Sugar. Consistent with our results, Declerck and Vy (2024) find that a trend strategy constructed on 16 off-BCOM constituents delivers much higher risk-adjusted returns than one based on BCOM constituents alone, attributing this outperformance to the broader diversification offered by the off-BCOM universe.
Finally, Figure 20 examines the diversification return proposed by Willenbrock (2011), measured by half the difference between the assets’ variance and the assets’ covariance with the portfolio, of our monthly rebalanced long-only portfolios. It shows that the diversification return is uniformly higher when including the PLUS commodities over various horizons. This is attributable to both the rebalancing premium15 and a reduction in portfolio variance as observed by Erb and Harvey (2006). We noted that diversification is our friend when it comes to commodity investing, and adding PLUS commodities to the liquid universe provides diversification effectively, leading to improved portfolio risk-adjusted returns.
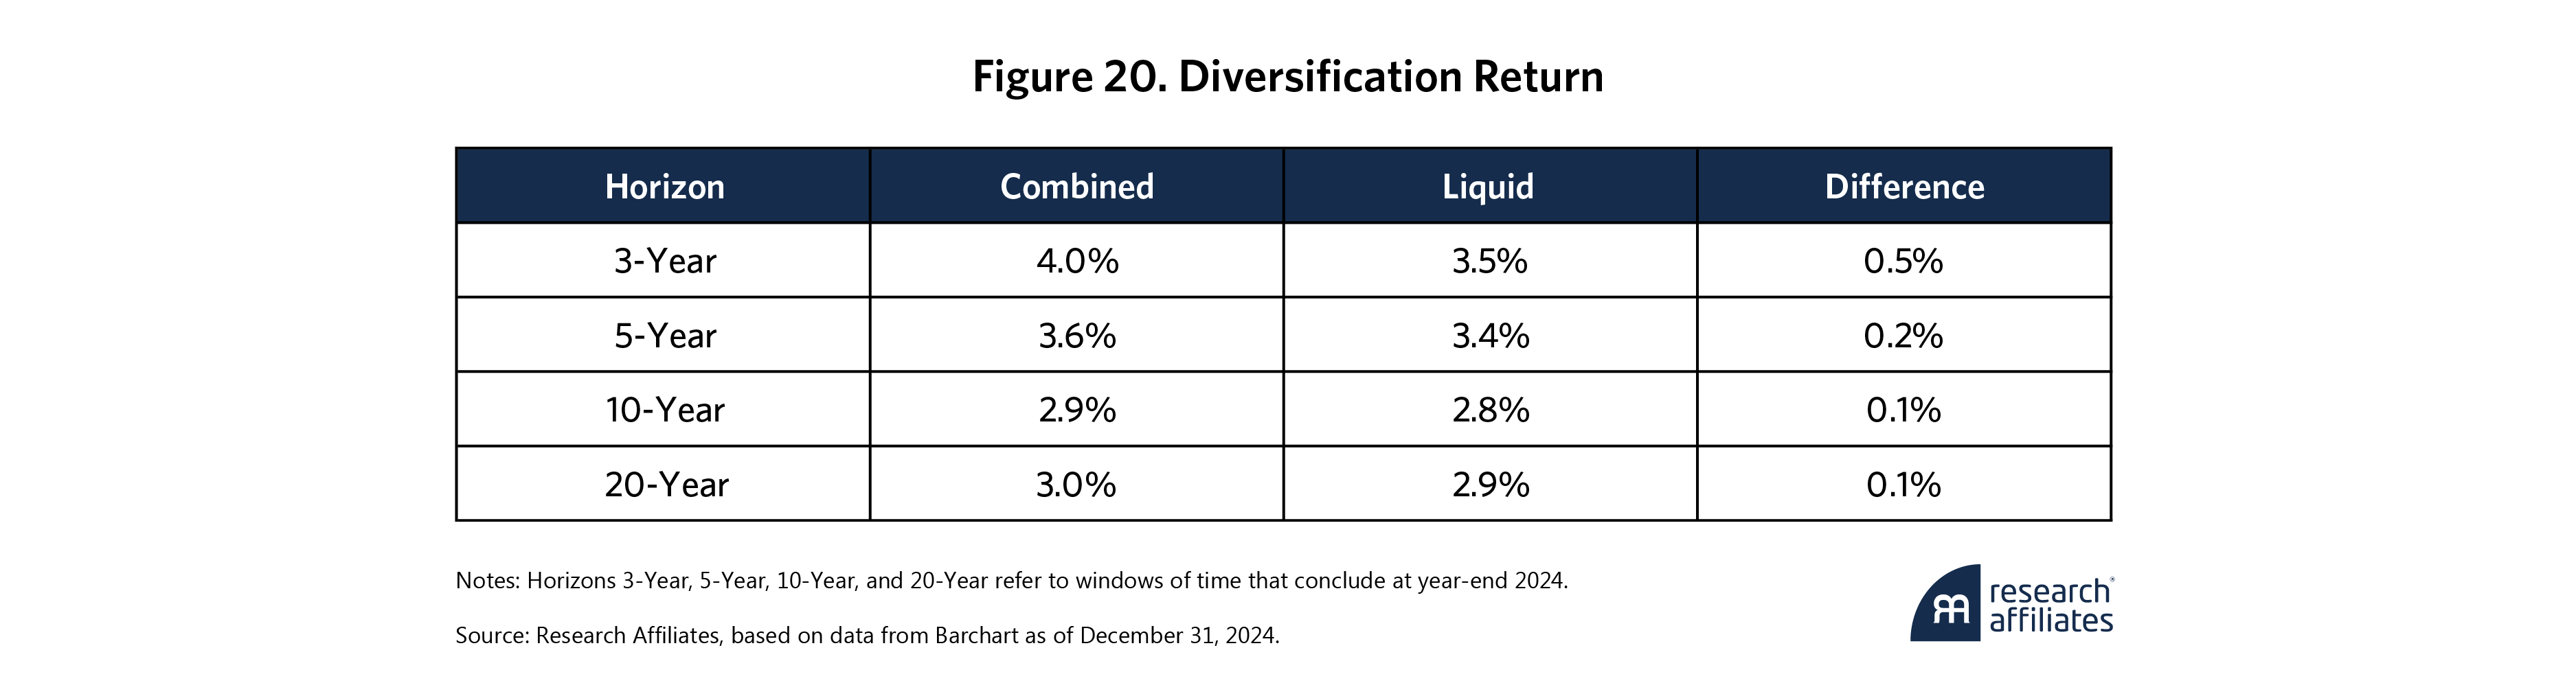
Diversification is our friend when it comes to commodity investing, and adding PLUS commodities to the liquid universe provides diversification effectively, leading to improved portfolio risk-adjusted returns.
”Conclusion
This study demonstrates that expanding the commodity universe to include PLUS commodities offers substantial benefits in both long-only and long-short portfolio contexts. Our analysis shows that these benefits are not merely theoretical but are implementable, as our proposed capacity and tradability criteria illustrate.
Long-only equal-volatility portfolios constructed on the combined universe exhibit better risk-adjusted performance than those composed of conventional benchmark constituents, with improvements in Sharpe ratio, maximum drawdown, and skewness. Moreover, long-short factor-based portfolios that incorporate the PLUS commodities deliver superior enhancements in performance, particularly in terms of significantly increased Sharpe ratios and reduced drawdowns, even after accounting for trading constraints and costs. These performance gains are largely attributable to several potential drivers: higher asset roll yields, exposure to the liquidity risk premium, and improved portfolio diversification.
Long-only equal-volatility portfolios constructed on the combined universe exhibit better risk-adjusted performance than those composed of conventional benchmark constituents, with improvements in Sharpe ratio, maximum drawdown, and skewness.
”Our findings support the practical and strategic merit of expanding the investable commodity universe, especially for investors managing diversified multi-asset portfolios. The results also suggest that traditional benchmark indices such as BCOM and GSCI may no longer sufficiently capture the full opportunity set available in global commodity markets. As such, equipped with our proposed liquidity rules, investors should re-evaluate the composition of their commodity exposures and consider broader, liquidity-aware universes to capture the return benefits these markets offer.
Please read our disclosures concurrent with this publication: https://www.researchaffiliates.com/legal/disclosures#investment-adviser-disclosure-and-disclaimers.


End Notes
1. Many commodity funds are set up as “limited partnerships” with pass-through taxation, and the K-1 is the associated tax form.
2. BCOM determines the weightings of constituents based on liquidity and US dollar-weighted production data subject to single and group commodity-exposure constraints.
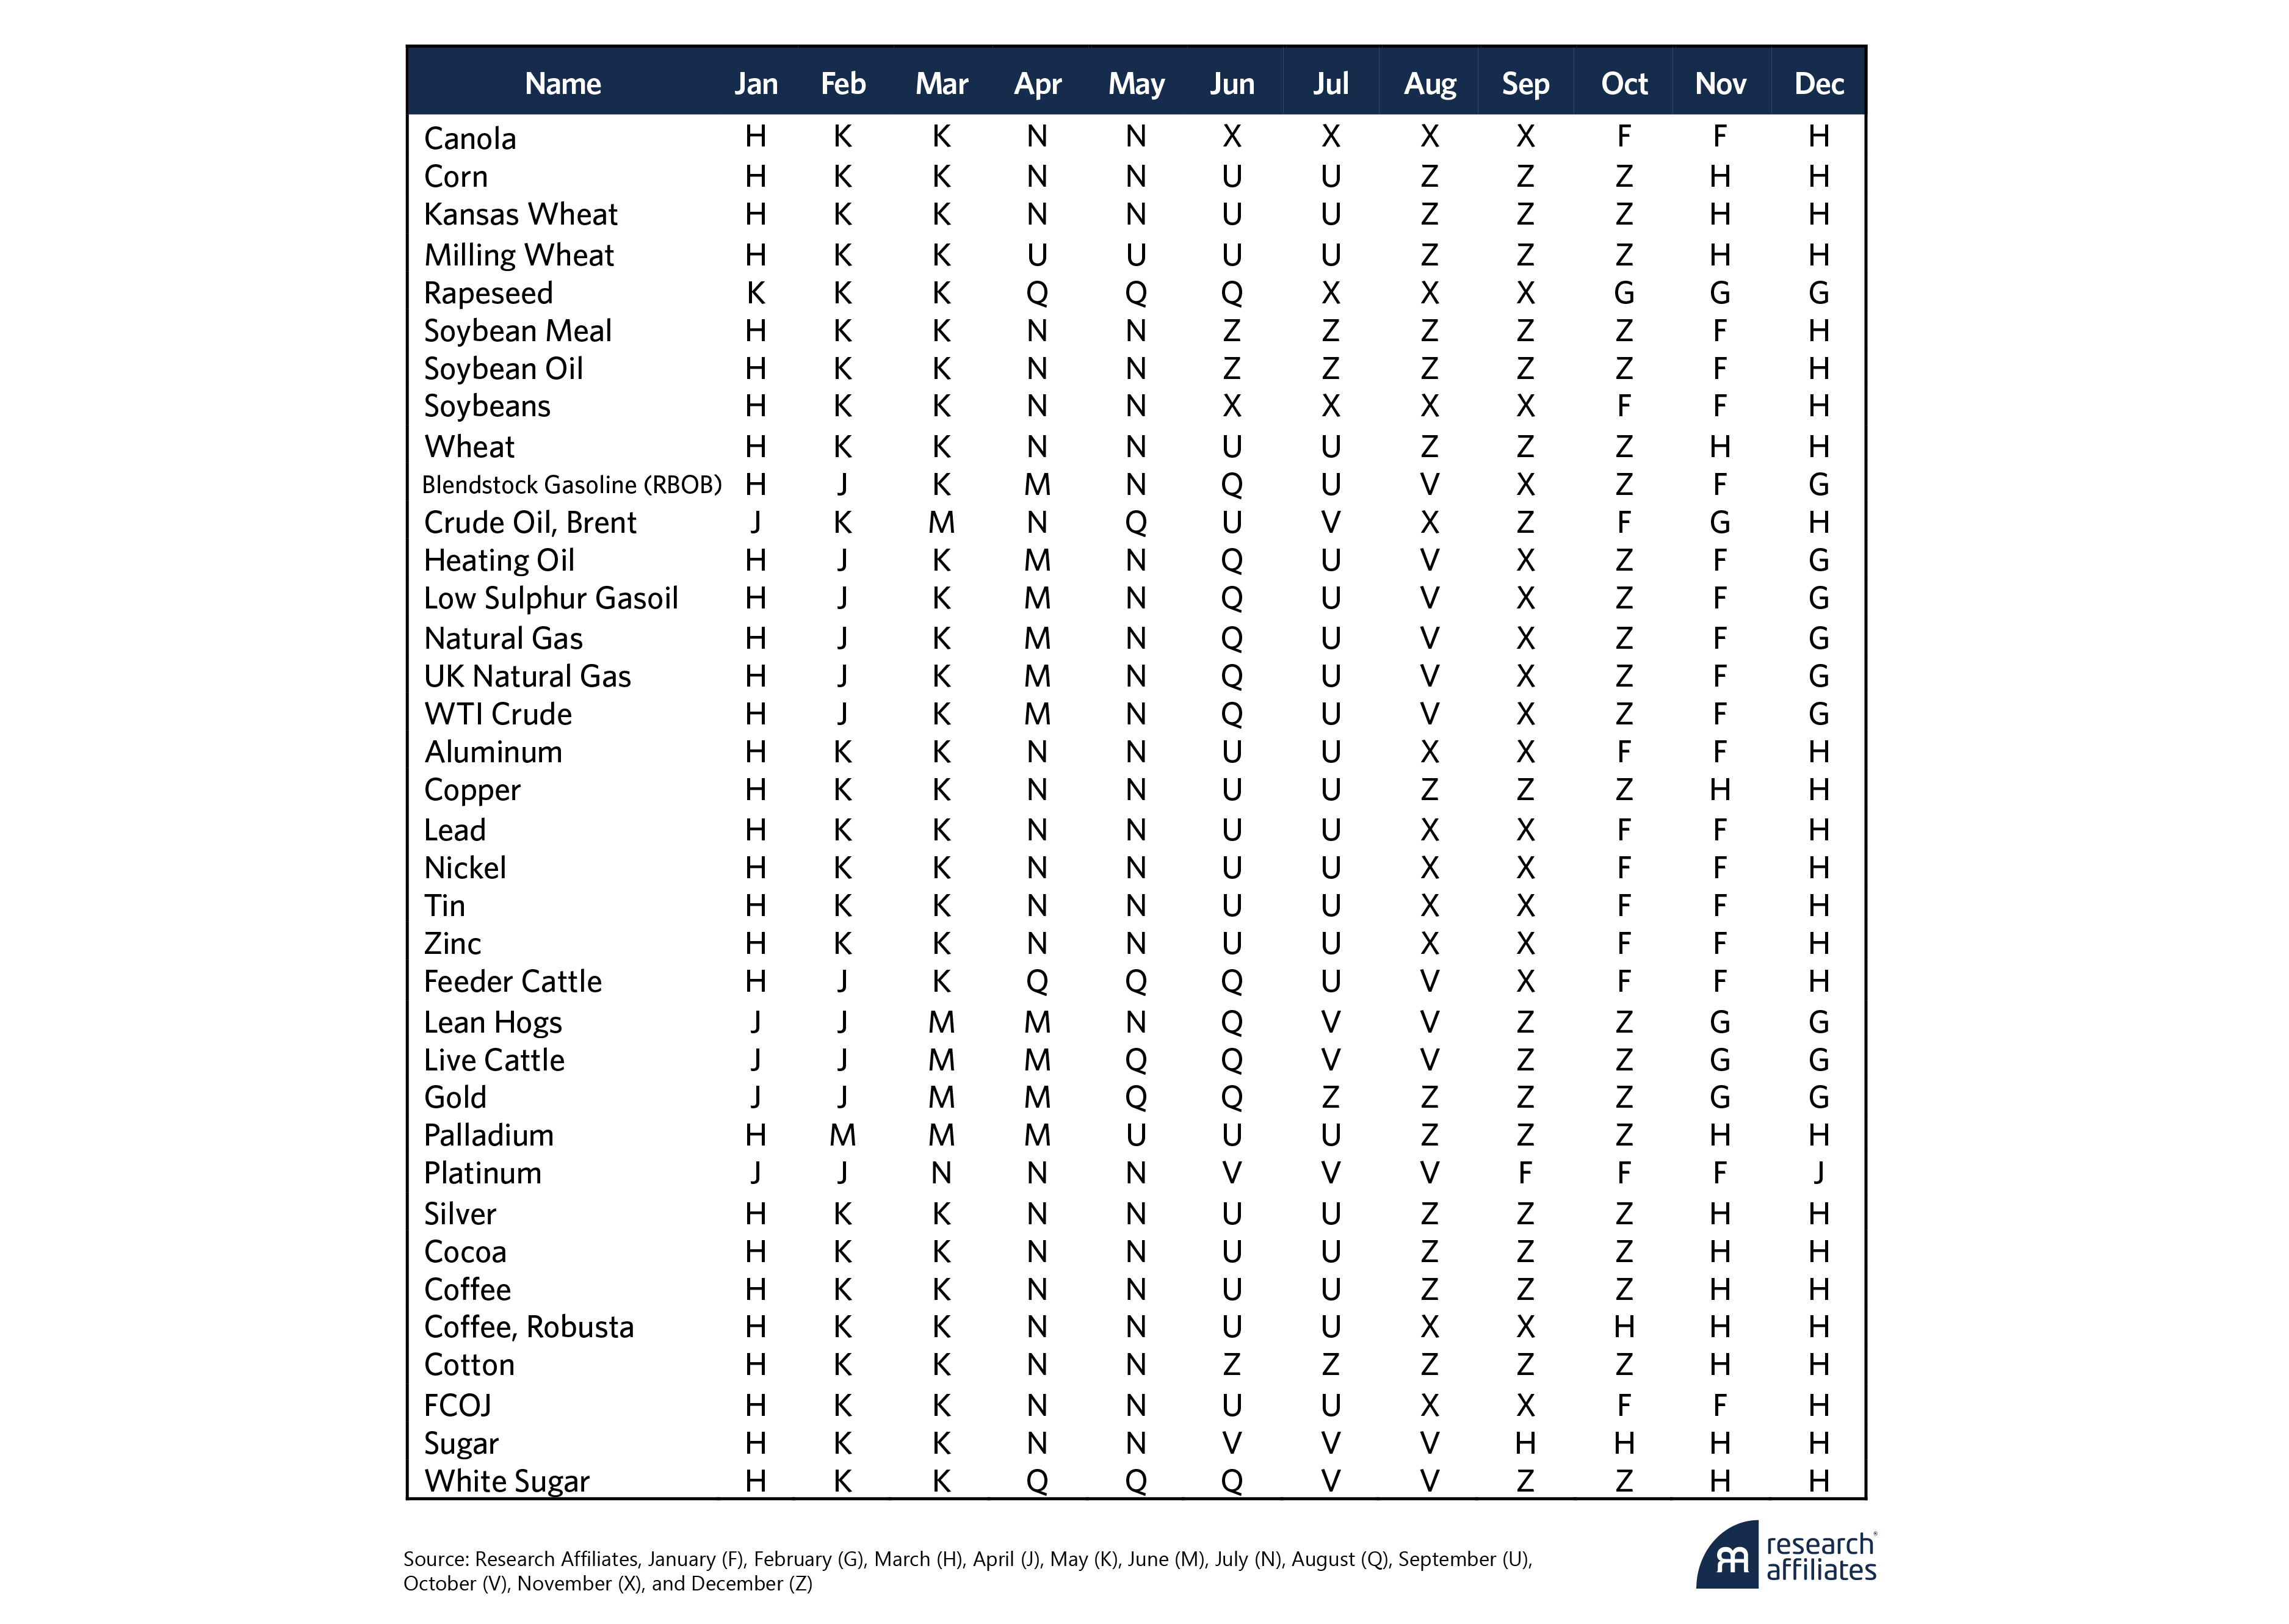
3. See the appendix for each commodity’s specific roll schedule.
4. In this article, we include UK Natural Gas. In recent years, the liquidity of Dutch Natural Gas has eclipsed that of UK Natural Gas. However, we focus on UK Natural Gas due to data availability and higher liquidity in past years.
5. In this section, we remove the four industrial metal commodities (Aluminum, Copper, Nickel, and Lead) and our PLUS commodity (Tin) from these numbers. Due to data limitations, we measure capacity and tradability with data from other sources. While we are confident in the liquidity of all five assets, the data is not apples-to-apples with the other assets and was removed for interpretability.
6. JPX Rubber, Oats, and Rough Rice are not included in PLUS as they do not meet our capacity criterion. (Investors with smaller portfolios can also consider including these commodities in their universe.) Milk, Cheese, and Butter, on the other hand, failed to meet both our capacity and tradability criteria.
7. Asset volatilities are estimated with historical daily returns using a one-year window and six-month half-life, taking the max volatility of trailing 1.5 years.
8. Attentive readers will notice the full period difference in average returns is not quite statistically significant, though it is over the last 10 years.
9. The outperformance of our Liquid equal-volatility portfolio relative to BCOM is around 3% per annum over the past 25 years, which is consistent with the performance difference between the “inverse volatility” portfolio and BCOM from 2006 to 2019 shown in Ghia, Kartik, Zarvan Khambatta, and Michael K. Donat, “Commodity Investment Insight: Sector Characteristics.” Bloomberg, November 6, 2019.
10. The exposure constraints follow Asset Allowable Portfolio Exposure discussed previously, with a 30% cap to address portfolio concentration concerns for liquid commodities. Consistent with BCOM’s methodology, this limits the exposure of one single instrument to 15% of the entire portfolio. The exposure change constraints are half of the exposure constraints, representing at most 10% (i.e., > 90% haircut) of each instrument’s capacity to control market impact. For the purpose of this article, we assume the constraints are static and apply them across the entire backtesting period.
11. Trading costs include transaction cost (occurs on exposure change) and roll cost (occurs on contract rolling). Both costs are estimated with bid-ask spread, approximately 2x tick size of a futures contract.
12. The cumulative return contribution over the past 25 years is –0.58%, which is close to 0.
13. In fact, if we remove UK Natural Gas, the average volatility-adjusted roll yields for the remaining PLUS commodities are 3.5%, 3.3%, 15.7%, and 16.9% for ITD, 10-year, five-year, and three-year windows, respectively, all of which are positive and far exceed the average volatility-adjusted roll yields of the liquid commodities.
14. Gross leverage across portfolios remains constant.
15. Buying assets that have declined in relative value and selling assets that have appreciated in relative value.
References
Amihud, Yakov. 2002. “Illiquidity and Stock Returns: Cross-Section and Time-Series Effects.” Journal of Financial Markets 5 (1): 31–56.
Asness, Clifford S., Tobias J. Moskowitz, and Lasse Heje Pedersen. 2013. “Value and Momentum Everywhere.” Journal of Finance 68 (3): 929–985.
Declerck, Philippe, and Thomas Vy. “Increasing Diversification of Commodities Trend-Following Strategies.” SSRN, June 20, 2024.
Erb, Claude B., and Campbell R. Harvey, “The Tactical and Strategic Value of Commodity Futures.” SSRN, January 12, 2006.
Fernandez-Perez, Adrian, Bart Frijns, Ana-Maria Fuertes, and Joelle Miffre. 2018. “The Skewness of Commodity Futures Returns.” Journal of Banking & Finance 86: 143–158.
Koijen, Ralph S. J., Tobias J. Moskowitz, Lasse Heje Pedersen, and Evert B. Vrugt. 2018. “Carry.” Journal of Financial Economics 127 (2): 197–225.
Quantica Capital. “When Trend-Following Hits Capacity: A Case Study in Commodities.” Quarterly Insights, March 15. 2025.
Willenbrock, Scott. 2010. “Diversification Return, Portfolio Rebalancing, and the Commodity Return Puzzle.” Financial Analysts Journal 67 (4): 42–49.
Appendix: Roll Schedules